Case 20
Indication: Lump in right breast.
History: Unremarkable.
Risk profile: No increased risk.
Age: 60 years.
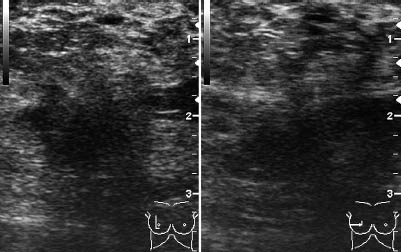
Fig. 20.1 Ultrasound, right breast.
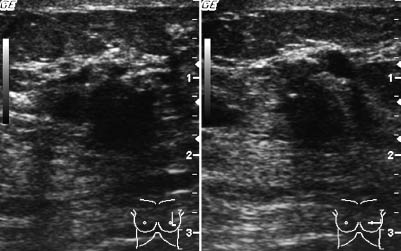
Fig. 20.2 Ultrasound, left breast.
Clinical Findings
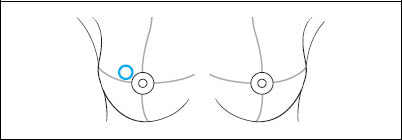
Palpable resistance in upper outer quadrant of the right breast. No findings in the left breast.
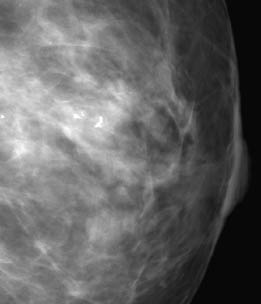
Fig. 20.3 Magnification view of the left breast (MLO).
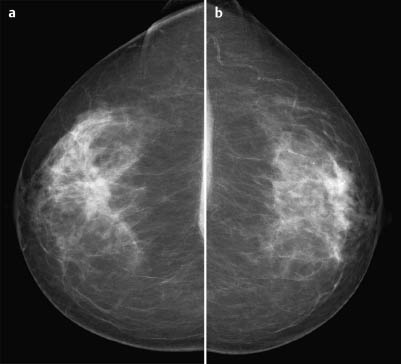
Fig. 20.4a,b Digital mammography, CC view.
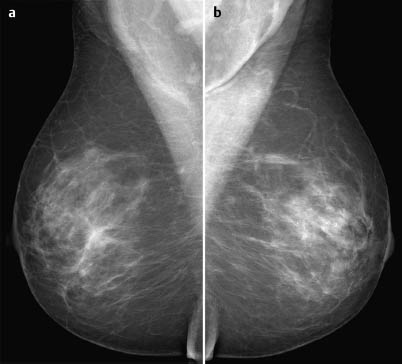
Fig. 20.5a,b Digital mammography, MLO view.
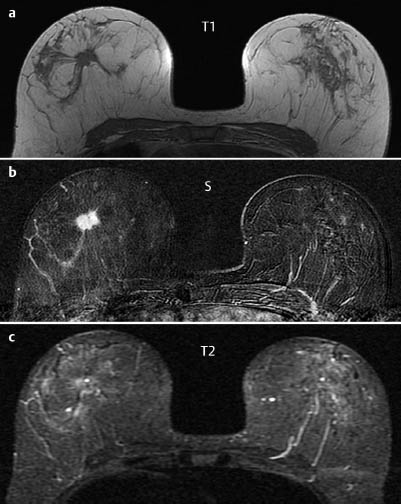
Fig. 20.6a-c Contrast-enhanced MRI of the breasts.
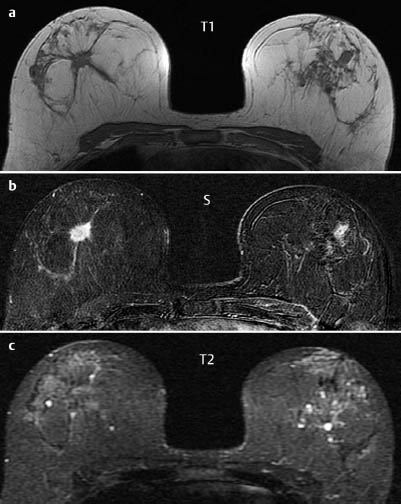
Fig. 20.7a–c Contrast-enhanced MRI of the breasts.
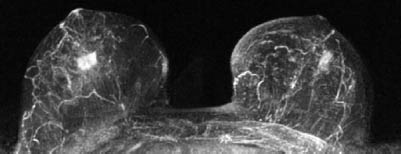
Fig. 20.8 Contrast-enhanced MR mammography. Maximum intensity projection.
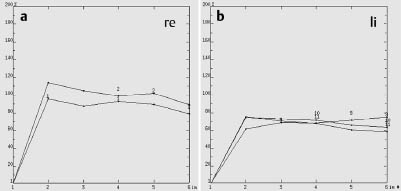
Fig. 20.9 Signal-to-time curves of lesions in right (a) and left (b) breasts.

|
Please characterize ultrasound, mammography and MRI.
What is your preliminary diagnosis?
What are your next steps? |


