28 Diffusely Abnormal Marrow Signal within the Vertebrae on MRI
28.1 Introduction
Oncologists are frequently consulted to evaluate patients who have an MRI report stating: “The marrow signal is diffusely abnormal. Clinical correlation recommended.” Although marrow signal that is diffusely HYPERINTENSE on the T1-weighted images (i.e., fatty replacement) is a normal feature of the adult spine, diffuse HYPOINTENSITY is cause for greater concern and most often warrants further investigation. 1 , 2
In a retrospective study of patients whose MRI report stated that their marrow signal was “abnormal” or “heterogeneous,” roughly 50% received a definitive diagnosis, of which 25% were found to have a malignancy (e.g., lung cancer, breast cancer, lymphoma, or multiple myeloma). The study concluded with the admonition that abnormal bone marrow findings on MRI should not be ignored. 3
This chapter begins with a case presentation of “patchy, heterogeneous marrow signal” on a spine MRI that created concern for malignancy but was a normal variant. The two case presentations that follow demonstrate unquestionably abnormal bone marrow signal changes, both of which were due to hematological malignancy.
Importantly, this chapter will describe the normal appearance of bone marrow on MRI and patterns of red to yellow marrow conversion and reconversion. Understanding normal, age-related changes will assist in recognizing diffuse marrow signal abnormalities that necessitate further evaluation.
28.2 Diffuse Abnormal Marrow: Normal Variant
28.2.1 Case Presentation
The patient is a 63-year-old, neurologically intact, woman with MRI of the lumbosacral (LS) spine performed for back pain (▶ Fig. 28.1).
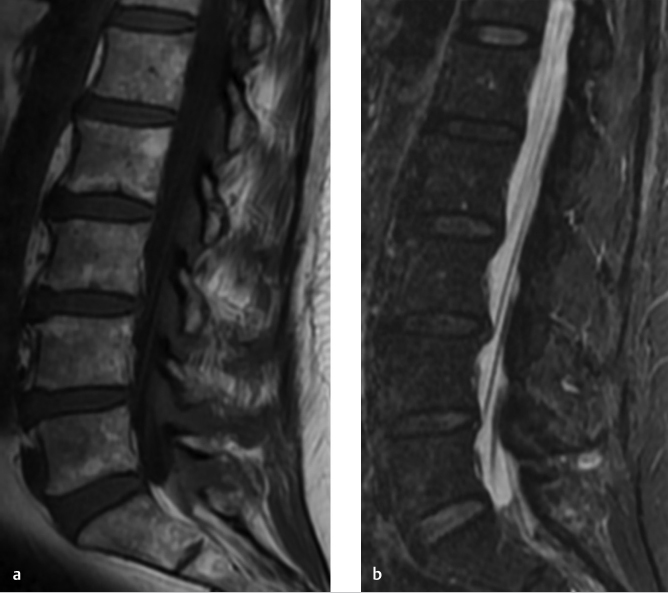
The marrow signal was originally interpreted as “diffusely abnormal with concern for malignancy,” which led to a referral to a cancer center for further evaluation.
28.2.2 Imaging Findings and Impression
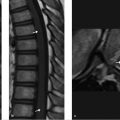
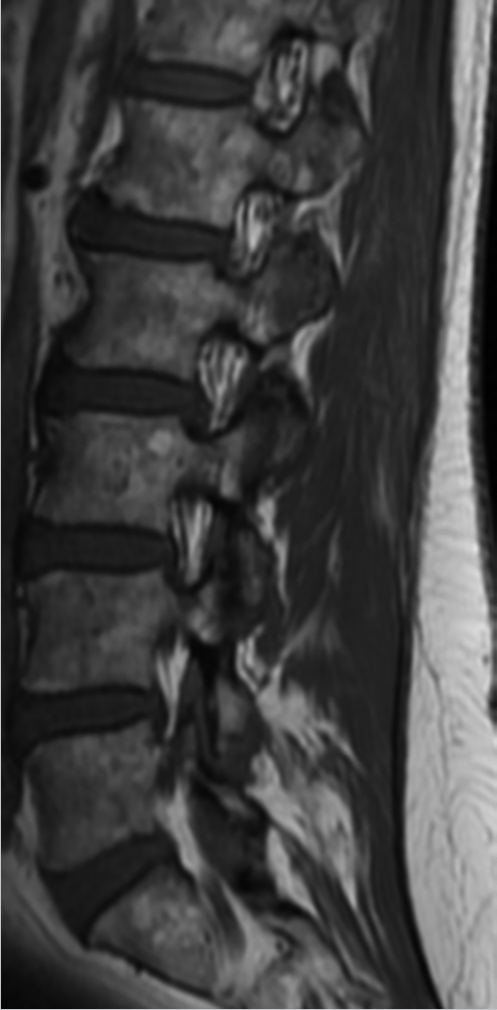
The bone marrow signal is heterogeneous with large, multifocal, patchy but ill-defined, areas of slightly lower signal intensity on the T1WIs. However, these areas of heterogeneity remain higher in signal than both skeletal muscle and intervertebral disks. On the fat-suppressed T2-weighted image (▶ Fig. 28.1b; T2WI), no focal areas of increased signal are seen and the marrow remains iso- to hypointense relative to skeletal muscle. On the T1WI, small islands of central high signal can be seen within the red marrow (arrows, ▶ Fig. 28.3), which has been found to be an indicator of a benign process. 4

This heterogeneous marrow signal most likely represents patchy conversion of red to yellow marrow that is a well-described normal variant seen predominantly in older adults. 5
It is important to understand that although patchy, heterogeneous marrow signal may be seen in the normal older population, this appearance does not exclude the possibility of metastatic disease or especially that of multiple myeloma. Multiple myeloma may present with a number of different appearances on MR including multifocal discrete lesions, diffuse decreased signal intensity, “salt-and-pepper” appearance, and finally with completely normal-appearing marrow signal.
28.2.3 Additional Testing Options
In equivocal cases, in which there is uncertainty as to whether an area of lower signal on the T1WI represents focal red marrow versus malignancy, and the “bull’s eye sign” is not seen, more advanced MRI techniques may be helpful.
In-phase/opposed-phase imaging. This technique takes advantage of the lower frequency of fat-related proton spins relative to protons associated with water molecules. This difference results in fat and water signal going in and out of phase periodically.
If there is a greater than 20% signal drop on the out-of-phase images, this implies the area contains normal red marrow, whereas no signal decrease may occur in areas in which fat has been replaced by malignant infiltrating cells. 6
m-Dixon calculation of fat fraction. This technique utilizes m-Dixon fat suppression techniques, which may be used to determine fat fraction within normal versus pathologically infiltrated bone marrow.
It has been shown to help in distinguishing normal red marrow and performed better than contrast-enhanced ratio analysis in one study. 7 , 8
28.2.4 Clinical Evaluation
As the report of the MR stated there was “concern for malignancy,” the patient was referred to an oncologist where a history was obtained and physical examination performed with emphasis on the presence of constitutional symptoms (fever, night sweats, weight loss, or significant fatigue), as well as symptoms or physical findings concerning the underlying malignancy. The patient was encouraged to undergo age-appropriate screening tests such as mammogram and colonoscopy. It is recommended to do a CBC (complete blood count), CMP (comprehensive metabolic panel), SPEP (serum protein electrophoresis), UPEP (urine protein electrophoresis), and serum-free light chain assay to exclude the possibility of a hematological disease, especially plasma cell disorders. If these tests are normal, no further workup is necessary.
Final Diagnosis: Patchy, heterogenous marrow is most likely due to normal, age-related conversion of red to yellow marrow.
28.2.5 Differential Diagnosis of Diffuse, Heterogeneous Marrow Signal
Normal variant: In the adult patient, normal conversion from red to yellow marrow may be patchy in a multifocal manner. In younger patients, islands of preserved red marrow may be present. On the T1WIs, it is not lower in signal than adjacent disks or skeletal muscle. On the fat-suppressed T2WIs, it is not significantly higher in signal than skeletal muscle.
Hematological malignancy: Especially multiple myeloma, which may present with a “salt-and-pepper” appearance.
Red marrow reconversion (myeloid hyperplasia): This may be seen in times of hematopoietic stress. Clinical examples include severe hemolytic anemias, heart disease with chronic heart failure, heavy smoking, obesity, endurance athletics, and chemotherapy involving granulocyte colony–stimulating factors.
Diffuse metastatic disease: Usually multifocal lesions rather than diffuse, uniform replacement.
28.2.6 Essential Information regarding Bone Marrow Signal on MRI
Normal bone marrow: red marrow distribution, appearance on MR, age-related conversion and reconversion 9 , 10 , 11 , 12 , 13 :
In the fetus and very early neonatal period, all marrow is hypercellular red marrow. The imaging characteristics are as follows:
T1WI: low in signal.
Fat-suppressed T2WI: high in signal.
DWI (diffusion-weighted imaging): restricted diffusion, high in signal.
Gradient echo (GRE) in-phase/out-of-phase imaging: no signal loss.
Red marrow becomes progressively fatty infiltrated with age and is typically is 40% fat, 40% water, and 20% protein. The imaging characteristics are as follows:
T1WI: after the first year of life (90% of children after age 5), slightly higher in signal than intervertebral disks.
Fat-suppressed T2WI: isointense to slightly higher in signal than skeletal muscle
DWI: Typically, there is no restriction of diffusion in the bone marrow outside the neonatal period. However, at high b values, red marrow may be bright relative to fatty replaced marrow.
GRE in-phase/out-of-phase imaging: signal loss by greater than 20% on out-of-phase images.
Yellow marrow is typically 80% fat, 15% water, and 5% protein. The imaging characteristics are as follows:
T1WI: very high in signal.
Fat-suppressed T2WI: very low in signal.
Red to yellow marrow conversion occurs normally with aging and should be symmetric, beginning peripheral to central and distal to proximal: epiphysis → diaphysis → distal metaphysis →proximal metaphysis.
In the pelvis, fatty marrow replacement begins around the age of 20 years in the superomedial aspect of the acetabulum.
The clivus and skull should be of high signal on the T1WIs after the age of 15 years. 14 , 15 , 16
In the spine, normal fatty marrow replacement is variable, as described by Ricci et al, 5 with marrow signal remaining as low as the intervertebral disks until the age of 10 years when early fatty conversion is seen in the region of the basivertebral plexus (Ricci pattern type 1). In older adults, marrow signal becomes progressively higher in either a diffuse or a multifocal pattern. Ricci type 2 consists of bands or triangular areas of high T1 signal near the end plates, whereas Ricci type 3 consists of patchy areas of red marrow interspersed with small multifocal or large multifocal areas of higher T1 signal. Patterns 2 and 3 are seen more commonly with advancing age.
Adult distribution of red marrow is reached by 25 years of age with it remaining only in the axial skeleton, flat bones, and proximal humerus and femur.
Marrow reconversion, from fatty to cellular red marrow, occurs in the reverse fashion of normal maturation conversion from hematopoietic to fatty marrow. Reconversion occurs symmetrically in the central skeleton and proceeds peripherally. Within long bones, it occurs first in the proximal metaphysis, then distal metaphysis, and finally diaphysis.
28.2.7 Pearls and Pitfalls in Interpretation of Bone Marrow Signal on MRI
The T1WIs are most important for the evaluation of bone marrow.
Although the midline sagittal images are best for looking at marrow and disk space signal, the majority of tissue visualized in the paraspinous compartment on the midsagittal image is ligamentous. Examine the signal intensity of paraspinous musculature in an area that is least fat infiltrated on parasagittal images, to the side of midline. Axial and coronal images can be helpful.
Fat-suppressed T2WIs are exquisitely sensitive for detection of increased water content within the marrow from any source including malignancy, trauma, infection, and degenerative disk disease. A complete differential diagnosis should include other considerations when abnormal marrow is seen.
The non–fat saturated FSE-T2 W sequence should not be used in the evaluation of bone marrow signal as both pathologic lesions and normal bone marrow appear high in signal. Normal fat signal must be suppressed by either inversion recovery (STIR), chemical fat saturation, or m-Dixon techniques in order for the sequence to become sensitive to pathology.
In the normal adult, and usually after the age of 10 (90% of children older than 5 years), marrow should be higher in signal than muscle and the intervertebral disks due to the presence of fat interspersed with hematopoietic tissue on T1WIs. 17 On T1WIs at 1.5 T, hypointense marrow relative to intervertebral disk space signal was 98% accurate in predicting malignant infiltration versus normal hematopoietic marrow. Accuracy using skeletal muscle was slightly less at 94%. 18 On T1WIs at 3.0 T, highest accuracy was obtained using skeletal muscle, as the reference (89%) with a lower accuracy of 78% obtained from using intervertebral disk space signal. 19
The epiphyses, after the first few months of life, should be high in signal on the T1WIs. Low epiphyseal signal in an adult, indicating the presence of cellular marrow, is always suspicious for malignant infiltration unless the entirety of the marrow has already undergone reconversion. 20
Beyond the neonatal period, hypointense marrow signal that is lower than adjacent skeletal muscle and intervertebral disk spaces on T1WIs is almost always pathologic. 11
Patchy areas of red marrow, either preserved or due to reconversion of yellow marrow, may closely mimic pathologic bone marrow infiltration.
Diagnostic clues that suggest benign red marrow:
Red marrow reconversion is symmetric and bilateral (more helpful when evaluating coronal images of the pelvis and sacrum than on a routine spine MR).
Signal intensity of normal red marrow is only slightly greater or equal to that of skeletal muscle on fat-suppressed T2WIs. Very “bright” marrow signal on STIR is more likely to represent pathologic infiltration.
The cortex should be intact and not expanded in red marrow reconversion.
Bull’s eye sign: Normal red marrow often has focal areas of preserved increased signal on T1WIs due to the presence of macroscopic fat. This sign has been reported to have 95% sensitivity and 99.5% specificity for benignancy. 4
Dynamic contrast-enhanced imaging: red marrow enhances much less than tumor on post-GBCA T1WIs and has slow wash-in, low maximal peak, and minimal to no apparent wash out.
Diffusion-weighted imaging: normal bone marrow has low apparent diffusion coefficient (ADC), which decreases with aging. However, there is much overlap between ADC values of hypercellular, but normal, red marrow and malignancy. Infectious lesions cannot be distinguished from malignant lesions on the basis of ADC values.
Chemical shift imaging is an excellent problem-solving technique and can help distinguish red marrow from pathologic infiltration. When fat and water coexist in the same voxel, their spins will be out of phase periodically due to the lower precessional frequency of fat relative to water.
Pearls: Red marrow, consisting of similar amounts of fat and water, shows a significant decrease in signal intensity on out-of-phase GRE images. Lack of signal intensity decrease between the in-phase and opposed-phase images suggests that normal marrow fat has been replaced completely by tumor. 6 However, it is important to recognize that completely fatty replaced marrow will also not show signal loss. Therefore, it is the combination of abnormally low signal on T1WI and lack of signal drop between the in-phase and opposed-phase GRE images that is suspicious for malignant infiltration. This technique may also help differentiate benign from malignant compression fractures based on the same principles in which a malignancy will completely replace fat with cellular tumor before causing pathologic collapse. 21
Pitfalls: False negatives have been reported in multiple myeloma, sclerotic metastatic disease, and renal cell carcinoma. False positives have been reported in marrow fibrosis and hematomas. 22
28.2.8 Companion Case: Examples of Adult Normal Bone Marrow on MRI


Stay updated, free articles. Join our Telegram channel

Full access? Get Clinical Tree


