3 Going Beyond the Conventional Morphological Imaging: An Overview of Functional Imaging Techniques
Going Beyond the Conventional Morphological Imaging
3.1 Introduction
The goals and requirements for brain tumor imaging are to make a diagnosis or a differential diagnosis or both, whereas accurate lesion grading and delineation are needed in the case of tumor description and risk assessment. Imaging is also involved in the decision-making process for therapy and later for precise planning of surgical or radiotherapeutic interventions, both of which require an optimal detection and delineation of the lesions. After therapy, neuroimaging techniques are mandatory for monitoring disease and to identify and monitor possible therapy-related side effects.
Magnetic resonance imaging (MRI) is initially focused on the superb contrast and spatial resolution of neuronal tissue to enable a detailed morphological analysis. Recent developments, however, have focused on evaluating contrast and spatial resolution in conjunction with additional functional assessments. The characterization of neoplasm using physiological or pathophysiological characteristics has long been the domain of positron-emission tomography (PET).
Whereas PET has significantly improved our pathophysiological understanding of the central nervous system (CNS), the availability of MRI contrast agents and improved MR rapid imaging sequences are now enabling further noninvasive characterization of physiological tissue and diseases. Functional information can reflect macrovasculature, the breakdown of the blood–brain barrier (BBB) with resulting permeability for the contrast agent, and tissue perfusion. Neurofunctional magnetic resonance imaging (nfMRI) is a recently established technique that increases our diagnostic potential in the neurosciences, whereas MR-spectroscopic techniques such as chemical shift imaging (CSI) allow a detailed metabolic analysis of the neuronal or pathological tissue.
The overall diagnostic aim of functional neuroimaging of CNS neoplasms is to optimize tumor characterization, with an emphasis on improved specificity to separate benign from malignant features. Specific characterization facilitates planning of the most appropriate treatment. Furthermore, functional neuroimaging of CNS neoplasms can be expanded for monitoring ongoing therapy and for early detection of therapeutic side effects. The predictive assessment of therapy response, and monitoring ongoing therapy to guide therapeutic intervention, are major challenges in the current treatment of CNS neoplasms. This chapter provides a broad overview of the available functional neuroimaging methods and their use for detecting and monitoring neoplasms and their therapeutic interventions. Details on the individual techniques and their clinical impact are described separately in this chapter.
3.2 Magnetic Resonance Spectroscopy
Proton magnetic resonance spectroscopy (MRS), or spectroscopic imaging, is one of the first functional imaging techniques that provides detailed tumor information beyond the morphological characteristics. The method has become a common clinical tool, especially in the diagnostic workup of tumors and the differentiation from normal or physiological neuronal tissue changes.
There are different elements that allow a spectroscopic characterization; however, due to its dominant presence that allows the best signal-to-noise ratio, 1H protons are used most commonly in clinical practice. The spectroscopic characterization of brain abnormalities relies mostly on the calculations of ratios between the main proton spectrum metabolites, notably N-acetylaspartate (NAA), a neuronal marker, choline-containing compounds (Cho), a marker of membrane turnover, and creatine (Cr) including the phosphocreatine compound, and on the presence of lipids and lactate. 1 , 2 , 3 , 4 , 5 , 6 Brain tumors typically have loss of NAA and an increase in the Cho content (Fig. 3.1). MRS has also been used to differentiate nontumor lesions, such as hamartomas, from gliomas. 7 , 8 Several studies have reported that hamartomas did not differ significantly from the normal brain or physiological changes, whereas gliomas had lower NAA:Cr, Cr:Cho, and NAA:Cho ratios (Fig. 3.2). In patients with seizures it is important to identify tumor changes from scar because this has a major impact on the further management of patients. In a study by Vuori et al, 6 patients with seizures and a cortical brain lesion on MRI scan were studied with proton MRS. A metabolite ratio analysis was performed, and the metabolite signals in the lesion core were compared with those in the contralateral centrum semiovale and in the corresponding brain sites of control subjects to separately obtain the changes in NAA, Cho, and Cr. In their study, 10 patients had a low-grade glioma (three, oligodendrogliomas; three, oligoastrocytomas; three, astrocytomas; and one, pilocytic astrocytoma), and eight had focal cortical developmental malformations (FCDM) (five, focal cortical dysplasias, and three, dysembryoplastic neuroepithelial tumors). The authors found that loss of NAA and increase of Cho were more pronounced in low-grade gliomas than in subjects with cortical developmental malformations. MRS was also able to differentiate between subtypes of gliomas.


In a study by Law, 9 which combined MRS with the later-described magnetic resonance perfusion, both methods enabled identification at a high sensitivity and a high positive predictive value for tumor grading when compared with conventional contrast-enhanced MRI. It is well known that a certain percentage of high-grade tumors do not present with a BBB disruption or vice versa. For biopsy planning and for treatment decision and management it is essential to identify the highest tumor grade in those often very morphologically homogeneous-appearing tumors. The author was also able to provide thresholds for the metabolite ratios for the diagnosis of a high-grade tumor. A review of the literature, taking into account differences in MRS technique such as the choice of echo time (TE) and the method used to determine metabolite ratios, demonstrates that the mean maximal values obtained for Cho:Cr and Cho:NAA and the mean minimum values for NAA:Cr ratios in the studies 1 , 7 were comparable to previously published data in differentiating between low- and high-grade gliomas.
As with many functional techniques, one of the challenges is standardized data acquisition and postprocessing. For data acquisition the same TE should be used, and data from the contralateral unaffected white matter should be acquired. Studies comparing long and short TE MRS studies found that a short TE provided a slightly better tumor classification. 10 , 11 In a study by Majós et al, only meningiomas profited from long TE acquisitions. 12
The use of modern scanner technology further allows measurement of spectroscopic data from more than a single voxel. Two- or three-dimensional MRS (2D or 3D CSI) enables acquisition from multiple small voxels, which provides more detailed information about lesion heterogeneity (Fig. 3.2). The voxel information can be used to calculate metabolite ratios, which can be color coded and superimposed on the anatomical images to allow better visualization (e.g., hot spots within a tumor).
Follow-up assessment of cerebral tumors is a promising field for MRS. Increases in size and contrast enhancement are typical findings in tumor progression but also reflect therapeutically induced changes. The same is true for postoperative changes. Often microbleeding is seen in the treated tissue. This may cause a local field inhomogeneity, which is a technical challenge for MRS (Fig. 3.3). However, the method allows supplementary information about the possible extent and nature of changes on a routine MRI scan by analyzing the metabolite ratios (Fig. 3.3). The ratio of choline to normal creatine level is usually significantly elevated in those areas consistent with tumor compared with those containing predominantly treatment effect. In fact, treatment effect is generally indicated by a marked depression of all the intracellular metabolite peaks from choline, creatine, and N-acetyl compounds. However, MRS alone may not be helpful in instances where patients have mixed histological findings consisting of necrosis and tumor. Because of this heterogeneity and as a result of low spatial resolution, MRS findings of choline and NAA resonances below the normal range may indicate variable histological findings ranging from radiation necrosis, gliosis, and macrophage infiltration to mixed tissues that contain some regions of tumor. The careful choice of voxel placement and interpretation of results in concordance with other imaging and clinical findings is critical in distinguishing between tumor- and treatment-related changes. Furthermore, validation studies using image-guided acquisition of tissue are needed to correlate imaging with biology.

3.3 Contrast-Enhanced Perfusion Magnetic Resonance Imaging in Brain Tumors
Perfusion can be assessed in several ways with MRI which is called the perfusion-weighted imaging (PWI), and has benefits for three major fields: differential diagnosis, biopsy planning, and treatment monitoring. 13 The most common way to assess perfusion in neuro-oncology is the contrast-enhanced first-pass dynamic susceptibility-weighted contrast-enhanced (DSC) magnetic resonance echoplanar imaging approach using the indicator dilution theory model. 14 , 15 Newer perfusion imaging approaches such as arterial spin labeling (ASL) do not need extrinsic contrast media application and use the blood as an intrinsic contrast medium. 16 Because the contrast media is injected routinely for brain neoplasm imaging, majority of centers prefer to perform DSC-MRI (using the same contrast media) for perfusion imaging.
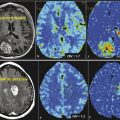
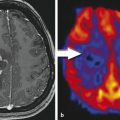
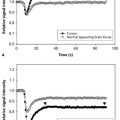
Because tumor specification is limited, and sometimes conventional MRI cannot discriminate glioblastoma from solitary metastases, CNS-lymphoma, or other tumor types, new methods such as perfusion MRI may play an increasingly important role. The results of the studies available in the literature, all with relatively limited patient numbers, indicate that DSC-MRI perfusion has proven to be a very useful diagnostic tool in the pretherapeutic workup of gliomas (Fig. 3.4), CNS lymphomas, and solitary metastases, as well as in the differentiation of these neoplastic lesions from infections and tumorlike manifestations of demyelinating disease. 15 , 17 , 18 , 19 Quite a large number of studies on brain tumor differentiation have found that PWI has superior diagnostic performance in predicting glioma grade (Fig. 3.4), providing follow-up information (Fig. 3.5), and differentiating gliomas from other primary or secondary tumor entities when compared with spectroscopic imaging and dynamic contrast-enhanced (DCE) PWI. 19


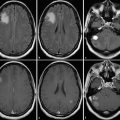
Because of a significantly higher tumor perfusion in glioblastomas compared with CNS lymphomas, a threshold value of about 1.4 for relative cerebral blood volume (rCBV) provided sensitivity, specificity, positive predictive value (PPV), and negative predictive values (NPVs) of 100, 50, 90, and 100% according to several publications. 15 , 18 Using ASL, the relative cerebral blood flow (rCBF) of lymphomas proved to be significantly lower than for high-grade gliomas (Fig. 3.6).

Although conventional MRI characteristics of solitary metastases and primary high-grade gliomas may sometimes be similar, MRI perfusion and MRS enable distinction between the two. 19 , 20 Although both intratumoral metabolite ratios, rCBV or rCBF values did not allow for discrimination between the two entities, analyzing the peritumoral T2-weighted hyperintense region enables discrimination between high-grade gliomas and metastases, given that CBV was significantly higher in peritumoral nonenhancing T2-weighted hyperintense regions of glioblastomas compared with metastases. Thus elevated perfusion in the peritumoral region of the lesion represents with high-specificity glioma in differentiation of gliomas from metastasis or grade one when differentiating World Health Organization (WHO) grade III meningioma. Hence PWI allows us to readily appreciate tumor extension past obvious gross anatomical boundaries on conventional MRI.
Correct grading of gliomas has a significant clinical impact because adjuvant therapy postsurgery is usually administered to high-grade but not to low-grade gliomas. Histopathology as the gold standard based on biopsy samples is limited due to the inherent sampling error in these heterogeneous tumors. Several studies reported that high-grade gliomas had higher relative regional CBV 17 and CBF than low-grade gliomas, and glioblastomas have the highest tumor perfusion among all other glioma grades. However, there is a significant overlap of tumor perfusion between high- and low-grade gliomas, which may be explained by the inherent glioma heterogeneity and the sampling error of biopsy samples. This overlap leads to a low specificity, especially when differentiating grade III from grade II gliomas on the WHO scale. Thus PWI has limited utility for an individual patient in making a specific diagnosis, but it may be of great clinical value for biopsy guidance because of the potential glioma heterogeneity with high-grade components that might be interspersed among low-grade components. Although PWI has a better diagnostic performance than conventional MRI techniques in distinguishing different tumor entities, PWI cannot eliminate the need for a biopsy and histological confirmation because modern treatment regimens also consider genetic mutations of tumor cells.
PWI has a tremendous impact on treatment monitoring of low-grade gliomas, besides the advantages in biopsy planning (Fig. 3.5). Because of the intact BBB, valid quantification of perfusion is possible in these entities. In case of a disrupted BBB, leakage of contrast agents from tumor vessels may cause an underestimation of tumor CBV. 20 In low-grade gliomas, determination of relative regional CBV measurements can be used to predict clinical response. In a recent study, low-grade gliomas that had progressed more rapidly (mean time to progression of 245 days) had significantly higher CBV than those with stable tumor volumes at follow-up (mean time to progression of 4,620 days). The authors proposed a threshold value of relative regional CBV (> 1.75) to indicate a propensity for malignant transformation. 21 The reason for this finding is presumably—as in biopsy planning—that PWI depicts focal anaplastic areas in low-grade gliomas that have not yet led to a disruption of the BBB and therefore to a contrast enhancement on conventional MRI. The same applies for low-grade gliomas after radiotherapy. PWI also detects a subset of patients with higher tumor CBV and shorter progression-free survival. 22 Thus PWI enables a better prediction of prognosis after radiotherapy than conventional MRI. But also, after antiangiogenic chemotherapy of gliomas, PWI has shown its potential to better predict treatment outcome than tumor volume determined on conventional MRI. 23 For other intra-axial lesions, such as brain metastases, 24 , 25 PWI has also shown its potential to better predict treatment outcome than tumor volume. In this context, a reduction of CBV was highly predictive of treatment response, whereas an increase in CBV was a hint for nonresponse. In extra-axial lesions, such as meningiomas, DCE-MRI might be a good alternative to DSC-MRI for treatment monitoring because the technique is not as susceptible as DSC-MRI to susceptibility artifacts arising from bone and air.
In summary, PWI delivers higher predicting values than conventional MRI by providing maps of the regional variations in cerebral microvasculature of normal and diseased brains. PWI can easily be incorporated as part of the routine clinical evaluation of intracranial mass lesions due to the relatively short imaging and data processing times and the use of a standard dose of contrast agent. Thus PWI together with conventional MRI should be regarded as the test of choice to diagnose and monitor brain tumors before, during, and after therapy. In some cases it might be beneficial to combine different perfusion MRI techniques—mainly DCE-MRI with DSC-MRI perfusion—to obtain a comprehensive picture of the pathology.
Related posts:
 7 Perfusion Imaging: Perfusion CT
 6 Perfusion Imaging: Arterial Spin Labeling
 1 Conventional Morphological Imaging: MRI Remains the Workhorse
 15 Image-Guided Neurosurgery: Intraoperative MRI
 18 On the Horizon: Going Beyond Conventional MR Contrast Agents
 13 It’s Not Just the Tumor: Treatment Effects
Stay updated, free articles. Join our Telegram channel

Full access? Get Clinical Tree


