6 Perfusion Imaging: Arterial Spin Labeling
6.1 Introduction
Over the last 20 years, magnetic resonance (MR) perfusion imaging techniques have been used for evaluation of tumor vasculature in various settings such as tumor grading, biopsy guidance, recurrence versus radiation necrosis, response assessment, and prognostication. Perfusion MR techniques can be divided into two general categories: those that employ exogenous tracer (gadolinium-based contrast agents) and those that use endogenous tracers, such as arterial spin labeling (ASL). Contrast-based methods can be further divided into T1-weighted steady-state dynamic contrast-enhanced magnetic resonance imaging (DCE-MRI) and T2*-weighted dynamic susceptibility weighted contrast-enhanced MRI (DSC-MRI). Of these methods, DSC-MRI has been of more widespread use in the clinical setting, and many investigators have compared this method with ASL in various aspects of brain tumor imaging.
ASL perfusion has become more widespread in recent years secondary to emergence of higher magnetic field MR scanners, refinement and development of improved and more robust pulse sequences, and the clinical release of the ASL pulse sequences by most major MRI vendors. This chapter discusses ASL perfusion MRI for evaluation of various aspects of brain tumors.
6.2 General Principles of ASL Imaging
In order to measure the blood flow delivered to the brain tissue, water molecules in the inflowing arterial blood are labeled by inverting the magnetization outside the imaging plane. After a postlabeling delay (PLD), during which time there is T1 decay of the label, labeled blood water reaches the target tissue by crossing the blood–brain barrier, and an image is acquired, which is called the label image. A control image is then acquired without labeling of arterial blood. The subtraction of label and control image will be proportional to amount of cerebral blood flow. 1
There are three major classes of ASL based on different tagging techniques as described in the following section. Detailed discussion about methodology and advantages/disadvantages is beyond the scope of this chapter, and interested readers are referred to excellent reviews on this subject. 2 , 3
6.2.1 Pulsed Arterial Spin Labeling
In pulsed ASL (PASL), short (5–20 ms) inversion pulses are applied 4 in a thick slab located next to the slice of interest. There are different types of PASL based on the location of the tagging plane and the magnetic state of labeled spins for the control and labeled images. In echoplanar imaging and signal targeting with alternating radiofrequency (EPISTAR) the magnetization is inverted in a thick slab proximal to the imaging slab, whereas for the control image, inversion pulse is applied in a symmetrical slab distal to the imaging slice. 5 Proximal inversion with a control for off-resonance effects (PICORE) is a derivative of EPISTAR, which uses the same label, but, to compensate for magnetization effect without inverting the magnetization, an off-resonance inversion pulse is applied in the control image at the same frequency offset relative to the imaging slice as the label. 6 Another PASL method, which is called flow-sensitive alternating inversion recovery (FAIR), consists of imaging with two sets of inversion recovery pulses, one being slice selective and another non–slice selective. 7 Several refinements have also been made to optimize PASL sequence. Inversion efficiency has been improved by adiabatic hyperbolic secant (AHS) radiofrequency (RF) pulses, which are insensitive to B1 field inhomogeneity. 5 , 8 Labeling plane slice profile was also achieved with frequency offset correction inversion AHS RF pulses. 9 Other methods known as quantitative imaging of perfusion using a single subtraction (QUIPSS), QUIPSS II, and Q2TIPS (QUIPSS II with thin-slice inversion time [TI1] periodic saturation) apply a saturation between the labeling pulse and image acquisition 10 to sharply define the distal edge of the tagging plane and prevent systematic bias resulting from spatially varying delay in the transit of blood from the tagging region to the imaging slice. Overall, the advantage of PASL is high labeling efficiency and lower RF power deposition, but it has lower perfusion sensitivity. Recently Petersen et al developed a new version of the PASL sequence, named quantitative signal targeting by alternating radiofrequency (STAR) labeling of arterial regions (QUASAR). 11 They acquired images at different inversion times after labeling, to determine whole signal difference curve over time. Voxel-by-voxel arterial input functions were then estimated by subtracting two perfusion-weighted images acquired with and without crusher gradients, respectively, leading to calculation of a parameter named arterial blood volume (aBV) based on a velocity exceeding a predefined threshold.
6.2.2 Continuous Arterial Spin Labeling
In continuous ASL (CASL), long and continuous RF pulses (1–2 s) are applied to continuously label the blood, below the imaging plane, usually at the base of the brain, to induce a flow-driven adiabatic inversion in a narrow plane of spins. 12 Continuous inversion led to higher perfusion sensitivity in CASL compared with PASL; however, it also partially excited the imaging plane through the magnetization transfer (MT) effect, which must be compensated for to avoid overestimation of perfusion. 12 In addition, long labeling pulses and techniques that are used to compensate the magnetization transfer (MT) effect deposit high levels of RF energies to the patient, which may exceed the specific absorption rate (SAR), limiting the use of CASL, especially in high-field MR. The MT effect can be avoided by the use of two RF coils, but this technique also requires special hardware that is not commonly available on commercial scanners.
6.2.3 Pseudocontinuous Arterial Spin Labeling
In pseudocontinuous ASL (PCASL) a train of discrete RF pulses are applied in conjunction with a synchronous gradient field to mimic a flow-driven adiabatic inversion seen in CASL. 13 This technique creates a better balance between the labeling efficiency and the perfusion signal to noise ratio, in addition to reducing MT effects and RF power deposition compared with CASL methods. In addition, a standard body coil can be used for transmission in PCASL, which eliminates the need for a dedicated transmit coil. The disadvantage of PCASL is that it may be susceptible to B0 inhomogeneity and eddy currents, depending on implementation. 14 Of the three leading ASL techniques, PCASL will likely emerge as the most robust clinically available pulse sequence.
6.2.4 Strategies to Improve Arterial Spin Labeling
Magnetic Field
Due to the intrinsic low signal-to-noise ratio (SNR) of ASL techniques, using a high magnetic field strength can improve the SNR. 15 , 16 In addition, lengthening of T1 is another factor that allows more spins to reach and accumulate in the image slab. Previous studies have shown doubling of signal performing CASL/PASL at 3 and 4 T, compared to 1.5 T. 15 , 16
Phased Array Receiver Coils and Parallel Imaging
Another approach to increase SNR is to use a phased array of receiver coils. Use of these coils is associated with inhomogeneity of received signal; however, calibration steps involved in perfusion quantification leave the final cerebral blood flow (CBF) maps unaffected, 17 and SNR will be increased not only in the regions close to the coil but in the entire image. Another advantage of phase array coils is the potential for using parallel imaging, which can also be helpful by shortening the imaging time and reducing image distortion from susceptibility artifacts. 17
Crusher Gradients
Crusher gradients are an option with most clinical releases, but they have a significant influence on the appearance of pathology with ASL. Crusher gradients are applied prior to image acquisition to null the signal from intravascular moving spins. If these spins are not eliminated, quantification of CBF derived from ASL will be artificially high in slow-flow states where the ASL signal is predominantly intravascular. Ye et al 18 proposed the use of bipolar crusher gradients to eliminate the signal from large arteries by dephasing the moving spins. These crusher gradients have more significant implications with stroke or slow-flow imaging; however, when quantification of CBF in tumors is considered, a consistent technique should be employed to decrease variability when tracking blood flow in tumors over time, especially in regard to tumor response.
Readout Strategies
A two-dimensional (2D) echoplanar imaging (EPI) readout is commonly used in ASL imaging due to high SNR and rapid acquisition time; however, EPI suffers from susceptibility artifact with the potential for signal loss and image distortion, especially when the lesion is near the skull base, orbit, or sinuses, or in the presence of blood products. Three-dimensional (3D) techniques with spin-echo (GRASE) or rapid acquisition with relaxation enhancement (RARE)-based readout strategies for ASL can be of particular benefit to improve the image quality for several reasons. They improve SNR secondary to slab excitation and a prolonged image acquisition window and are also associated with less image distortion and susceptibility artifact. Furthermore, 3D imaging is associated with more effective background suppression, 19 which can significantly increase the measured signal. 20 3D techniques such as GRACE or RARE-based readout strategies are also less affected by susceptibility artifacts. 21 , 22 , 23
Absolute versus Relative Cerebral Blood Flow
The absolute CBF value could be theoretically determined by using ASL 24 , 25 ; however, there are several factors that can potentially affect quantitative CBF measurement. These include dependence on transit time of the labeled blood, the local relaxation times of tissue and blood, and the assumption of a constant T1 relaxation time of arterial blood regardless of variable factors, such as vessel size or level of oxygenation. 26 In addition there are large interindividual differences in perfusion 27 that can affect estimation of CBF. The accuracy of absolute perfusion measurement by using Q2TIPS has not been fully established, especially in pathological conditions 28 , 29 ; therefore most of the authors used relative perfusion index rather than the absolute blood flow value. In most of the studies, the average signal intensity of gray matter was used as a reference for relative perfusion instead of white matter. This is mainly because the arterial transit time of white matter is much longer than that of gray matter, resulting in a substantial underestimation of the blood flow in white matter. 30 , 31
Comparison of ASL to Contrast-Based MR Perfusion Methods
Numerous studies demonstrated positive correlation of relative cerebral blood volume (rCBV) measured by DSC-MRI with histological measurements of tumor neovascularization. 32 , 33 , 34 Compared to MR perfusion methods based on contrast injection (DSC and DCE), ASL is capable of measuring absolute CBF values. Other advantages of ASL include noninvasiveness, repeatability, utility in patients with renal failure who are at risk of related nephrogenic systemic fibrosis, and utility in young children in whom the rapid bolus injection of contrast materials into the vein may be problematic. Despite these advantages, ASL suffers from lower SNR and requires multiple signal acquisitions, which increase the imaging time.
Numerous studies have compared ASL and DSC perfusion in various aspects of brain tumor imaging. Weber et al evaluated normal brain tissue in 62 patients with brain metastases who were treated with stereotactic radiosurgery using PASL and DSC perfusion and demonstrated good correlation between perfusion values, which remained unchanged after stereotactic radiosurgery. 35 A study by Lehmann et al 36 that evaluated 27 patients included 9 gliomas, 10 metastases, and 8 meningiomas. They used PASL and DSC T2* perfusion sequence and found a significant correlation between rCBF calculated from the two perfusion sequences. Warmuth et al showed a high correlation for rCBF measurements on ASL and DSC perfusion maps using 1.5 T using single TI PASL. 26 Lüdemann et al 37 used different perfusion techniques (DCE-MRI/DSC-MRI, PASL, and H2 15O positron-emission tomography) in 12 patients with brain tumors, and demonstrated a linear relationship between all five imaging modalities regarding the perfusion signal of normal brain tissue and tumor; however, the perfusion ratios between tumor and brain differed significantly with the method applied. This suggested that relative tumor perfusion values determined with different techniques cannot be directly compared. 37 Hirai et al compared ASL MRI using QUASAR and DSC-MRI on 3 T scanners 38 in 24 patients with histologically proved glioma. They demonstrated good to excellent intermodality agreement for maximum rCBF between ASL and DSC.
Very few studies have been performed to compare ASL with DCE-MRI. Roy et al evaluated 64 patients with glioma using 3D-PCASL and DCE-MRI and demonstrated a weak correlation in rCBF values between the two methods. They also did not find a significant difference in absolute or relative CBF values between high- and low-grade gliomas using ASL, whereas DCE indices were significantly higher in high-grade gliomas. 39
Van Westen et al 40 used the QUASAR method at 3 T to measure aBV in 11 brain tumors (grade III gliomas, glioblastomas, and meningiomas), and compared measurement of aBV from arterial spin labeling with CBV from DSC-MRI. They demonstrated a positive correlation between ASL-based aBV tumor-to-gray matter(GM) ratios and DSC-MRI-based CBV tumor-to-GM ratios.
Diagnostic Impact
A few studies have evaluated the diagnostic impact of adding ASL imaging in patients with brain tumors. Geer et al 41 evaluated 59 patients with glial tumors and demonstrated that the addition of perfusion to the standard imaging protocol was associated with a change in management plan in 8.5% of patients and an increase in the treatment team’s confidence in their management plan in 57.6% of patients. Kim et al in a prospective study evaluated the added value of pulsed ASL and apparent diffusion coefficients in the grading of gliomas. In this study, two observers made the correct diagnosis in 23 of 33 (70%) lesions in the first review and in 29 of 33 (88%) of lesions in the second review. 42
Quantitative vs. Qualitative Techniques of ASL Image Interpretation in Brain Tumors
Although quantitative analysis of ASL imaging is more valuable and gives investigators the potential to compare perfusion values between patients and during the course of the disease, quantitative analysis is more practical in the research setting with a limited number of patients. On the other hand qualitative methods are very fast and more applicable in routine clinical practice. In a prospective study, Järnum et al used PCASL and DSC perfusion to evaluate 28 patients with contrast-enhancing brain tumors at 3 T with whole-brain coverage. 43 They used a qualitative scoring system to evaluate signal enhancement and susceptibility artifact in the tumor. They also performed a quantitative analysis with normalized tumor blood flow (TBF) values. Results of this study showed no difference in total visual score for signal enhancement between PCASL and DSC relative to CBF, and a good correlation between normalized CBF between both perfusion methods. Not surprisingly, ASL had a lower susceptibility-artifact score than DSC-MRI. Studies using ASL imaging in distinguishing predominantly recurrent high-grade glioma from radiation necrosis also demonstrated that both qualitative (based on visual inspection) and quantitative techniques were effective in differentiation of radiation necrosis from tumor recurrence. 44 Kim and Kim also did not find a significant difference between the quantitative and qualitative ASL parameters in glioma grading. 42
6.3 ASL Clinical Diagnostic Applications
6.3.1 Extra-axial Tumors
One advantage of ASL over contrast-enhanced methods is reliability on a theoretically freely diffusible tracer, which makes it less sensitive to abnormal blood–brain barrier (BBB) permeability. 45 This can be particularly helpful in the setting of extra-axial lesions. Due to lack of BBB permeability in extra-axial masses, gadolinium can potentially cause T1 shortening and mask the T2* effect with resultant underestimation of rCBV. Despite less susceptibility to abnormal permeability compared to DSC, however, ASL quantification methods are also based on an intact BBB, 46 and a leaky BBB may also potentially affect ASL, causing overestimation of CBF. In order to evaluate this, Wolf et al 47 used a simulation two-compartment single-pass approximation (SPA) model accounting for T1/T2 effects, blood volume, and permeability suggested by St Lawrence and Wang, 48 to simulate the change in CASL signal at 3 T and demonstrated that an increase in permeability reduces the CASL signal by 2%, even if permeability is tripled. In another study, Parkes and Tofts showed that there should be a 100% change in permeability per capillary volume to achieve a 5% change in ASL signal. 49 Another relevant feature of extra-axial brain tumors is their potential to have dual arterial supply from external and internal carotid arteries. Sasao et al demonstrated that ASL can provide important information about the vascular supply of meningiomas by selective labeling of the external carotid artery. 50 In addition to PASL, based on magnetic resonance angiography (MRA) anatomy analysis, the external carotid artery was selectively labeled followed by a regional perfusion imaging (RPI) sequence in eight patients with meningiomas. In this study, a meningioma that was mainly supplied by the internal carotid and ophthalmic arteries showed entirely different perfusion maps on PASL and RPI images. Results of this study suggested that selective labeling of the external carotid artery can accurately predict the vascular supply in extra-axial brain tumors.
One of the advantages of contrast-based MR perfusion methods is the ability to measure permeability either with DCE T1-based methods 51 or first pass T2-DSC acquisition 52 in addition to perfusion. Because increased permeability can occur in tumoral vessels even before neovascularization, 53 it may provide important information in primary diagnosis 51 as well as following treatment efficiency with antiangiogenic drugs. 54 Measurement of permeability with ASL was not possible until recently when Wang et al combined CASL with a twice-refocused spin-echo diffusion sequence 55 and separated the signal contributions from capillaries and brain tissue. This ASL-based permeability has the potential to estimate water permeability of brain tumors.
6.3.2 Meningioma and Schwannoma
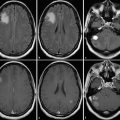
Kimura et al 56 used CASL and DSC perfusion for characterization of meningioma by MR perfusion imaging with histopathological correlation. They demonstrated a significant correlation between CASL-% signal intensity change and microvessel area determined by immunostaining specimens with anti-CD31. They also demonstrated a significant correlation between CASL-rCBF and T2DSC-rCBF. Noguchi et al 57 used PASL to evaluate 35 patients with brain tumors including gliomas, meningiomas, schwannomas, diffuse large B-cell lymphoma, hemangioblastomas, and metastatic brain tumor, and demonstrated that signal intensity was significantly higher in hemangioblastomas compared to meningiomas and schwannomas. They did not find a significant difference between signal intensity of meningioma and schwannomas. Anecdotally, meningiomas are one of the most homogeneously hyperperfused tumors encountered in clinical practice (Fig. 6.1).

6.3.3 Intra-Axial Tumors
Gliomas
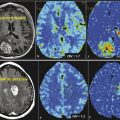
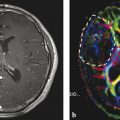
Neovascularization is one of the hallmarks of malignancy along with mitosis, pleomorphism, and necrosis. 58 A direct correlation between glioma grade and angiogenesis has been well established. 59 , 60 DSC perfusion has been proved to increase the sensitivity in determining glioma grade, compared with conventional MRI. 61 In addition, DSC perfusion has been shown to be a better predictor of tumor progression and patient outcome compared with initial histopathological interpretation. 62 ASL was first used in 1996 to evaluate perfusion in a heterogeneous group of brain tumors, and demonstrated elevated perfusion in high-grade astrocytomas with marked regional heterogeneity compared with low perfusion in low-grade astrocytomas and lymphomas. 63 More recently Wolf et al using CASL at 3 T demonstrated that maximum CBF normalized to the global mean CBF in the brain provided the best distinction between high- and low-grade gliomas (Fig. 6.2). 47 They also showed that low-grade gliomas with oligodendroglial components demonstrated high CBF. This confounding effect of oligodendrogliomas in glioma grading has also been encountered in DSC perfusion imaging. 64 As a solution Chawla et al showed that ASL-guided voxelwise analysis of proton MR spectroscopy of regions of high blood flow may be helpful in distinguishing low-grade from high-grade oligodendrogliomas (Fig. 6.3). 65


Different thresholds have been proposed for glioma grading. Weber et al, 29 using a relative CBF of 1.4 for discrimination of glioblastomas from grade III gliomas, showed sensitivity was 97%, specificity was 50%, positive predictive value (PPV) was 84%, and negative predictive value (NPV) was 86%. In the same study, using an rCBF value of 1.6 for discrimination of glioblastomas from grade II gliomas, sensitivity was 94%, specificity was 78%, PPV was 94%, and NPV was 78%. In Warmuth et al’s study, the mean rCBF values in high- and low-grade gliomas were 1.54 and 0.64, respectively. 26
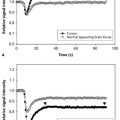
Typically, based on T1 decay of blood, ASL measurements are acquired at an inversion time, which is approximately 1,200 ms at 1.5 T and 1,600 ms at 3 T. 66 , 67 In a study of healthy volunteers MacIntosh et al 68 showed that the mean arterial transit time is approximately 641 to 935 ms, depending on the brain region. Furtner et al used PASL at eight different inversion times from 370 ms to 2,114 ms in order to find the largest difference in normalized intratumoral signal intensity between high-grade and low-grade astrocytomas, and demonstrated that inversion time of 370 ms best differentiated high-grade and low-grade astrocytomas. They suggested that, at this short inversion time, the labeled spins are located primarily within the vessel and mainly reflect the labeled intra-arterial blood bolus, and they called it normalized vascular intratumoral signal intensity (nVITS). 69
Related posts:
 7 Perfusion Imaging: Perfusion CT
 3 Going Beyond the Conventional Morphological Imaging: An Overview of Functional Imaging Techniques
 1 Conventional Morphological Imaging: MRI Remains the Workhorse
 15 Image-Guided Neurosurgery: Intraoperative MRI
 18 On the Horizon: Going Beyond Conventional MR Contrast Agents
 13 It’s Not Just the Tumor: Treatment Effects
Stay updated, free articles. Join our Telegram channel

Full access? Get Clinical Tree


