7 Perfusion Imaging: Perfusion CT
7.1 Introduction
Perfusion computed tomography (PCT) is a well established modality for acute stroke assessment1,2 and has been used sporadically for assessing postsubarachnoid hemorrhage vasospasm,3 as well as for the evaluation of cerebrovascular reserve in patients with major vessel steno-occlusive disease.4 Traditionally, perfusion imaging of brain tumors has been performed with magnetic resonance imaging (MRI) with the goal of estimating tumor vascular parameters.5,6,7 However, given its ease of availability, faster scan times, and low cost when compared with magnetic resonance (MR) perfusion, PCT also may be well suited for brain tumor evaluation8,9—potentially offering a robust tool for the quantitative estimation of tumor vascular parameters and opening the door for their potential use as imaging biomarkers.
In recent years, PCT has been used for glioma grading,6,7 for differentiating recurrent or progressive tumor from treatment-induced effects (e.g., radiation necrosis),10 as well as in differentiating nonneoplastic tumefactive lesions from neoplasms.11 One of the advantages of PCT is the linear relationship between tissue attenuation and concentration of contrast agent, in contradistinction to MR perfusion techniques. This, in turn, leads to a less biased estimation of tumor vascular parameters when compared with MR perfusion techniques. However, one of PCT’s biggest limitations, apart from radiation exposure concerns, is the need to obtain an entirely separate PCT examination, rather than simply obtaining additional MR perfusion sequences at the time of the routine contrast-enhanced MRI, which is the standard of care for the imaging evaluation of brain tumor patients. Yet, despite these limitations, PCT has potential as a very useful tool for brain tumor assessment, especially in those patients unable to undergo MRI due to a variety of contraindications.
7.2 Perfusion CT Tracer Kinetics and Vascular Parameters
Dynamic contrast-enhanced imaging attempts to observe the distribution of contrast agent within tissues over time. To be successful, the correct mathematical tracer kinetic model to the dynamic data set must be implemented in order to obtain an accurate estimate of contrast agent distribution between the intravascular and extravascular compartments. Each kinetic model makes a number of assumptions and, as such, may have limitations in particular experimental situations and also be dependent on tissue physiology.
A fundamental difference between the various kinetic models stems from the assumption of homogeneous (well-mixed) or distributed compartments. A homogeneous compartment assumes instantaneous mixing of tracer within the compartment such that tracer concentration is uniform throughout, whereas a distributed compartment attempts to account for spatial differences in tracer concentration within the compartment. The generalized kinetic and conventional compartmental12,13 models assume homogeneous compartments, whereas the adiabatic tissue homogeneity14,15,16,17 and distributed parameter18,19 models assume a distributed vascular compartment.19 The applicability of a particular model depends on the underlying tissue physiology (i.e., tracer transit, distribution, and exchange rates), as well as the imaging protocol and noise condition of the dynamic contrast-enhanced imaging data set.
Due to the complex tissue characteristics of brain tumors, and also the fact that temporal resolution of image sampling is on the order of 1 second when using multislice fast CT scanners, compartment models are best suited for assessing dynamic data when evaluating brain tumors with PCT. The two-compartment model, based on the adiabatic approximation of the John and Wilson model,15 has been used in the past at our institution with good success.8,9,10,11,20,21,22 These compartment models can simultaneously measure four independent vascular parameters: two rate parameters (blood flow and permeability surface area-product [PS]) and two volume parameters (blood volume and volume of extravascular extracellular space [ve]). Mean transit time (MTT) can be derived based on the central volume principle; blood volume = blood flow × MTT.23
Permeability is related to the diffusion coefficient of contrast agent in the assumed water-filled pores of the capillary endothelium. The diffusion flux of contrast agent across the capillary endothelium is dependent on both the diffusion coefficient and the total surface area of the pores. PS characterizes the diffusion of some of the contrast agent from the blood vessels into the interstitial space due to deficient or leaky blood–brain barrier (BBB) and is used as a means of quantifying the “leakiness” of the regional vasculature. PS is computed from the impulse residue function (IRF). Contrast agent diffusion appears in the IRF as a residual enhancement that occurs after the initial impulse response and that decreases exponentially with time. The IRF is used to estimate the first-pass fraction of contrast agent that remains in the tissue, the extraction fraction (E).15 The extraction fraction is related to the rate at which contrast leaks out of the vasculature via the following relationship:
where PS is the permeability surface-area product and F is flow. The PS product has the same dimensions as flow (mL/100 g/min), and thus the ratio
is dimensionless. In physiological terms, PS is the rate at which contrast agent flows into the extravascular tissues; it is related to another commonly stated parameter of vascular leakage, the forward transfer constant (Ktrans) by the following: Ktrans = E×F, where Ktrans is the forward transfer constant with, again, the same dimensions as flow (units commonly employed min−1). It is easily demonstrated that, if
<< 1 (or F >> PS) then Ktrans ≈ PS. In normal cerebral vasculature, PS is negligible for all contrast agents presently in clinical use.
7.3 Perfusion CT Protocol
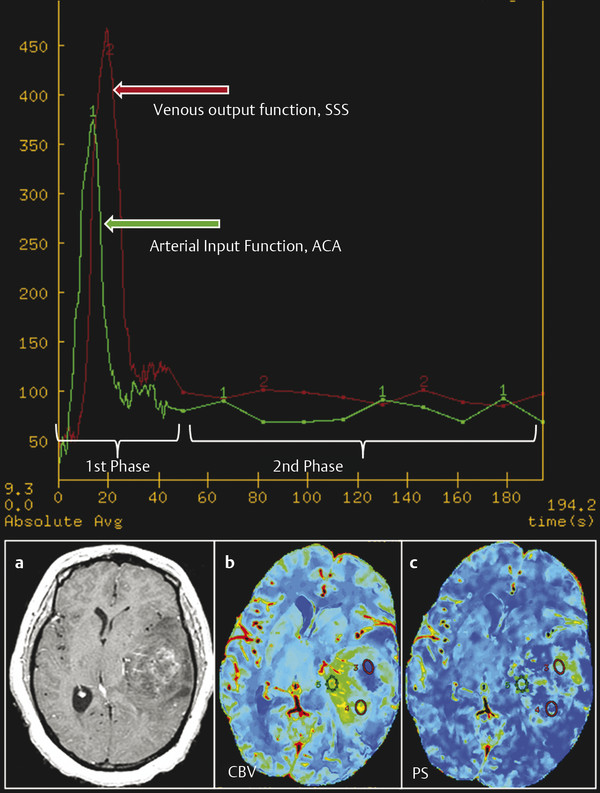
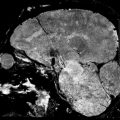
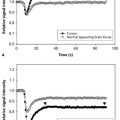
Perfusion studies can be performed using multidetector row CT (MDCT) scanners. Currently available 16-slice CT scanners can cover 2 cm of the brain, which is increased to 4 cm using a 64-slice CT scanner. Prior to obtaining the perfusion scan, a low radiation dose noncontrast CT head study is usually performed to localize the tumor region. For the perfusion scan, 50 mL of nonionic contrast is injected at a rate of 4 to 5 mL/s through an intravenous (IV) line using an automatic power injector. The brain tumor PCT protocol at our institution includes two phases: (1) First pass or vascular phase—cine (continuous) scan initiated 5 seconds into the injection with the following technique: 80 kVp, 100 to 120 mA, 1 second per rotation for a duration of 50 seconds, matrix size 512 × 512, and 24 cm field of view; and (2) delayed or parenchyma back flux phase—following the initial 50-second vascular phase, eight additional axial images are acquired, one image every 15 seconds for an additional 2 minutes, giving a total acquisition time of 170 seconds to assess for delayed permeability.9 With the use of the 16-slice CT scanner, four 5-mm thick axial slices are acquired for a total coverage of 2 cm, whereas with the 64-slice CT scanner, eight 5-mm thick axial slices are acquired, resulting in a total coverage area of 4 cm. Perfusion maps of vascular parameters can then be obtained using many of the commercially available software packages. Our institution uses an Advantage Windows workstation and CT perfusion software (General Electric Medical Systems, Milwaukee, WI), which uses a two-compartment model based on the adiabatic approximation of the John and Wilson model15 to generate cerebral blood volume (CBV), cerebral blood flow (CBF), MTT, and PS parametric maps. The superior sagittal sinus is generally used as the venous output function, and the artery with the greatest peak and slope on time-attenuation curves is used as the arterial input function (AIF) (Fig. 7.1). In selecting the AIF, a region of interest (ROI) is drawn within the confines of a large vessel, and the automatic function of the software selects the pixels with the greatest peak and slope on the time-attenuation curve for analysis.
7.4 Perfusion CT: Technical Considerations
Permeability estimates can be affected by a number of factors that must be taken into consideration when performing PCT. One such technical factor—which affects permeability estimates regardless of the perfusion imaging technique—is the scanning or acquisition time. Although no definite consensus exists regarding optimal acquisition time, it is understood that delayed permeability caused by slow leakage of contrast from leaky blood vessels may be inaccurately measured with the first pass of the contrast agent using a 45 or 60 s scanning time24,25,26 and can be accurately measured only with longer acquisition times. Our institution uses an extended acquisition time of 170 s for brain tumor patients (Fig. 7.1), and a recent publication supports this use of longer scanning times as a means of reducing random errors.27 A second factor that can influence permeability estimates relates to the nature of the tumors themselves, particularly high-grade gliomas, which can have extremely variable and heterogeneous blood flow due to the complex tumor vasculature.28,29,30 Other factors also influencing permeability include blood vessel luminal surface area, as well as interstitial, hydrostatic, and osmotic pressure gradients across the endothelium. For example, slow blood flow or low osmotic gradients, which can occur in high-grade tumors with a lot of vasogenic edema, as well as in the central parts of large tumors, can lead to a larger component of delayed permeability, requiring longer acquisition times.
Selection of an accurate AIF is also an important aspect of the postprocessing of dynamic data sets. Although AIF selection is relatively easier with PCT, yet to be discussed here, it still requires particular attention as absolute values of vascular parameters may be affected by the choice of AIF. Although there is literature in acute stroke patients in which laterality of AIF did not affect the measurements,31,32 as with acquisition time, there is no consensus in brain tumor patients. It should be noted though that this pitfall is less severe with deconvolution-based software programs using a delay insensitive technique than with those using a standard deconvolution method.32
7.5 Comparison with MR Perfusion Techniques for Brain Tumor Assessment
7.5.1 Limitations of PCT
MRI-based perfusion techniques have been at the forefront of brain tumor assessment due to the role of contrast-enhanced MRI as the standard of care in evaluation of brain tumor patients. Therefore, obtaining an additional perfusion sequence, whether using dynamic contrast-enhanced T1-weighted imaging (DCE-T1 MRI) or dynamic susceptibility contrast-enhanced T2- or T2*-weighted imaging (DSC), with bolus injection of contrast agent is relatively easy. On the contrary, PCT requires a separate and additional examination with an additional iodinated contrast agent injection. Hence, using PCT as a routine diagnostic tool or as a routine follow-up tool in patients treated with various combinations of therapy is impractical. However, PCT may still be useful if MRI is contraindicated, whether due to MRI compatibility issues, patient choice, or the limitations of MR perfusion techniques described later in the chapter.
Another major concern with PCT, as compared to MR perfusion techniques, is radiation exposure. However, low radiation dose protocols, which can be obtained using 100 to 120 mA (as presently done at our center) as compared to 200 mA, have reduced the mean effective dose of PCT to 3 to 4 mSv, offering nearly a 50 to 60% reduction in radiation dose (our unpublished data) without affecting the image quality of perfusion parametric maps. In addition, some of the advanced image reconstruction techniques, such as adaptive statistical iterative reconstruction, can further reduce image noise and improve low contrast detection and image quality with up to 32 to 65% CT dose index reductions.30 Wider availability and implementation of these new techniques could further reduce the radiation dose for PCT studies, making them more attractive for routine use.
An additional relative limitation of PCT in the past was limited coverage of the brain, particularly with the use of 16-slice CT scanners, which covered only 2 cm. However, the use of 64-slice CT scanners, which can cover up to 4 cm of brain, allows for coverage of most of the tumors in our clinical experience. In addition, brain coverage has been increased to include the whole brain with the use of 128-, 256-, or 320-slice CT scanners.
7.5.2 Advantages of PCT
Despite the aforementioned limitations, PCT has certain advantages over MR perfusion techniques. Two of the most important advantages, the linear relationship between tissue attenuation and concentration of contrast agent and the ease of obtaining a robust AIF, both have led to less biased estimation of tumor vascular parameters compared to MR perfusion techniques. Regarding the relationship between tissue attenuation and concentration, contrast agent bolus-based MR perfusion techniques have a nonlinear relationship of the signal intensity with the contrast agent concentration whether using DCE-T1 MRI or DSC imaging, which are the two most commonly employed techniques. In the latter case, when the contrast agent remains intravascular, the method is widely accepted as a relative estimate of CBF and CBV, although there is a possibility of artifacts due to difficulties in assessing the shape and timing of the arterial input function.28 In the event that substantial leakage of a contrast agent from intra- to extravascular space takes place, which is a common occurrence in brain tumors (especially high-grade tumors), a strong and competing T1 contrast effect is often noticed in the areas of pathology because of the short (~ 1 s) repetition times needed to estimate CBF. As a first-order tactic to minimize the competing T1 contrast, preloading with contrast agent has been proposed with some success.29 However, this approach does not allow an estimate of Ktrans. An alternative has also been proposed,33 which aimed to decrease the T1 effect by using a slower repetition time, lengthening the acquisition time of the experiment, and undermining the estimation of CBF, thus yielding estimates of only CBV and Ktrans. A further refinement, allowing the estimate of blood volume and producing an index of transfer constant, has been suggested,29 and a dual-echo gradient echo sequence25 also shows potential for an index of blood volume and transfer constant. Despite the partial success of these rapid imaging studies, in contrast to PCT, there does not appear to be an MRI technique that will reliably quantify CBF, CBV, and Ktrans in one single experiment.
Selection of an appropriate AIF is also difficult with MR-based techniques due to susceptibility and flow artifacts, whereas it is very robust with PCT. With the advent of faster helical CT scanners, temporal sampling of image acquisition could be on the order of 1 s or less (which may not be possible even with the latest MR scanners), and could be an important consideration for both pharmacokinetic modeling (distributed compartment models), as well as for obtaining a robust AIF.
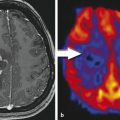
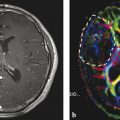
Another disadvantage of MR perfusion, particularly with DSC MR perfusion, is the presence of susceptibility artifacts related to hemorrhage and various mineral depositions, which can be a major issue in brain tumor patients following surgery and chemoradiation therapy combination regimens. Brain tumors along the skull base also could be difficult to assess with DSC imaging due to susceptibility artifacts (Fig. 7.2), though susceptibility is not an issue with DCE-T1 MRI. On the other hand, PCT could be very useful in these scenarios. DCE-T1 MRI also has its own drawbacks, such as those associated with the need to calculate baseline T1 values as well as magnetic field inhomogeneity issues, making it much more technically challenging than PCT.

Related posts:
 6 Perfusion Imaging: Arterial Spin Labeling
 3 Going Beyond the Conventional Morphological Imaging: An Overview of Functional Imaging Techniques
 1 Conventional Morphological Imaging: MRI Remains the Workhorse
 15 Image-Guided Neurosurgery: Intraoperative MRI
 18 On the Horizon: Going Beyond Conventional MR Contrast Agents
 13 It’s Not Just the Tumor: Treatment Effects
Stay updated, free articles. Join our Telegram channel

Full access? Get Clinical Tree


