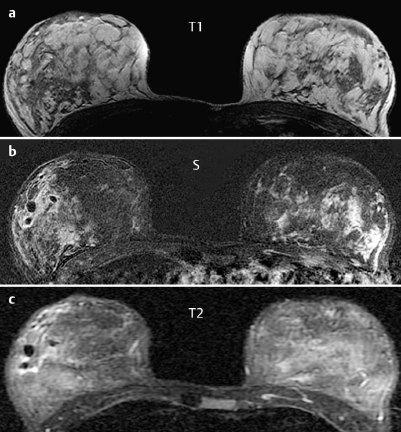
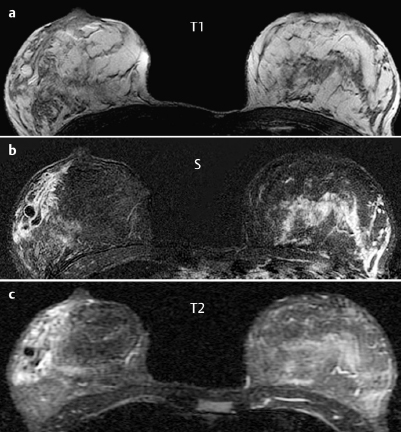

| Signal of the intraductal “lesions” |
T1-weighted imaging | hyperintense |
T2-weighted imaging | hypointense |
Enhancement (intraductal) | none |
Enhancement (duct wall) | strong |
 Differential Diagnostic Considerations
Intraductal blood pooling (Tl signal↑, T2 signal ↓)? Intraductal milk retention?
Stenosing milk duct near the nipple? Focal inflammation?
A malignant tumor can be excluded (no enhancement of the intraductal structures, T2 signal ↓).
Clinical Findings | right 4 | left 1 |
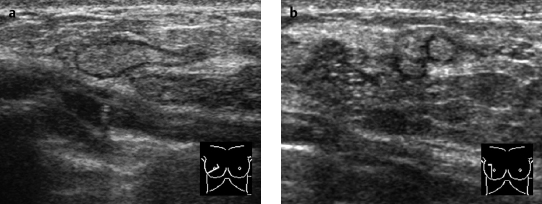
Ultrasound | right 3 | left 1 |
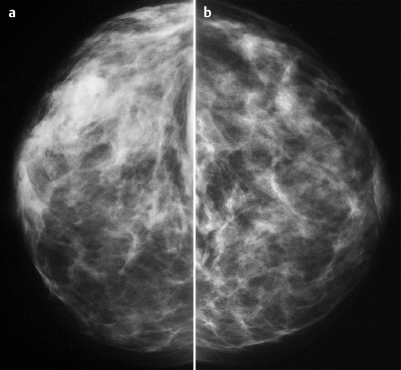
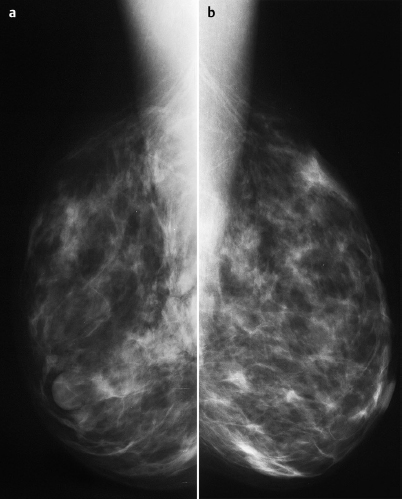
Mammography | right 3 | left 1 |
MR Mammography | right 3 | left 1 |
BI-RADS Total | right 3 | left 1 |
Procedure
US-guided fine-needle aspiration cytology to identify the intraductal process in the lower outer quadrant of the right breast.
Cytology of the right breast
Eosinophilic protein-rich precipitate incorporating copious fat. Also, signs of a focal granulomatous inflammation.
Further procedure
At the express wish of the young patient, a wait-and-see approach was followed and follow-up sonography was performed at intervals of 2, 6, and 12 weeks. The patient declined repeat mammography to obtain better-quality images of the right breast. Finding after 20 weeks: Complete resorption of the intraductal fluid.
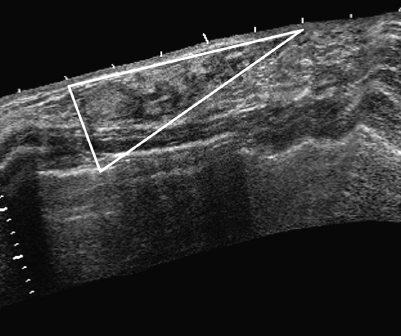
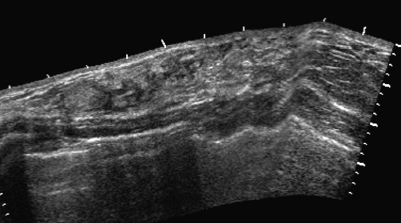
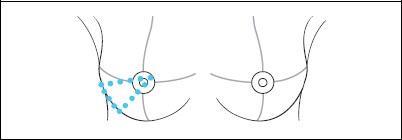
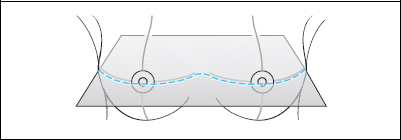
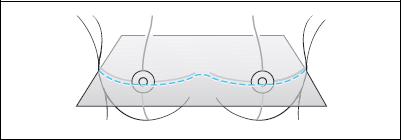
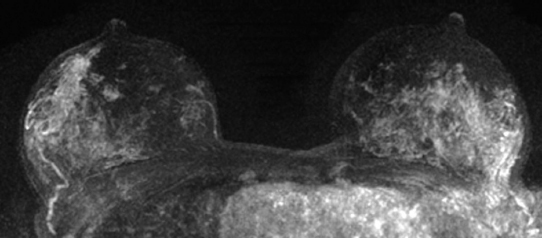
Fig. 36.8 Segmental distribution of the changes in panoramic view.
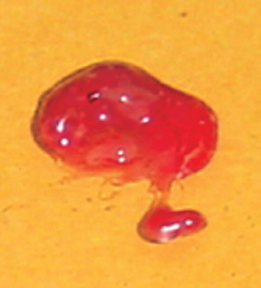
Fig. 36.9 Viscous fluid in aspirated specimen from the right breast.
Diagnosis (without histopathological verification)
Segmental inflammation of a milk duct with intraductal fluid retention.
Stay updated, free articles. Join our Telegram channel

Full access? Get Clinical Tree


