4 Ischemia
Introduction
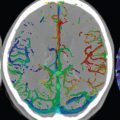
In younger patients, the etiologies for cerebral infarction are many and varied, in distinction to older adults ( Fig. 4.1 ). Leading causes include cardiac and hematologic disease, infection, vasculitis, trauma, and illicit drug use. In the elderly, infarcts are most often due to atherosclerosis, with vessel occlusion due to either thrombosis or embolism. Common areas of atherosclerotic involvement include the carotid bifurcation, distal internal carotid artery, and middle cerebral artery. Risk factors for infarction in an adult include high blood pressure, high cholesterol, smoking, diabetes, obesity, cardiovascular disease, oral contraceptives, and cocaine. Clinical presentations include acute neurologic deficit, speech disorder (aphasia), change in mental status, headache, and seizure.

Infarction involving the precentral gyrus (primary motor cortex) leads to contralateral motor deficits. Infarction in the left inferior frontal gyrus (specifically in Broca’s area, the part of the brain responsible for speech production) causes an expressive aphasia. Infarction in the left posterior superior temporal gyrus (specifically in Wernicke’s area) causes receptive aphasia. The latter two statements apply for patients who are left hemisphere dominant.
Acute Cerebral Ischemia
Imaging, whether by CT or MR, is today an essential part of stroke detection and decision making. There is great variability from institution to institution in regard to imaging protocols, in part dependent upon the available imaging technology. However, the time since symptom onset is very important in terms of the imaging approach. In the emergent setting at tertiary care centers, both CT and MR are readily available, with performance of at least one of these scans being a requisite prior to neurointervention.
In acute stroke triage, there are several questions that need to be answered rapidly and accurately by imaging. Does the scan identify a stroke, or is the clinical diagnosis possibly not correct? Is intracranial hemorrhage present? Is there occlusion of a major cerebral vessel? Is there a clinically relevant ischemic penumbra that is potentially salvageable? The latter also requires identification of irreversibly injured brain.
Stroke is a generic term signifying a neurologic event. Cerebral ischemia and cerebral infarction refer to the tissue status and can be assessed by CT and MR. Brain tissue remains potentially viable in cerebral ischemia, although blood flow is inadequate. In cerebral infarction, there is actual cell death. Time is critical in patient triage. The terms hyperacute and acute stroke are commonly used, although their definition varies from site to site. In general, hyperacute refers to presentation within 6 hours following symptom onset. Use of the term acute is much more variable, although it is commonly employed for the patient who is within 6 to 48 hours from symptom onset.
There are three major etiologies for stroke:
The most common cause of acute ischemia is atherosclerosis, representing slightly less than half of all cases. Most large arterial infarcts are embolic, from thrombi originating at the site of an atherosclerotic plaque. The most common site for an embolus to lodge is just subsequent to the internal carotid artery terminus, in the middle cerebral artery, with occlusion of the vessel or a branch therein.
Small vessel disease accounts for a quarter of all strokes. Occlusion of small arteries generally results in lacunar infarcts, which are small, less than 2 cm in diameter. Many lacunar infarcts are clinically silent. Those located in strategic areas cause significant neurologic impairment. Most lacunar infarcts involve penetrating arteries, commonly in the basal ganglia (caudate nucleus, putamen, and globus pallidus), thalami, internal capsule, pons, and deep cerebral white matter.
Cardioembolic disease causes slightly less than one-quarter of all major strokes. Risk factors include myocardial infarction, arrhythmia (often atrial fibrillation), and valvular disease.
By location, the MCA is the most common site of large artery thromboembolic infarction, followed by the PCA, and then the vertebrobasilar circulation. The ACA territory is least commonly involved. Acute infarcts can be solitary or multiple. They vary in size from very small lacunar infarcts to large territorial lesions. When a large vessel is occluded by clot, involvement of peripheral secondary branches is common, with or without distal emboli. Ischemia is multifactorial, with hypertension, diabetes, smoking, obesity, and high serum triglycerides the known major risk factors.
In the center of an area of ischemia (the core), cerebral blood flow (CBF) falls precipitously. Oxygen is rapidly depleted and the cells die, with irreversible loss of function. In about half of patients, an ischemic penumbra surrounds this core. Here, CBF is substantially reduced, falling from a normal of 60 cm3/100 g/min to 10 to 20 cm3/100 g/min. Tissue in this region is at risk, but potentially salvageable. There is a hierarchy among cell types in the brain in terms of sensitivity to ischemic damage, with neurons most vulnerable. Neurons in certain areas of the brain are also more vulnerable to ischemia than those in other regions.
In the first 6 hours or so, gross changes (pathologically) involving the brain are minimal. This is reflected on MR by the lack of vasogenic edema (which is best seen by T2weighted scans, and specifically FLAIR), without a bulk change in water. Cell swelling does, however, occur almost immediately, specifically cytotoxic edema, resulting in diffusion weighted imaging (DWI) being positive within minutes after the onset of ischemia. Gray-white matter boundaries become less distinct early on gross pathology, a finding that is also reflected by MR on T1- and T2weighted sequences. With time, the gyri expand, compressing the adjacent sulci and effacing the adjacent CSF spaces.
Most infarcts occur in older adults. Children who present with an infarct typically have an underlying disease, for example sickle cell disease or a right-to-left cardiac shunt. Common causes in young adults include dissection and drug abuse. Clinical presentation includes sudden onset of a focal neurologic deficit and decreased consciousness. Prognosis depends on which vessel is occluded, collateral blood flow, and whether there is a significant ischemic penumbra.
Time is of the essence for successful treatment of acute stroke. Treatment options continue to evolve, together with inclusion and exclusion criteria. Critical considerations for successful intervention include time from symptom onset and the imaging findings on the screening exam. CT is most often employed, as opposed to MR, due to the need for the exam to be completed rapidly. Treatment using intravenous (IV) recombinant tissue plasminogen activator (rtPA) is usually reserved for lesions less than 3 hours in age, and intraarterial thrombolysis is used for those less than 6 hours.
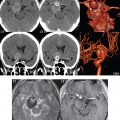
IV thrombolysis with rtPA (alteplase) unequivocally results in more patients with a favorable neurologic outcome ( Fig. 4.2 ), although there is an increase in early fatal cerebral hemorrhages. Clinical trials have shown that hemorrhagic risk is clearly increased by administration of a thrombolytic agent, specifically alteplase. The spectrum seen ranges from frequent benign petechial hemorrhages to rare large hematomas ( Fig. 4.3 ).


However, only the large parenchymal hematomas with mass effect are independently associated with clinical deterioration ( Fig. 4.4 ). Time is critical regardless, with results best when given within 3 hours for IV thrombolysis ( Fig. 4.5 ). Generally accepted imaging criteria for intraarterial thrombolysis include a significant perfusion- diffusion mismatch (ischemic penumbra), involvement of less than onethird of the MCA territory, and the absence of parenchymal hemorrhage.


Endovascular mechanical thrombectomy is now also widely used, either as an alternative or with thrombolysis ( Fig. 4.6 ). Certain patients, however, are not good candidates for thrombectomy (or other neuro- intervention, such as stent placement) ( Fig. 4.7 ), in particular patients with very large infarcts. Infarct and penumbra size are critical for patient selection and correlate with functional outcome.


The following imaging approach is typically performed emergently in a patient presenting clinically with a stroke. A nonenhanced CT (NECT) is first performed. This is used to exclude parenchymal hemorrhage as well as other disease processes that may clinically mimic a stroke. A second critical issue is to determine whether a major cerebral vessel is occluded, with CT angiography (CTA) thus performed (typically from the aortic arch to the vertex). The third and final critical issue is to determine what part of the brain is irreversibly damaged and whether there is a clinically relevant ischemic penumbra. This is typically accomplished using perfusion CT (which requires a separate smaller dose of iodinated contrast, given at a high flow rate), although MR can also be employed. It should be noted that current generation CT scanners easily obtain perfusion maps of the entire brain, with the exam not limited to a small anatomic region (slab) as in the past.
Although acute ischemic strokes are often not detectable on initial NECT, careful image inspection is mandated. A dense MCA sign (due to acute thrombosis) is seen in about onethird of cases of M1 occlusion. The gray-white matter interface may be indistinct in the area of infarction. Relatively common findings, assuming that the relevant portion of the brain is involved, include loss of visualization of the insular cortex/ribbon and decreased density (with loss of definition) of the basal ganglia. In very large infarcts, there may be wedgeshaped, subtle parenchymal hypodensity together with subtle cortical sulcal effacement.
CTA quickly answers the question of whether a major vessel occlusion is present. Perfusion CT (pCT) depicts the effect of the vessel occlusion on the brain parenchyma. Three parameter maps are classically calculated from pCT: cerebral blood volume (CBV), cerebral blood flow (CBF), and mean transit time (MTT). CBV is defined as the volume of blood present at a given moment within the brain (or a region therein). CBF is defined as the volume of blood flow to the brain in a given period of time. MTT is defined as the time necessary for blood to transit through a given brain volume. They are related mathematically by the following equation: CBF = CBV/MTT. On both CT and MR, these parameters are commonly depicted visually using a color scale, with numerical values also readily accessible. In normal brain, CBV and CBF are higher in gray matter as compared to white matter. Ischemic brain displays a slower transit time. The ischemic penumbra is the area of brain with moderately decreased CBF, but near-normal CBV, that surrounds the infarct core, the latter demonstrating markedly reduced CBF and CBV. Both the core and the ischemic penumbra demonstrate prolonged MTT. A caveat, however, is that extra- or intracranial stenosis can also cause decreased or delayed perfusion.
As described earlier, CT perfusion is performed to determine the mismatch between brain with markedly reduced CBF (< 12 cm3/100 g/min) in the irreversibly infarcted core and potentially salvageable brain tissue in areas where CBF is reduced (12-22 cm3/100 g/min, with normal being ≈ 50) or MTT prolonged, the ischemic penumbra. Treatment options in the acute time period are in part dictated by the presence and extent of an ischemic penumbra (tissue at risk). CT perfusion also adds greatly to the detectability of early infarcts, with even small cortical lesions able to be diagnosed in two-thirds of cases. Whole brain pCT performs worst in the detection of very small (< 15 mm) lacunar infarcts, revealing only about one-fifth of these lesions. Without perfusion studies, acute infarcts (even very large lesions) can be difficult to detect on CT.
As evident by MR, few strokes demonstrate high signal intensity on FLAIR (which detects vasogenic edema well) within the first 4 hours. However, cell swelling (cytotoxic edema) develops within minutes following ischemia, leading to decreased ADC values and thus high signal intensity on DWI. MR is, on this basis (as well as other advantages), markedly more sensitive than CT for detection of early brain infarcts, with these being detected by DWI. In cytotoxic edema, there is impaired function of the sodium-potassium pump, leading to a net flow of water into the cell. There is no change in overall water content of the tissue. With MR, several scan sequences are typically acquired and compared, in addition to evaluation by more quantitative measures, specifically MR brain perfusion, in order to detect areas of “mismatch” and thus potential suitability for thrombolysis. This includes a comparison of FLAIR and DWI (identifying the area for which FLAIR is positive and DWI negative), and assessment of the mismatch between the area of diffusion restriction and the perfusion abnormality. A very small number (well less than 5%) of strokes are said to be initially DWI negative. This finding, published in the literature, was seen primarily with small lacunar infarcts and those in the brainstem, and likely reflects at least in part suboptimal imaging technique. On postcontrast T1weighted exams, intravascular enhancement is occasionally seen in large acute territorial infarcts.
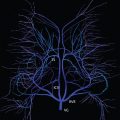
Digital subtraction angiography (DSA) may be subsequently obtained for either intraarterial thrombolysis or mechanical thrombectomy. Major vessel occlusions are easily identified as vessel cutoffs. Collateral flow from pial-leptomeningeal anastomoses can also be visualized.
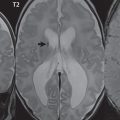
An important differential diagnosis in acute stroke triage, and indeed more generally for ischemia, is vasculitis. Imaging findings on DSA include vessel irregularities, stenoses, and occlusions in a pattern atypical for atherosclerosis. On MR, the most characteristic finding for vasculitis is that of multiple subcortical infarcts ( Fig. 4.8 ). There is considerable variation, from patient to patient, in size, location, and number of lesions. Multiplanar, high-resolution, thin section, postcontrast, T1weighted imaging depicts smooth, concentric arterial wall thickening and enhancement in the majority of patients with cerebral vasculitis. However, intracranial arterial wall thickening and enhancement are also seen following mechanical thrombectomy, potentially mimicking the appearance of vasculitis on MR.

Brain death is occasionally imaged on CT, with characteristic findings including global brain swelling and ischemia (with loss of gray-white matter differentiation), an important appearance to know and thus readily recognize prospectively.
Subacute Cerebral Infarcts
The subacute time frame is generally defined as that from 24 to 48 hours after initial clinical symptoms to 6 to 8 weeks. The subacute time period is sometimes subdivided into early subacute (first week) and late subacute (1 to 8 weeks in age) infarcts. This subdivision reflects in part that first week infarcts generally do not display blood-brain barrier disruption, whereas later subacute infarcts do, and thus, later infarcts typically display abnormal contrast enhancement on MR.
By 24 hours, vasogenic edema is present in 90% of brain infarcts, representing an overall increase in tissue water content. Vasogenic edema is seen with abnormal high signal intensity on T2weighted scans and corresponding low signal intensity on T1weighted scans, due to prolongation of both relaxation times. Vasogenic edema is seen as an area of low attenuation compared to normal adjacent brain on CT. Vasogenic edema persists for weeks. However, edema and mass effect typically peak in the middle of the first week, with necrosis and cavitation occurring subsequently.
Most thromboembolic strokes are initially nonhemorrhagic. Hemorrhagic transformation occurs in up to one-fourth of cases during the first week ( Fig. 4.9 ). Due to ischemia, there is damage to the blood-brain barrier. When perfusion is reestablished, exudation of red blood cells causes parenchymal hemorrhage. Petechial hemorrhage is more common than a parenchymal hematoma. Cortical and basal ganglia hemorrhage are most common. Predisposing factors include lysis of an embolus, opening of collaterals, restoration of normal blood pressure following hypotension, hypertension, and anticoagulation. Hemorrhage within an ischemic infarct is more commonly observed on MR than on CT, with MR more sensitive to blood products.

Large early subacute infarcts have prominent mass effect, with edema and mass effect subsiding by the late subacute time frame. Large infarcts (excluding lacunar infarcts) are commonly wedgeshaped, with involvement of both gray and white matter specifically in an arterial distribution. Blood-brain barrier disruption, as demonstrated by abnormal contrast enhancement, is common after 1 week and can be seen up to 6 to 8 weeks following stroke onset. However, blood-brain barrier disruption can be seen as early as 2 days after clinical presentation.
On NECT, early infarcts may be isodense to normal brain and difficult to visualize, or may demonstrate subtle hypodensity. By 24 to 48 hours after presentation, most infarcts will be well identified with moderate hypodensity on CT ( Fig. 4.10 ). Chronic infarcts appear as very hypodense, with a caveat being that an early subacute infarct can on occasion have this appearance. The presence or absence of local mass effect allows differentiation. After 1 to 2 weeks, in the late subacute time frame, infarcts commonly become isodense on CT (“fogging”). Abnormal parenchymal enhancement will usually be present at this time in the area of involvement, making confirmation of the infarct possible. Several weeks later, low density will again be seen in the area of the infarct, due to tissue cavitation.

On MR, subacute infarcts demonstrate abnormal low signal intensity on T1weighted scans, due to the presence of vasogenic edema. Mass effect is also well demonstrated on such scans. Hemorrhage, when present in the form of methemoglobin, is seen as abnormal hyperintensity. On T2weighted scans, vasogenic edema is seen as abnormal high signal intensity and is thus to some degree better depicted than on T1weighted scans. This is particularly true for FLAIR scans. Sequence parameters are adjusted in FLAIR in order to suppress the signal intensity of CSF, making the abnormal hyperintensity due to vasogenic edema and gliosis easier to identify. A return to normal signal intensity on FLAIR in the region of the infarct in the late subacute time frame can occur, decreasing conspicuity of an infarct. However, this phenomenon is very uncommon, in distinction to the “fogging” effect on CT, which in published series is seen in the majority of patients. From personal experience, such infarcts are readily identifiable on postcontrast MR due to blood-brain barrier disruption. On T2weighted scans (in particular those with T2* weighting, which includes GRE and SWI techniques), hemorrhage is commonly identified, with abnormal low signal intensity. The latter reflects the increased magnetic susceptibility of the blood component therein, with deoxyhemoglobin, intracellular methemoglobin, and hemosiderin all demonstrating this characteristic.
DWI plays only a limited role in subacute infarcts, in distinction to its critical role in the imaging of acute ischemia. Restricted diffusion, as reflected by hyperintensity on DWI and hypointensity on ADC maps, persists only up to 7 to 10 days. Once vasogenic edema is present, the abnormal hyperintensity on DWI has two contributions, that from restricted diffusion and that from the prolongation of T2. The former reflects cytotoxic edema and the latter vasogenic edema. After 10 days, subacute infarcts may still appear hyperintense on DWI. However, this is due to the phenomenon of “T2 shine through,” with the signal intensity reflecting changes only in T2. This can be confirmed by the evaluation of the ADC map, which will not demonstrate restricted diffusion. After 10 days, and for up to several months, the ADC is generally increased in an infarct. Regarding the visualization of hemorrhage, DWI is usually acquired with echo planar technique, which has good sensitivity to susceptibility effects. DWI thus depicts well the presence of deoxyhemoglobin, intracellular methemoglobin, and/or hemosiderin. The abnormal low signal intensity due to the presence of these blood products can be seen on the b = 1000 diffusion weighted image, but is often more evident on the b = 0 image on which CSF is high signal intensity (the b value is the strength of the applied diffusion gradient, with b = 1000 the standard for DWI of the brain, and acquisition of an additional b = 0 scan required for calculation of the ADC map). The b = 0 scan can serve as a substitute for a T2*-weighted GRE image, if the latter has not been obtained ( Fig. 4.3 ).
Time of flight MR angiography is often normal in the subacute time frame, even in large territorial infarcts. Vessel occlusion and/or stenoses can be seen but are not common findings on MR studies, other than those obtained very early following clinical presentation.
The patterns of abnormal contrast enhancement in brain infarcts on MR are well described in the literature. Intravascular enhancement reflects slow arterial flow and is the earliest type of abnormal enhancement seen. Intravascular enhancement can be seen on the first day and up to a week following presentation. A short segment of a single vessel or of multiple enhancing vessels may be seen. Meningeal enhancement, overlying the area of infarction, is the least common form of abnormal contrast enhancement and is seen from days 1 to 3. These two patterns of enhancement have been described for large MCA and PCA territory infarcts. As previously noted, parenchymal enhancement, which is due to blood-brain barrier disruption, is common during the first month ( Fig. 4.11 ).

As might be expected, there is considerable variation in the timing of parenchymal enhancement, which is usually not seen in the first few days and often not until 1 week. Parenchymal enhancement may persist for up to 8 weeks on MR following presentation. Enhancement of territorial and lacunar infarcts in the subacute time frame is the norm for MR, and for territorial infarcts is gyriform in appearance. In large territorial infarcts, the area of abnormal contrast enhancement is often less than the extent of the infarct, as defined by abnormal high signal intensity on FLAIR. Abnormal enhancement on MR permits differentiation of subacute from chronic infarcts, together with the identification of subacute infarcts in the midst of chronic white matter ischemic changes. Parenchymal enhancement can also be seen on CT, as previously noted, but is often less evident and is generally restricted to gyriform-like enhancement in territorial infarcts.
It is important to note one caveat in the differential diagnosis of subacute cerebral infarcts. If prior imaging is not available, a lowgrade astrocytoma can be mistaken for a territorial infarct, in particular if it occurs in the PCA distribution (occipital lobe). This confusion is much less common for lowgrade astrocytomas that occur in the MCA distribution. The reason for the difficulty in differentiation is that in the late subacute time frame there will be no diffusion restriction in an infarct and contrast enhancement may not be present. In addition, while the epicenter of a lowgrade astrocytoma should be white matter, it may also include gray matter. Mass effect in the late subacute time frame will also typically be mild, as might be expected with a lowgrade neoplasm. Close image inspection to determine involvement of the cortex and to confirm that the extent of the lesion truly represents a portion of an arterial territory can prevent misdiagnosis. If there is any doubt, a followup exam at 3 months will provide definitive differentiation.
Chronic Cerebral Infarcts
The term chronic is typically used for infarcts greater than 1 to 2 months in age. With large chronic infarcts, findings include focal atrophy (volume loss), with widened sulci and ex vacuo ventricular dilatation. Both cystic encephalomalacia and gliosis are typically present. The former (cystic encephalomalacia) has CSF signal intensity on all pulse sequences, with the latter (gliosis) having high signal intensity on FLAIR and often noted surrounding the area of cystic change ( Fig. 4.12 ). This distinction and the identification of gliosis are more difficult on CT. In territorial infarcts, the area of involvement will be wedgeshaped, involving both gray and white matter. Dystrophic calcification, sometimes gyriform in pattern, can be seen in chronic infarcts on CT but is uncommon. Smaller cortical infarcts will have less prominent findings on MR and are often difficult to see prospectively on CT, with focal cortical atrophy and gliosis characteristic features ( Fig. 4.13 ).


Wallerian degeneration, also known as anterograde degeneration, describes the degeneration that occurs involving axons distal to the site of injury. This is reflected by loss of tissue volume and, in some instances, by gliosis and thus abnormal high signal intensity on FLAIR ( Fig 4.14 , Parts 1 and 2). Wallerian degeneration is often seen in the corticospinal tract in patients with a large chronic infarct involving the motor cortex. Gliosis can be seen in continuity in the posterior limb of the internal capsule, the cerebral peduncle, the anterior pons, and extending into the medulla, where 80% of the fibers cross to the contralateral side.

The major differential diagnoses for a chronic infarct include a porencephalic cyst, posttraumatic encephalomalacia, and postsurgical changes. Identification of involvement of a vascular territory is critical in differential diagnosis.
Related posts:
Stay updated, free articles. Join our Telegram channel

Full access? Get Clinical Tree


