4 Perfusion Imaging: Dynamic Susceptibility Contrast Magnetic Resonance Perfusion
4.1 Introduction
Magnetic resonance imaging (MRI) is the imaging method of choice in the management of patients with cerebral tumors. In the diagnostic workup, including detection and differential diagnosis of central nervous system (CNS) tumors, MRI is essential because of its outstanding anatomical detail and tissue contrast. Characterization of a tumor’s malignant potential, however, can be more difficult using conventional techniques only, particularly because characteristics related to tumor vascularity as well as the integrity of the blood–brain barrier (BBB) of neoplastic tissue that are assessable by conventional imaging are only moderately specific indicators of tumor malignancy or malignant potential. Other characteristics can only be assessed using modern functional or physiological imaging techniques. The degree of angiogenesis, for example, has been linked to tumor grade in human gliomas, with high-grade lesions to show increased angiogenic markers and neovasculature.
This information can also be used for an improved treatment decision and planning, especially in respect to modulated treatment regimens.
After therapy, functional imaging techniques can be used for monitoring and to differentiate treatment-related from tumor-related changes; the later present with neoangiogenesis, whereas treatment-related effects present with a leakage of the BBB but no neovasculature.
Of the available functional imaging techniques described in the previous chapters, perfusion MRI is best suited to assess specific pathophysiological parameters related to the angiogenic characteristics in tumors. 1 , 2
In general, perfusion can be assessed with three different MRI techniques, namely dynamic susceptibility contrast (DSC), dynamic contrast-enhanced (DCE), and arterial spin labeling (ASL) magnetic resonance perfusion (MRP).
4.1.1 DSC-MRP
DSC-MRP is based on a dynamic acquisition in which the first pass of a bolus of gadolinium-based contrast agent through the area of interest is monitored by a series of heavily T2- or T2*-weighted MRI scans.
The signal aberration from the exogenous tracer leads to a temporal significant signal loss. Using the principles first described by Rempp et al in 1994 3 the signal information can be converted into a contrast medium–concentration time curve on a pixel by pixel basis.
Based on the indicator dilution theory, parametric maps of cerebral blood volume (CBV) and flow (CBF) can be derived from this concentration information. Regional CBF and CBV values can be obtained by region-of-interest analysis or using other postprocessing methods. 4
4.1.2 DCE-MRP
DCE-MRP or pharmacokinetic MRI is based on the acquisition of series of T1-weighted images before, during, and after administration of gadolinium-based contrast agents. Two- or three-dimensional (2D or 3D) gradient echo imaging is usually performed. The resulting signal intensity–time curve reflects a composite of tissue perfusion, vessel permeability, and the extravascular–extracellular space. 5 , 6
The method allows for a time-resolved analysis of the contrast enhancement, which gives insight into the integrity of the BBB on its microvascular level. Using pharmacokinetic modeling, clinically most often based on a two-compartmental model (plasma space and extravascular–extracellular space), several characteristics can be derived: the transfer constant (Ktrans), the fractional volume of the extravascular–extracellular space (ve ), the rate constant (kev , where kev = K trans/ ve ), and the fractional volume of the plasma space (Vp). 7 , 8
4.1.3 ASL-MRP
ASL is a perfusion method that, rather than using an exogenous tracer, uses magnetically labeled blood as an endogenous tracer. Multiple ASL variants have been described.
The best tissue contrast can be reached with a specific subtype, the continuous ASL that uses a prolonged radiofrequency pulse, which continuously labels arterial blood water below the area of interest until a steady state of tissue magnetization has been reached. 9
Pulsed ASL is technically less demanding. 10 , 11 A short radiofrequency pulse is used to label a thick slab of arterial blood at a single point in time, and imaging is performed following an inflow delay into the tissue of interest. Both ASL methods only allow to extract values of CBF instead of the in tumors most often used CBV.
This chapter focuses on the use of DSC-MRP in the clinical management of patients with brain tumors.
4.1.4 DSC-MRP Protocol Recommendations
There are no specific hardware requirements to acquire imaging data that can be used for a DSC-MRP analysis.
The field strength does not substantially influence the perfusion imaging quality. However, the scanner needs to be capable of echoplanar imaging. The susceptibility effect of the contrast media is field strength dependent, which might require a higher contrast media dose when using field strength below 1.5 T.
Bolus injection of the gadolinium-based contrast agent should commence after about a 20 s delay (range, 5–30 s) from the start of the dynamic susceptibility contrast MRP sequence. A minimum of 4 mL/s (range, 3–5 mL/s) bolus injection rate of gadolinium-based contrast agent was previously recommended to allow for a robust and compact bolus arrival in the cerebral tissue. 12 This should be followed by a 25 mL (minimum 10 mL, maximum 30 mL) saline flush at the same rate to push the bolus toward the heart. A contrast media dose of 0.1 mmol/kg has been described as sufficient with modern MRI contrast media. 2 Higher doses are recommended only if older MRI technology is used. In cases where the perfusion study is combined with other contrast-enhanced techniques such as contrast-enhanced magnetic resonance angiography or DCE-MRP, the overall contrast media dose can exceed the single dose.
As newer publications proposed, 1 , 2 for a combined DSC and DCE perfusion protocol, which can be achieved in a single MRI protocol, it is recommended to start with the DSC, followed by the DCE sequence. The first injection serves two functions, first as a preload of gadolinium-based contrast agent to help compensate for leakage correction for DSC imaging, and, secondly, to provide dynamic data for calculation of permeability metrics. Because there is an approximate 5 to 8 min interval recommended between the two injections, an intervening sequence, such as diffusion-weighted imaging or fluid-attenuated inversion recovery (FLAIR) acquisition, can be performed between the two. If combined DCE- and DSC-MRP is being performed, one should split the contrast amount into two equivalent injections followed by a minimum 10 mL saline flush for each.
4.1.5 Postprocessing of Perfusion MRI Studies
There are many different methods for analyzing perfusion data; unfortunately, there is no standardization of postprocessing. 7 , 13 , 15 However, some general recommendations can be made. The method chosen depends on whether the focus is on a routine clinical question versus one posed in the setting of clinical research, where more semiquantitative or even quantitative approaches are needed. For routine clinical practice, simple visual inspection of the parametric color maps can be sufficient to detect areas of normal versus abnormal regions. Although this type of analysis does not provide quantitative assessment of perfusion metrics, it can be very useful in the clinical setting. 16
If semiquantitative data are desired, most often user-defined regions of interest (ROIs) can be placed in the tissue of interest as well as in the contralateral normal-appearing region, either normal-appearing white matter (NAWM) or gray matter depending on the location of the lesion. 17
Although placement of multiple ROIs is the most common method of analysis, this method still carries with it an unavoidable component of subjectivity; thus alternative methods such as histogram analysis have been examined that appear to provide meaningful perfusion metrics. 18 , 19 Histograms have the ability to demonstrate the heterogeneity of the ROI; however, there is loss of spatial specificity. 20 Parametric response mapping (PRM) is another advanced method of analysis in which parametric maps are coregistered over serial exams and compared on a voxel-wise comparison before and after treatment. 21 , 22
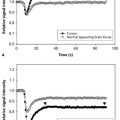
Calculation of a summary statistic such as relative CBV (rCBV) normalized to an internal control such as NAWM does not require the determination of the arterial input function (AIF) and simplifies postprocessing. According to work by Wetzel and Weber and their colleagues, the placement of a minimum of four small ROIs in the areas thought to contain the highest rCBV values based on color maps and recording the maximal rCBV (rCBVmax) demonstrated the highest intra- and interobserver reproducibility. 23 , 24 Visual inspection of the signal intensity–time curves resulting from ROI placement can be examined for qualitative interpretation as well. Increased area under the curve can be consistent with tumor, whereas decreased area can be consistent with radiation necrosis or non-neoplasm. Deconvolution of the concentration of tissue tracer by the AIF is required for absolute quantification of DSC-MRI-derived CBF and CBV. This, however, is technically challenging and is the focus of intense research. 25 , 26 , 27
4.2 Added Value of Perfusion in Brain Tumor Imaging Protocols
In recent years considerable clinical experience has been gained with perfusion MRI of tumors. Perfusion MRI can play an important role at the major clinical decision points: detection, differential diagnosis, intervention, and posttreatment monitoring.
This is based on the fact that rCBV values correlate with conventional angiographic evaluation of tumor vascular density as well as with histological measures of tumor neovascularity and grading. 17 , 24 , 28 , 29
DSC-MRI-derived metrics other than rCBV have been proposed in brain tumor assessment. Percentage of signal intensity recovery is a less complex alternative measure of microvascular permeability that can be derived from the DSC-MRI signal intensity–time curve. 30 , 31 Peak height is another alternative metric that can be derived from the DSC-MRI signal intensity–time curve that has been highly correlated with rCBV. 32
4.3 DSC Perfusion MRI for Differential Diagnostics and Diagnostic Workup of Patients with Brain Tumors
4.3.1 Glioma Grading
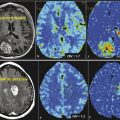
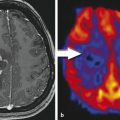
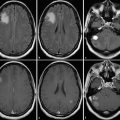
Besides the differential diagnosis between malignant and nonmalignant brain lesions (Fig. 4.1), multiple studies show that there is a strong correlation between glioma grade and CBV from DSC-MRI (Fig. 4.2 and Fig. 4.3). 18 , 24 , 28 DCE perfusion MRI markers also appear to be correlated with glioma grade; however, the correlation with rCBV and grade appears stronger. 33 Values and thresholds vary in the literature, likely stemming from differences in image acquisition, postprocessing, and interpretation.
Bisdas et al showed that rCBVmax > 4.2 was predictive of recurrence and rCBVmax ≤ 3.8 was predictive of 1 year survival in astrocytomas, excluding those with oligodendroglial components. 34 Theses values are higher than those previously reported by Lev et al (1.5) and Law et al (1.75), which could be due to differences in imaging technique, differences in tumor types, and methodology. 33 , 35 Law et al demonstrated that an rCBV threshold of 1.75 could predict median time to progression independent of histopathological findings. 36 rCBV has also been shown to increase up to 12 months prior to contrast enhancement being noted on conventional MRI in low-grade gliomas undergoing malignant transformation. 37


Related posts:
 7 Perfusion Imaging: Perfusion CT
 6 Perfusion Imaging: Arterial Spin Labeling
 1 Conventional Morphological Imaging: MRI Remains the Workhorse
 15 Image-Guided Neurosurgery: Intraoperative MRI
 18 On the Horizon: Going Beyond Conventional MR Contrast Agents
 13 It’s Not Just the Tumor: Treatment Effects
Stay updated, free articles. Join our Telegram channel

Full access? Get Clinical Tree


