Diagnosis: Acute stroke
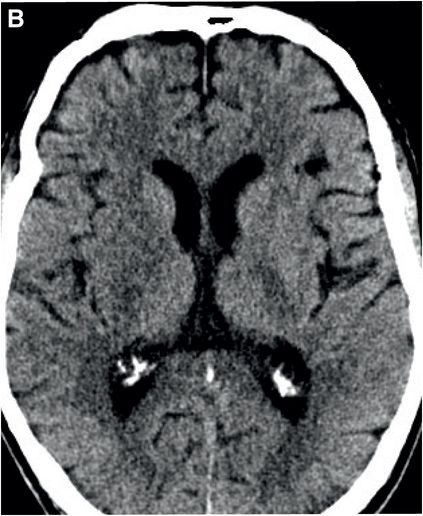
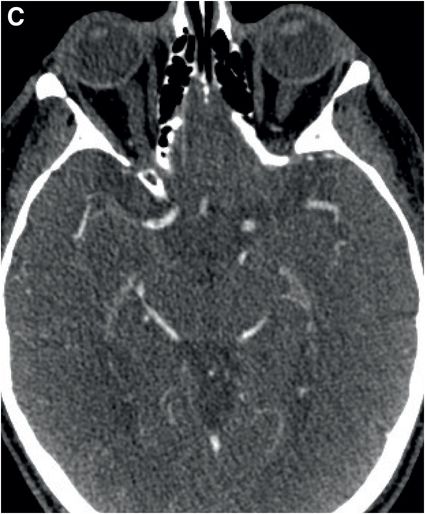
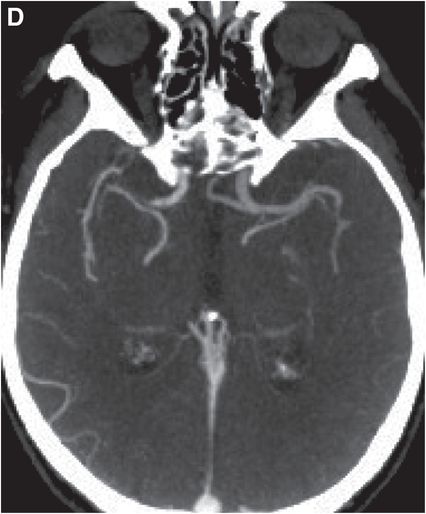
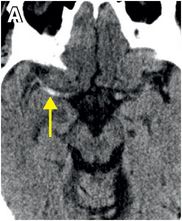
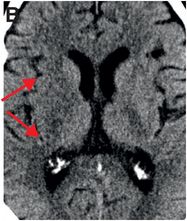
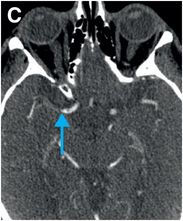
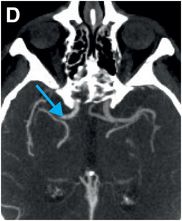
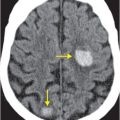
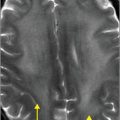
Axial noncontrast CT images of the brain (A, B) show a dense right middle cerebral artery (MCA) sign (yellow arrow, A) and subtle loss of definition in the right basal ganglia (red arrows, B) without hemorrhage. On contrast-enhanced CT angiogram (C, D), there is a cutoff at the proximal right M1 segment (blue arrows) on both the axial source (C) and axial maximum intensity projection (D) images.
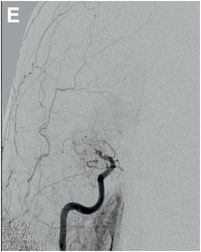
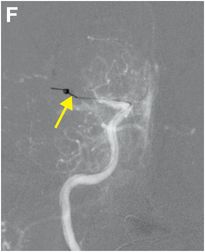
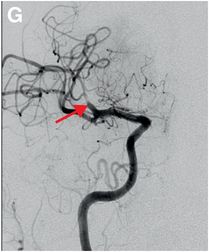
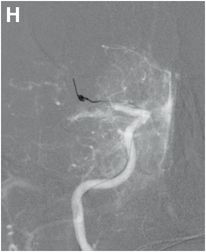
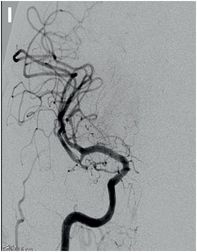
Serial cerebral angiogram images of a right internal carotid artery (ICA) injection in the same patient demonstrate cut-off at the proximal right M1 segment (E) followed by deployment of a MERCI clot retrieval device at the inferior division of M2 (yellow arrow, F) with restoration of this branch, though there is remaining thrombus of the superior division (red arrow, G). More thrombus was removed as the device entered the superior division (H) with resultant improved flow on the final injection (I). Case courtesy Ajit Puri, MD.
Discussion
Overview of stroke
Stroke is defined as cerebral tissue injury due to hemorrhage or ischemia, and is clinically characterized by focal or global neurological symptoms that last longer than 24 hours. Silent stroke without overt symptoms is uncommon, but has been recognized as a risk factor for future transient ischemic attacks (TIA) and stroke.
Stroke is the second most common cause of death worldwide and the third most common in the United States. It is the primary cause of adult disability, with an estimated cost of more than $50 billion per year. Approximately 5-700,000 people suffer strokes each year, with 17–34% dying within one month. 15 percent also suffer a second stroke within 5 years.
Risk factors and etiology of stroke
Risk factors for stroke include advanced age, hypertension, prior stroke or TIA, diabetes, hyperlipidemia, smoking, and atrial fibrillation.
Cerebral vascular ischemia accounts for approximately 80% of all strokes. Common causes include arterial compromise (thrombosis, atherosclerosis), embolism from cardiac causes, microvascular disease associated with conditions such as diabetes or hypertension, cerebral venous occlusion, and trauma-associated vascular injury such as dissection.
Other causes of stroke include vasculitis, patent foramen ovale (especially in younger patients), sickle cell disease, Moyamoya disease, and global hypoperfusion from events such as cardiac arrest. About 30–40% of the time, no clear etiology can be determined.
Clinical diagnosis of stroke
Patients with stroke often present with sudden rather than progressive symptoms. The constellation of presenting symptoms is highly dependent on the territory of infarction. Common symptoms of infarction include facial weakness, arm drift, and speech impairment.
Cranial neuropathy may be a prominent feature in brainstem stroke, while nausea and vomiting may indicate cerebellar stroke.
Only about a quarter of patients with stroke will have headaches.
Symptoms are scored using the National Institutes of Health Stroke Scale (NIHSS) which assigns a numerical value according to severity.
In approximately 13% of cases, non-ischemic conditions such as infection, seizure, syncope, metabolic disturbance, subdural collection, demyelinating disease, and tumor are mistaken for stroke.
Hemorrhage is more commonly seen in patients presenting with coma, vomiting, or headache and in patients who are hypertensive, hyperglycemic, or coagulopathic. About 15–20% of infarcts show hemorrhagic transformation at one week. Large infarcts and those that involve the brainstem are particularly prone to hemorrhagic transformation.
Physiology of stroke
Normal blood perfusion in tissue measures 50–55 mL/100 g/min.
Oligemia is defined as 30% of normal perfusion.
Cell death occurs at <12 mL/100 g/min. Unless timely and adequate reperfusion occurs, neurons become permanently depolarized and infarction ensues over minutes to hours.
The severity and time course of injury depend on the duration and degree of hypoperfusion and the integrity of compensation mechanisms such as cerebral autoregulation and collateral circulation.
Stroke is a dynamic process with imaging findings that evolve over time in a predictable manner. These findings correlate with underlying tissue pathology.
CT imaging of stroke
CT is not sensitive in the hyperacute period (within hours), and in about half of cases the brain appears normal. This is especially true of small infarcts and those occurring in the posterior fossa. In the acute period (hours to days), there is cytotoxic edema due to disrupted membrane protein function resulting in influx of sodium and extracellular water that leads to subsequent cell swelling. This usually appears as regional low attenuation, loss of gray–white matter differentiation, and sulcal effacement on CT.
In MCA strokes, the insular ribbon and basal ganglia are common sites for loss of gray–white differentiation. Hyperdense thrombus lodged in the M1 segment of the MCA is called the “dense MCA” sign.
A key role of CT in the hyperacute period is to assess efficiently for potential contraindications to thrombolysis, such as hemorrhage and infarct affecting more than one-third of the MCA territory. In the acute period, hypodensity, sulcal effacement, and loss of gray–white differentiation in the area of infarction become better defined.
MR imaging of stroke
DWI is the current gold standard for diagnosis of early or small acute ischemic changes, as it is often the only sequence that shows abnormality in the hyperacute to acute period. Decreased diffusivity from restricted Brownian motion of water molecules in infarcted tissue is seen as high signal on DWI and low signal on the apparent diffusion coefficient (ADC) map. Note that high signal on both DWI and the ADC map suggests “shine through” of T2 prolongation on DWI, as the diffusion-weighted image is inherently T2-weighted.
On FLAIR imaging, increased parenchymal signal typically appears hours after stroke onset. In addition, thrombus within an intracranial vessel may exhibit high signal on FLAIR and increased susceptibility on gradient echo imaging.
In large territory infarcts, gradient-recalled echo (GRE) and susceptibility weighted imaging (SWI) are sensitive in detecting small or petechial hemorrhage.
Gyriform enhancement due to slow vascular flow and endothelial damage with resultant capillary leakage (breakdown of the blood–brain barrier) occurs in the subacute period (days to weeks following stroke) and may last from weeks to months. The mass effect that characterizes the acute period disappears once enhancement begins.
“Luxury perfusion”, defined as return of cerebral blood flow to normal or higher-than-normal levels due to loss of autoregulation may also occur.
In the chronic period (after weeks to months), the infarct appears as an area of cerebrospinal fluid (CSF) signal intensity. Volume loss indicates encephalomalacia, and surrounding high FLAIR signal intensity reflects gliosis. Cortical laminar necrosis in the chronic stage appears as gyriform hyperintensity on T1-weighted imaging due to fatty necrosis or sometimes mineralization.
Related posts:
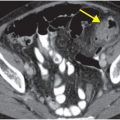 12 68-year-old man with left lower quadrant pain and hypotension
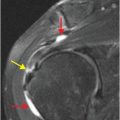 72 67-year-old female with shoulder pain and limited range of motion following a fall onto an outstretched hand
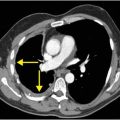 35 37-year-old woman with a history of rheumatoid arthritis presenting with non-resolving bilateral effusions and chest pain
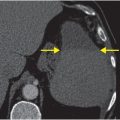 62 38-year-old male complaining of diffuse abdominal pain after a motor vehicle collision
 51 90-year-old male with elevated blood pressure and change in mental status. No history of trauma
 48 79-year-old woman with progressive deterioration in mental status over the course of 1 week
Stay updated, free articles. Join our Telegram channel

Full access? Get Clinical Tree


