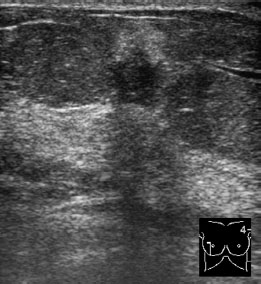
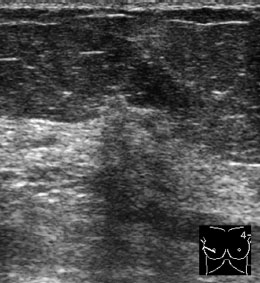
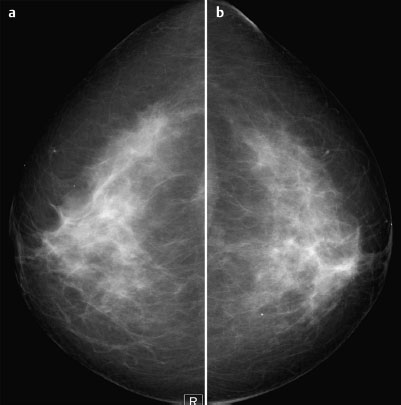
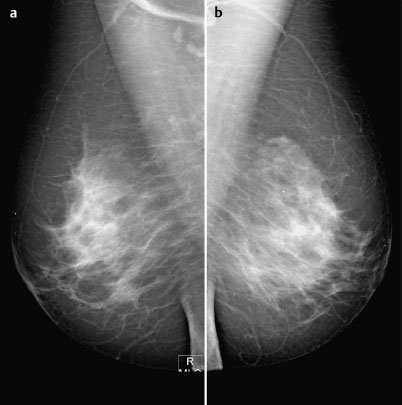
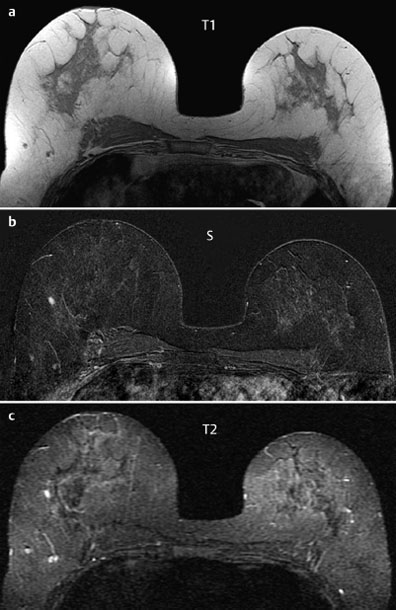
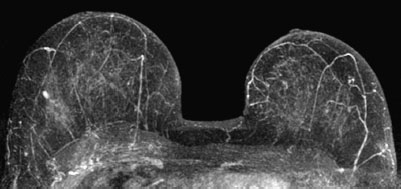
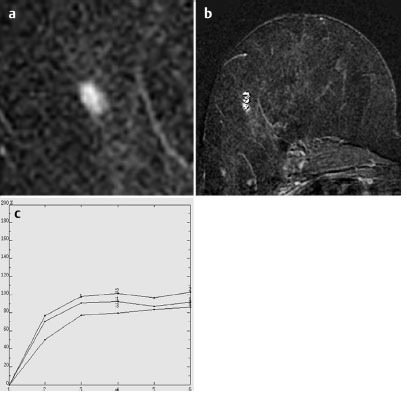
Case 47 Indication: Screening. History: Unremarkable. Risk profile: No increased risk. Age: 47 years. Fig. 47.1 Sonography. Fig. 47.2 Sonography. Normal. Fig. 47.3a,b Digital mammography, CC view. Fig. 47.4a,b Digital mammography, MLO view. Fig. 47.5a-c Contrast-enhanced MRI of the breasts. Fig. 47.7a-c Magnification view of the enhancing lesion and signal-to-time curve. Please characterize ultrasound, mammography, and MRI findings. What is your preliminary diagnosis? What are your next steps? This case presents the complete breast imaging diagnostics used in screening. There was a hypoechoic lesion with ill-defined borders in the right breast lateral to the areola, with moderate acoustic shadowing behind the lesion. However, ultrasound did not show definitive signs of malignancy. US BI-RADS right lateral 4. Mammograms showed inhomogeneous dense parenchyma, ACR type 3. Consistent with the ultrasound finding, in the CC view there was an impression of slight asymmetry in the lateral glandular tissue, with possible hyperdensity within the parenchyma. However, there were no clear signs of malignancy. Otherwise, no unusual findings. There were no architectural distortions and no calcifications were visible (BI-RADS right 3/left 1). PGMI: CC view P; MLO view G (skin fold, inframammary fold). MRI depicted a single oval hypervascularized lesion measuring7 mm in the lateral part of the right breast, clearly corresponding to the finding in ultrasound. This lesion had a high signal in T2-weighted imaging. MR imaging showed no other abnormalities. MRI Artifact Category: 1 MRI Density Type: 1
Clinical Findings

Ultrasound
Mammography
MR Mammography
Finding | Points | |
Shape | oval | 0 |
Border | well-defined | 0 |
CM Distribution | inhomogenous (septa?) | 1 |
Initial Signal Intensity Increase | moderate | 1 |
Post-initial Signal Intensity Character | plateau | 1 |
MRI score (points) |
| 3 |
MRI BI-RADS |
| 3 |
 Preliminary Diagnosis
Fibroadenoma.
 Differential Diagnosis
Adenoma, papilloma, carcinoma.
BI-RADS Categorization | ||
Clinical Findings | right 1 | left 1 |
Ultrasound | right 4 | left 1 |
Mammography | right 3 | left 1 |
MR Mammography | right 3 | left 1 |
BI-RADS Total | right 3 | left 1 |
Procedure
Histological analysis of the lesion in the right breast after US-guided percutaneous core biopsy.
Histology of the right breast (5 specimens)
Fat necrosis.
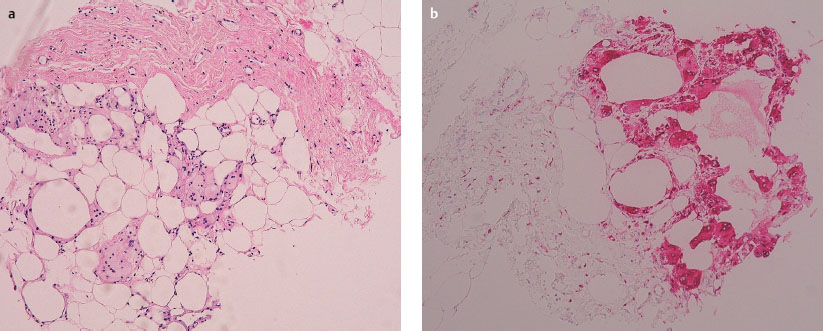
Fig. 47.8a,b Macrohistology of a representative specimen showing fat necrosis.
Histology
Fat necrosis.
Stay updated, free articles. Join our Telegram channel

Full access? Get Clinical Tree


