5 Perfusion Imaging: Dynamic Contrast-Enhanced T1-Weighted MRI (DCE-MRI) Perfusion
5.1 Introduction
Magnetic resonance perfusion imaging aims to derive hemodynamic information from magnetic resonance imaging (MRI) scans. Perfusion techniques include dynamic susceptibility-weighted contrast (DSC), arterial spin labeled (ASL), and dynamic contrast-enhanced T1-weighted perfusion MRI (DCE-MRI), the subject of this chapter. Because it does not require infusion of intravenous contrast material, ASL perfusion MRI can be performed entirely noninvasively and can be repeated at short intervals, without waiting for the subject to clear administered gadolinium. DSC-MRI begins with infusion of a rapidly administered bolus of contrast, after which repeated T2*-weighted acquisitions are made of the tissue of interest. DSC perfusion (Chapter 4) and ASL perfusion (Chapter 6) are discussed further in this volume.
DCE-MRI perfusion uses multiple T1-weighted images obtained at short intervals before and after intravenous administration of a bolus of gadolinium-diethylenetriamine pentaacetate (DTPA) contrast material to estimate, among other parameters, cerebral plasma volume and Ktrans, a calculated coefficient meant to reflect capillary leakiness. Repeated short-time-to-echo (TE) magnetic resonance (MR) images are obtained through the region of interest. Then, using MR signal intensity as a measure of intravoxel gadolinium concentration, data are fitted to one of the many available models of tracer kinetics to estimate metrics such as plasma volume and Ktrans.
Tissue hemodynamics are deranged in a wide variety of pathological states,1 including primary and secondary neoplasm; inflammatory conditions such as multiple sclerosis; infection; and epilepsy. Perfusion imaging facilitates the diagnosis of these entities. For example, a common clinical problem is to distinguish a tumefactive demyelinating lesion from a brain tumor. Perfusion imaging consistently yields tumor plasma volume measurements in tumors higher than those found in tumefactive demyelinating lesions.2 When the etiology of a primary brain tumor is uncertain, perfusion measurements are useful to predict the histological grade of a tumor, with higher-grade gliomas showing greater perfusion and capillary permeability.3 On this basis, some investigators have used MR perfusion to direct brain biopsy to the most aggressive component of the brain glioma. As new treatments for brain tumors have been developed, perfusion imaging has proved instrumental in separating complications along the radiation injury spectrum from progression of disease.4 Similarly, DCE-MRI perfusion has shown promise in assessing response to novel antiangiogenic therapies and as a tool in tailoring the chemotherapy regimen to the individual patient.
5.2 DCE-MRI Technique
5.2.1 General Principles
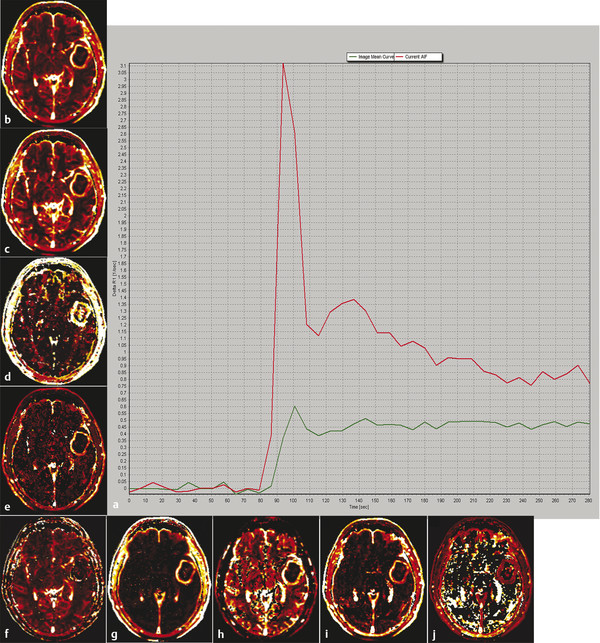
The goal of DCE perfusion imaging is to characterize the microvascular environment in the tissue of interest. Many different parameters can be assessed (Fig. 5.1, Table 5.1).5 Estimation of these parameters relies on accurate determination of the concentration of intravenous contrast (referred to as tracer in bolus tracking paradigms) at multiple time points as it moves through the voxel of interest. The link between the MR signal intensity of a voxel and the actual concentration of tracer within that voxel is more complex for DCE-MRI than for DSC-MRI, which assumes a linear relationship between tracer concentration and signal intensity.6 In the case of DCE-MRI, while the relationship of relaxivity (1/T1) with gadolinium concentration is linear, the relationship between observed signal intensity and relaxivity depends on precontrast tissue relaxivity, flip angle, repetition time (TR), and proton density.7 The dependence on precontrast relaxivity necessitates that imaging begin before the injection of intravenous contrast material to establish baseline T1 values.
Parameter | Definition | Units |
Perfusion curve | Dynamic dose response perfusion curve of signal intensity over time | – |
AUC | Area under the perfusion curve | – |
Kep | K21, the volume transfer constant of contrast from the EES to the blood plasma | min−1 |
Ktrans | K12, the volume transfer constant of contrast from the blood plasma to the EES | min−1 |
PE | Peak enhancement | – |
TTP | Time to peak enhancement | s |
Ve | Volume of EES | – |
VP | Blood plasma volume per unit volume of tissue | mL/100g or % |
Wash-in | Initial upslope of perfusion curve | – |
Wash-out | Downslope of perfusion curve | – |
Abbreviation: EES, extravascular extracellular space. | ||
5.2.2 Theory and Pharmacokinetic Models
Various hemodynamic data can be extracted from a series of contrast concentrations that change over time. The simplest and most straightforward approach is to make observations directly about the contrast versus time curve, without fitting data to any kind of model.8 So-called non-model-based measurements include time to peak enhancement (TTP), peak enhancement or maximum signal intensity, wash-in rate, and wash-out rate.9 Another approach is to obtain the integrated area under the signal intensity curve (IAUC or AUC). The signal intensity curve is integrated from the arrival of contrast material to a predetermined end point in time, such as 60 seconds after contrast arrival.10 Although non-model-based measurements have been used with some success to differentiate gliomas of different histological grades11 and to differentiate treatment-induced necrosis from tumor progression,12 they represent descriptive indices that lack definite physical meaning. For example, which model parameter is the closest correlate of the IAUC measurement depends on primary hemodynamic variables, such as blood flow.13 Thus the most accurate understanding of the IAUC is that it represents simply the quantity of contrast material delivered to and retained by the tissue of interest over the measured time interval.14
In contrast, model-based parameters result from fitting of the observed changes in tracer concentration to a mathematical model of the local tissue microenvironment. Most commonly, a simplified two-compartment model is employed.15 Tracer flows in from a large artery and passes over time into the capillary system. From there, if there is disruption of the blood–brain barrier, it can move across the endothelium and into the surrounding tissue. The two compartments are the blood plasma space or intravascular plasma space (IVPS), which represents the fraction of whole blood within which tracer is distributed (the plasma), and the extravascular extracellular space (EES), which represents the fraction of tissue to which the tracer has access. Because gadolinium-based compounds are not thought to cross the cell membrane, the intracellular compartment is not considered in the model. With the two-compartment model in mind, tissue concentration of tracer depends on flow from the IVPS into the EES as well as flow from the EES back to the IVPS, each of which depends on the concentration gradient between the two spaces. This yields the following differential equation:
where Cp represents the plasma concentration of tracer (IVPS) and Ct represents the tracer concentration in tissue. Ve is the tracer concentration in tissue used to estimate the fractional volume of the EES. Ktrans and Kep (= Ktrans/Ve) are the transfer constants. A solution to the differential equation is given by the extended Tofts and Kermode model, which includes a term for estimating the contribution of capillary plasma tracer.16
Estimation of model-based parameters amounts to finding parameters Vp, Ktrans, and Ve such that the difference between calculated and observed measurements of Ct is minimized. Bagher-Ebadian et al17 also advocate performing a voxel-by-voxel model selection based on the single capillary model or its nested reduced models for estimation of Ktrans.
Because model-based parameters rely on precise determination of tissue tracer concentration Ct, an allowance for the inflow of tracer at each time point must be made. This quantity is known as the arterial input function (AIF) and may be measured directly from a large artery at the base of the brain, such as the internal carotid or middle cerebral artery. This is ideal for model fitting because per-patient measurement accounts for patient-specific factors, such as cardiac output, that affect contrast delivery to tissue. However, measurement of arterial signal intensity is fraught with difficulties, including imaging artifacts related to saturation effects and arterial orientation within the slice. A very high temporal resolution is required for accurate sampling, on the order of one image per second.10 An alternative is to use a standardized AIF, though this may be a poor representation of individual arterial blood flow and can generate large errors in tracer concentration measurement.18
5.2.3 DCE-MRI Limitations
Primary limitations common to all advanced MRI techniques, including DCE-MRI, involve the lack of standardization for image acquisition, postprocessing, analysis, and interpretation. Differences in the conversion of MRI signal to contrast concentration, temporal resolution, and estimations of contrast exchange between the intravascular space and the EES potentially affect both the accuracy and the precision of the perfusion results.19 Lack of whole brain coverage is another issue in patients with large or multifocal tumors. In addition to the many choices available for model and non-model-based data analysis, the relative novelty of DCE-MRI also presents a lack of consensus of the optimal imaging metrics to be measured in tumors. Notwithstanding these potential technical limitations, and the imperfect comparisons and generalization of results among different institutions, we have been using DCE-MRI to measure VP and Ktrans in our tumor patients to take advantage of the purported benefits in measuring perfusion and leakiness with promising early results,
5.3 Clinical Applications
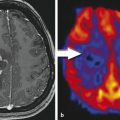
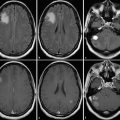
Conventional MRI is the most useful radiographic modality in the localization and differential diagnosis of space-occupying cerebral lesions. Unfortunately, lesions of very different primary etiologies can overlap considerably in MRI appearance. Neoplastic, infectious, and demyelinating lesions, to name just a few, may all manifest as nondescript ring-enhancing masses. Determination of the perfusion characteristics of a lesion can aid in separating these entities; in general, brain tumors show marked central hyperperfusion, and other lesions, such as abscesses, do not.20
To date, most studies evaluating the utility of perfusion MRI in the characterization of brain lesions have employed DSC perfusion techniques. As described in depth in a separate chapter of this book, DSC perfusion relies on gadolinium contrast-induced decrease in signal intensity on T2*-weighted images to estimate perfusion parameters such as blood flow, blood volume, and mean transit time. Such studies have highlighted the usefulness of perfusion-weighted imaging in distinguishing abscess from infected neoplasm or cystic tumor and in characterizing demyelinating lesions and normal-appearing white matter in patients with multiple sclerosis.21,22,23 A few studies of DCE-MRI have investigated perfusion and capillary leakiness in infectious and demyelinating diseases. DCE-MRI has proved most useful, however, in the diagnosis and grading of primary neoplasms of the brain, and as a problem-solving tool in cases of suspected treatment-related change or radiation injury.
5.3.1 DCE-MRI Perfusion in Glioma Diagnosis and Characterization
DCE-MRI has found its broadest application in the diagnosis and characterization of neoplasms of the central nervous system, primarily gliomas. Malignant gliomas account for approximately 70% of the 22,500 new cases of primary brain tumor diagnosed in the United States each year, of which approximately 14,000 are glioblastoma.24 The World Health Organization (WHO) classification divides gliomas into four grades, with grades III and IV considered malignant. Pathologically, higher grades of tumor are characterized by increased cellularity, more numerous atypical nuclei, and greater mitotic activity. Clinically, gliomas of higher grade carry a worse prognosis: WHO grade II astrocytoma confers a 6- to 8-year median survival, whereas WHO grade IV tumors are usually fatal within about a year.25 At present, although conventional MRI can suggest the tumor grade, only biopsy, which is extremely invasive in the brain, provides a definitive diagnosis. For the purposes of patient counseling and for the selection of appropriate therapy, a noninvasive means to assess tumor grade and aggressiveness is highly desirable.
The link between glioma grade and density of tumoral vessels is well established,26,27 with more advanced tumors having greater vascularity. Oxygen and other vital nutrients are only able to diffuse over a relatively short distance in tissue (1–2 mm). For a tumor to grow larger than a few millimeters in size, it must induce the creation of new vessels to supply it in a process referred to as neovascularization or neoangiogenesis.28 This complex cascade is stimulated by hypoxia and mediated by a host of vascular growth factors and other molecules.29 Of these, vascular endothelial growth factor (VEGF) has emerged as the most important for angiogenesis in gliomas.30 VEGF has been shown to stimulate capillary growth from host vessels,31 increase microvascular permeability,32 and cause vasodilatation in normal host vessels.33 Expression of the VEGF gene correlates directly with tumor grade.34 As will be discussed in a subsequent section, VEGF and other vascular growth factors have become primary targets for novel antiangiogenic chemotherapies.
In contrast to the new vessels produced by nonpathological angiogenesis, for example, as a step in normal development or in wound healing, tumor vessels are heterogeneous, fragile, and arranged in a chaotic pattern.35 In the brain, this means that the blood–brain barrier, which relies on tight junctions between endothelial cells, is not maintained. Absence of the normal blood–brain barrier is expected to lead to increased Ktrans at DCE-MRI. Similarly, the greater vascular density of gliomas is expected to manifest as increased plasma volume. A primary goal of DCE-MRI is to complement conventional MRI by quantifying microcapillary perfusion and leakiness.
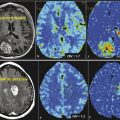
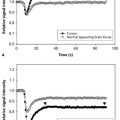
Hyperperfusion has been shown to correlate with increased tumor grade and more aggressive tumor biology. To date, most investigators have employed T2*-weighted dynamic susceptibility contrast (DSC) perfusion techniques, with cerebral blood volume (CBV) or relative CBV (rCBV) usually the best predictor for glioma grade.36,37,38,39,40 DSC perfusion-derived rCBV and Ktrans have performed well as the best set of independent measures to predict glioma grade.39 Computed tomographic (CT) perfusion-derived metrics have also been correlated with WHO grade and microvascular density.41,42,43,44,45 Early DCE-MRI literature has described similar success in predicting glioma grade. Nguyen et al46 examined DCE-MRI in 46 patients with newly diagnosed gliomas using a phase-derived vascular input function and bookend T1 measurements before and after contrast injection. They found that the median plasma volume increased from grade II (0.64 mL/100 g, n = 9) to grade III (0.98 mL/100 g, n = 9) to grade IV (2.16 mL/100 g, n = 28), with significant differences between grades III and IV (p = 0.015) but not between grades II and III (p = 0.15). Median Ktrans values also increased from grade II (0.0041 min−1) to grade III (0.031 min−1) to grade IV (0.088 min−1), with significant differences between grades III and IV (p = 0.04) but not grades II and III (p = 0.05). In our experience, DCE-MRI–derived plasma volume (analogous to CBV) and Ktrans also show good correlations, with both metrics increasing with increasing glioma grade (Fig. 5.2).

Several other studies have investigated the relationship between glioma grade and capillary leakiness determined by DCE-MRI. Early studies3,47,48 provided conflicting results, possibly because of the large number of different models used to derive perfusion parameters. A 2005 study by Pantakar et al,49 using three-dimensional (3D) T1-weighted spoiled gradient recalled (SPGR) images and a first-pass method of analysis described by Li et al,50 studied Ktrans and CBV in 39 patients with WHO grade II through IV gliomas. They found a significant correlation between Ktrans and CBV (r = 0.688) and significant differences between tumor grades for both Ktrans and CBV. Pairwise comparisons between grades revealed significant differences in CBV and Ktrans in all cases except the grade III versus IV comparison. Ultimately, the model was able to classify tumor grade with an overall accuracy of 74.4% and to distinguish between low-grade (WHO grade II) and high-grade (WHO III and IV) gliomas with sensitivity and specificity both greater than 90%. The authors suggested that their model was less successful at separating grade III from grade IV gliomas because many patients with grade IV gliomas had already been treated with steroids at the time of imaging, a therapy that is known to decrease capillary leakiness.
A more recent study of DCE-MRI in gliomas by Zhang et al51 used the extended two-compartment Tofts model to analyze five perfusion parameters in 28 patients with histopathologically graded gliomas. Ktrans and Ve (fractional volume of the EES) showed significant differences among tumor grades. As in the Pantakar study, Ktrans was a significant independent discriminator of grade II from grade III and grade IV tumors but not of grade III from grade IV lesions. Ktrans distinguished low- from high-grade gliomas with sensitivity of 0.92 and specificity of 0.85. The superiority of Ktrans compared with CBV for separating tumor grades has been reported elsewhere as well.52
If DCE-MRI is useful in distinguishing different grades of tumor, it should also be useful for identifying regions of higher grade within an individual lesion. Because histological grade reflects the most anaplastic portion of the tumor, and gliomas are notoriously heterogeneous, biopsy should ideally be directed at the most advanced portion of the neoplasm. Conventional MRI has been used to guide biopsy but in many cases does not provide adequate lesion characterization, especially in cases of nonenhancing tumor.53,54,55 A recent study by Weber et al56 applied DCE-MRI, DSC-MRI, and ASL perfusion imaging as well as fludeoxyglucose positron-emission tomography (FDG PET) and MR spectroscopy to 61 patients with gliomas that were subsequently either resected or biopsied. Kep (= Ktrans/Ve, the rate constant for diffusion of contrast from the EES to the blood plasma) was estimated with the Tofts two-compartment pharmacokinetic model. The amplitude of the enhancement curve was also measured. The authors found a significant correlation of both Ktrans and enhancement amplitude with tumor grade. With regard to selection of the most advanced portion of tumors for biopsy, the authors found good agreement between the different advanced MR techniques in identifying the tumor areas most biologically active and thus most appropriate as biopsy targets.
Related posts:
 7 Perfusion Imaging: Perfusion CT
 6 Perfusion Imaging: Arterial Spin Labeling
 1 Conventional Morphological Imaging: MRI Remains the Workhorse
 15 Image-Guided Neurosurgery: Intraoperative MRI
 18 On the Horizon: Going Beyond Conventional MR Contrast Agents
 13 It’s Not Just the Tumor: Treatment Effects
Stay updated, free articles. Join our Telegram channel

Full access? Get Clinical Tree


