Abstract
This chapter outlines a standard method for interpretation and reporting of diagnostic MRI examinations and discusses the management of patients with challenging clinical or imaging diagnoses. Included is a structured reading method, providing clarity and uniformity of interpretation across breast MRI practices. Standard reporting includes not only lesion characterization and a final category assessment, but also specifics of the MRI acquisition, type and amount of GBCA administered, volume of fibro-glandular tissue (FGT) and amount of background parenchymal enhancement (BPE). Critical to accurate interpretation is the selection of reading protocols at the workstation which include the T2w Sequence, the MIP Image (First post-contrast T1w Image, both Source and Subtraction), the T1w Dynamic Sequence (Source and Subtracted Images) and the Kinetic Analysis. Sample protocols are shown. A discussion of challenging diagnoses including evaluation of patients with nipple discharge and papillary lesions, are supplemented with 23 case examples. A section on breast MRI Reporting reviews the Breast Imaging Reporting and Data System (BI-RADS®) developed by the American College of Radiology.
An excellent review of breast implants and the MRI findings of normal breast implants and their associated various abnormalities are further discussed in detail by DR Middleton This section includes the terminology and types of Implants, the MR appearance of various implant abnormalities, including types of rupture, standard reporting of implant cases and methods to improve the challenge of difficult diagnoses
6 Diagnostic MRI Interpretation
6.1 Introduction
In this chapter, we will outline a standard method for interpretation and reporting of diagnostic magnetic resonance (MR) examinations and discuss management of patients with challenging clinical or imaging diagnoses, including evaluation of women with current or prior implants.
6.2 Interpretation Protocol
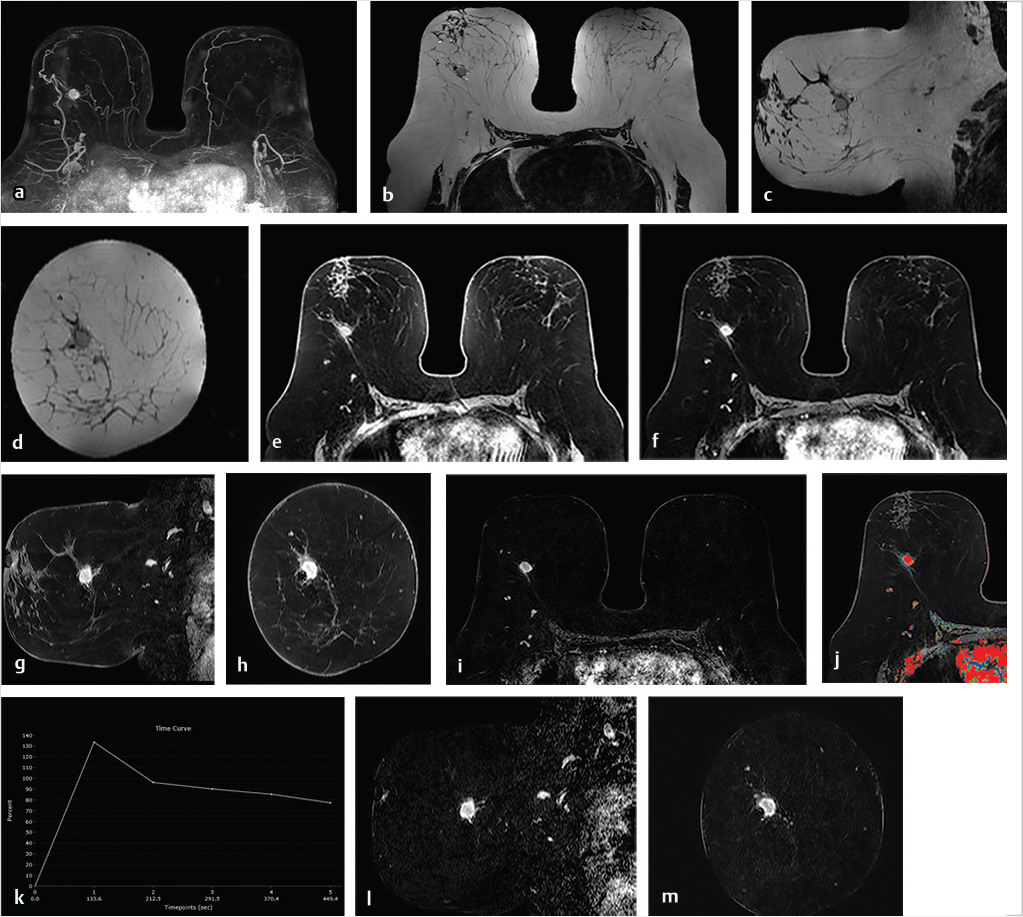
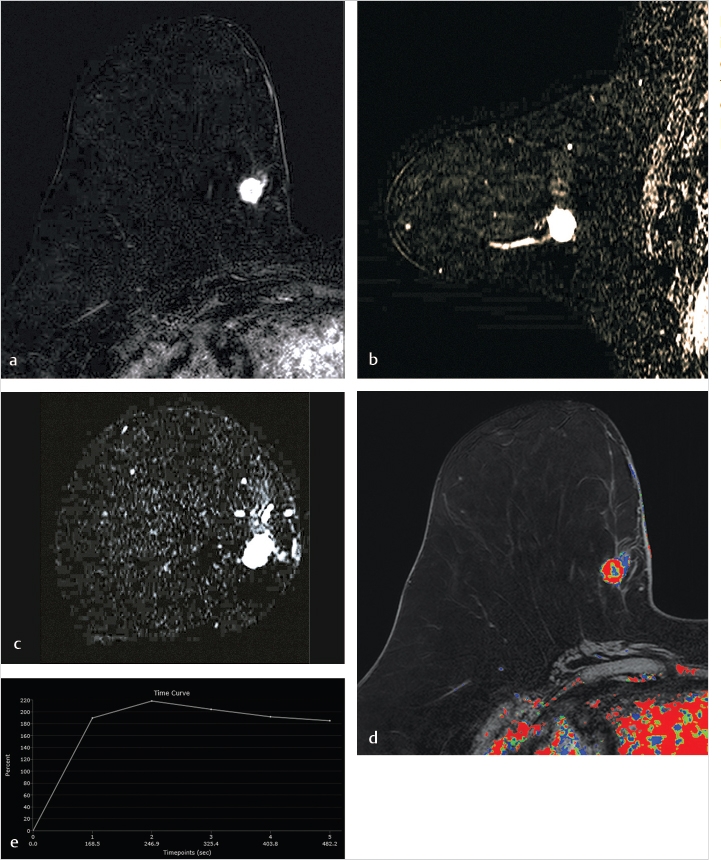
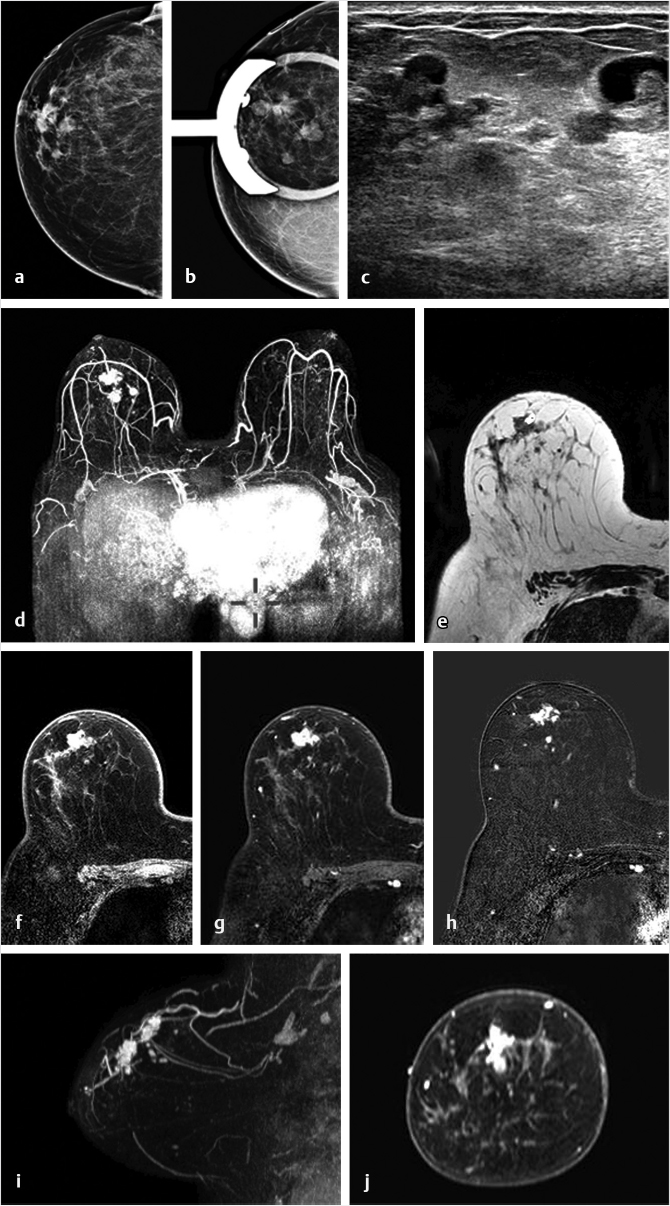
A standard reading method provides structure and uniformity of interpretation across breast MR practices. The radiology report should include not only lesion characterization and a final category assessment, but also specifics of the MR acquisition, the type and amount of gadolinium-based contrast agent (GBCA) administered, the volume of fibroglandular tissue (FGT), and the amount of background parenchymal enhancement (BPE). A standard interpretation method for diagnostic breast magnetic resonance imaging (MRI) examinations is outlined below, and a standard hanging protocol is illustrated (Fig. 6‑1).
6.3 MIP Image (First Postcontrast T1w Image, Source, and Subtraction)
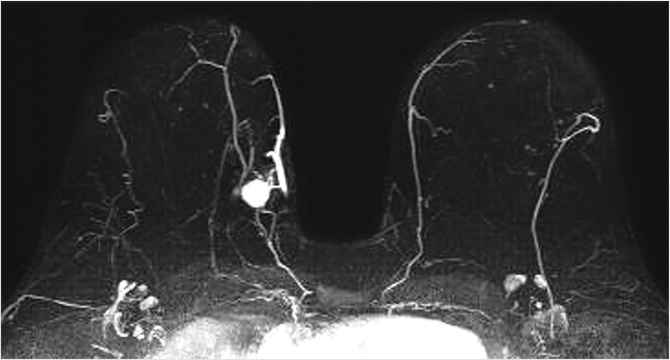
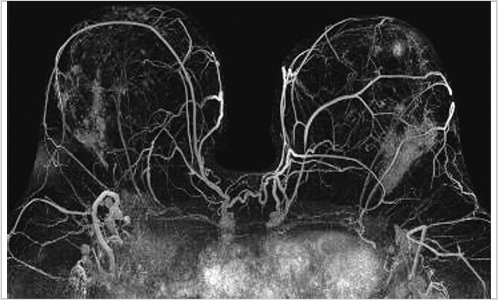
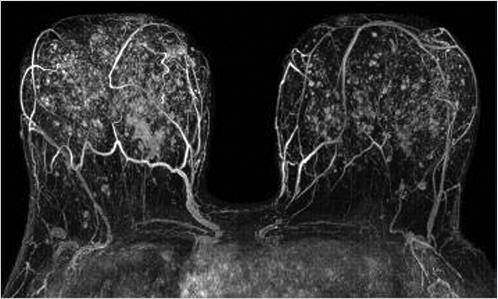
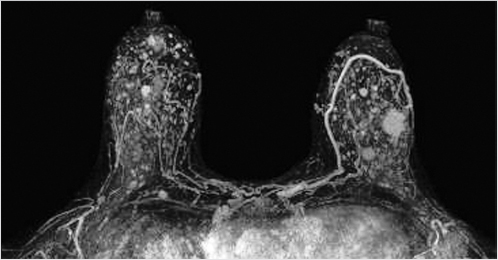
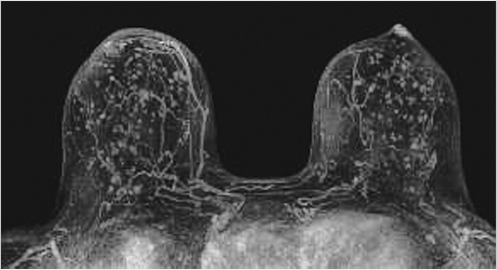
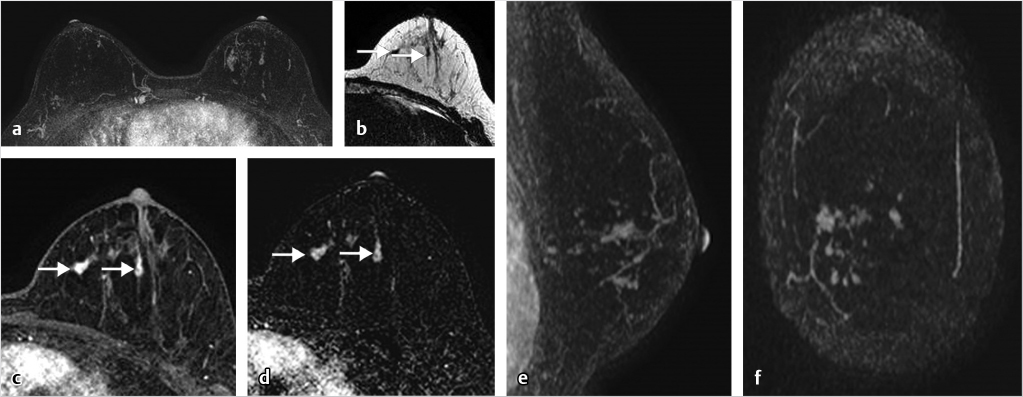
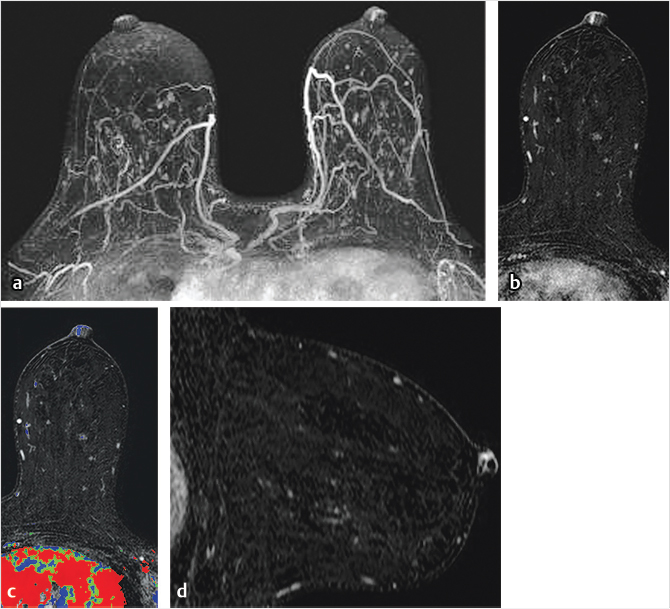
The maximum intensity projection (MIP) images provide a useful overview of breast enhancement. Successful dynamic contrast-enhanced MRI (DCE-MRI) requires a rapid bolus injection of contrast, and this can be evaluated by identifying cardiac and major vascular enhancement on the first postcontrast series. The technologist should always check for the presence of contrast enhancement in the heart and great vessels during scanning. If contrast enhancement is not evident on the first postcontrast images, the technologist should check the injection site. Contrast injection into the subcutaneous tissue of the arm or a break in the tubing delivery mechanism could account for an unsuccessful DCE-MRI study; when this occurs, repeat examination is usually necessary. The radiologist should be certain that the dynamic sequence is acceptable by looking for adequate contrast bolus enhancement in the heart and nearby vasculature. Be aware that low delivery of contrast agent may occur in patients with cardiac failure, resulting in delayed contrast delivery. BPE can be assessed on the first postcontrast MIP image. Enhancing lesions and other findings may also be visible on MIP images (Fig. 6‑2) and, if seen, should be further evaluated on source and subtracted images within the complete dynamic series.
6.3.1 T2w Sequence
The T2-weighted (T2w) sequence can be acquired with fat saturation (typically at lower spatial resolution) or without fat saturation (typically at higher spatial resolution). The amount of FGT can be assessed on this series and should be included in the report. This sequence is useful for identification of high-signal fluid, as found in cysts, subareolar ducts, intratumoral necrosis, and subcutaneous/peritumoral edema. Other findings include visualization of normal or abnormal axillary, intramammary and internal mammary lymph nodes, breast masses, skin thickening, and postsurgical changes. The T2w series can also be used for assessment of postsurgical or postbiopsy marker clips and changes resulting from breast reconstruction surgery, and, as will be discussed later in this chapter, can also assist in the assessment of soft-tissue silicone resulting from implant rupture and from breast silicone fluid injections.
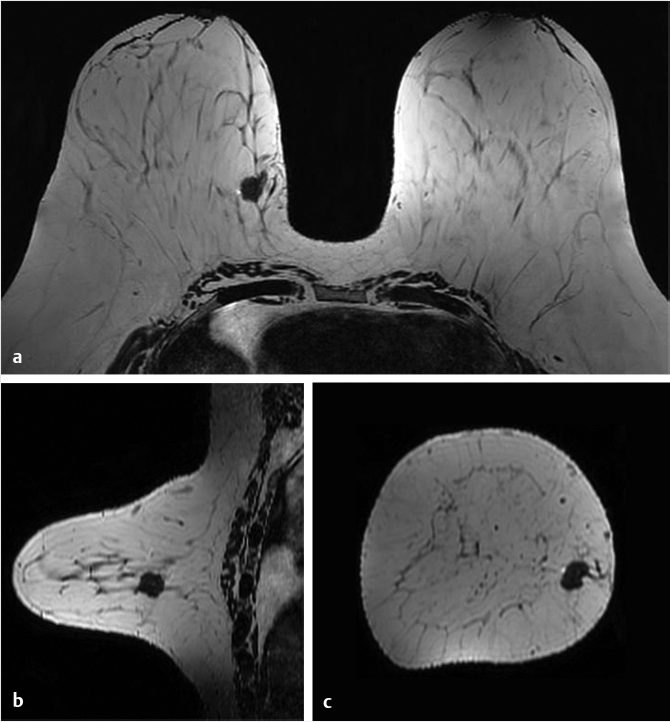
The high-spatial-resolution T2w series allows matching of images slice-by-slice with the T1w DCE series. This sequence accomplishes the need for both a T2w series and a non–fat-suppressed T1w precontrast series and incorporates both acquisition requirements into a single acquisition (Fig. 6‑3). This high-resolution T2w series provides improved assessment of mass morphology and identification of peritumoral and prepectoral edema, findings that may not be visualized on the thicker slices that accompany a fat-suppressed T2w acquisition. Although the T2w sequence may not be helpful for evaluation of noninvasive cancer (because NME exhibits very few precontrast findings) it is very useful for characterization of breast masses.
6.3.2 T1w Dynamic Sequence (Source and Subtracted Images)
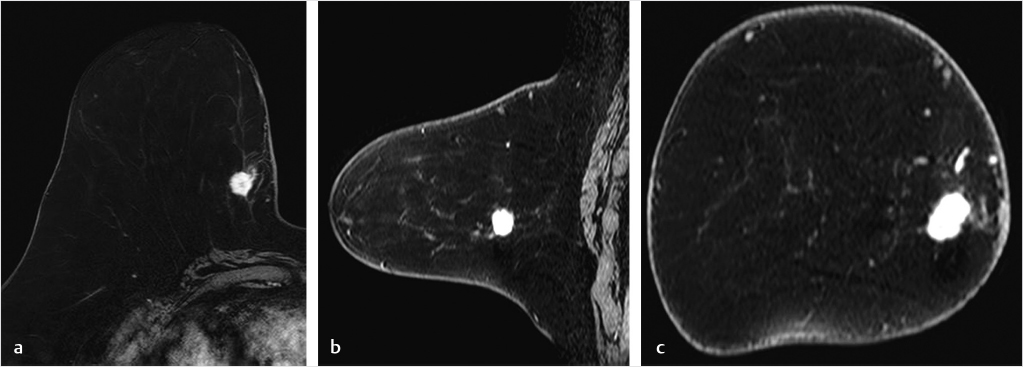
The pre- and postcontrast source and subtracted series are next reviewed. It is important to check the precontrast images to be sure that the fat saturation is uniform and to check the subtraction images for evidence of motion artifact. Next we search for abnormal enhancement, which is usually seen best at the first and second time points when the enhancement is most intense and is distinct from BPE. Analysis of any enhancing lesion should include a morphologic assessment of shape, margin, internal enhancement, and distribution characteristics; multiplanar reformatting (MPR) and slab images can be useful in this regard (Fig. 6‑4, Fig. 6‑5). Lesion size, location, laterality (right or left breast), and breast quadrant (including the appropriate use of “central”) and retroareolar and axillary tail should be reported. Lesion distance from the nipple, skin, or chest wall should be measured when appropriate. Although enhancing masses may be visible on the MIP images, careful evaluation of the first and second postcontrast source and subtraction images is needed for complete diagnosis. If an enhancing lesion is found on the T1w postcontrast series, review of the precontrast T2w series may identify a correlate lesion. Viewing of the later postcontrast sequences is also necessary to ensure identification of certain slowly enhancing cancers and for assessment of treatment response for patients undergoing serial MRI examinations during neoadjuvant chemotherapy; delayed enhancement is the only indication of residual disease in some cases. The ability to compare lesion characteristics on both T2w and T1w sequences with identical spatial resolution can result in improved diagnostic specificity.
6.3.3 Kinetic Classification
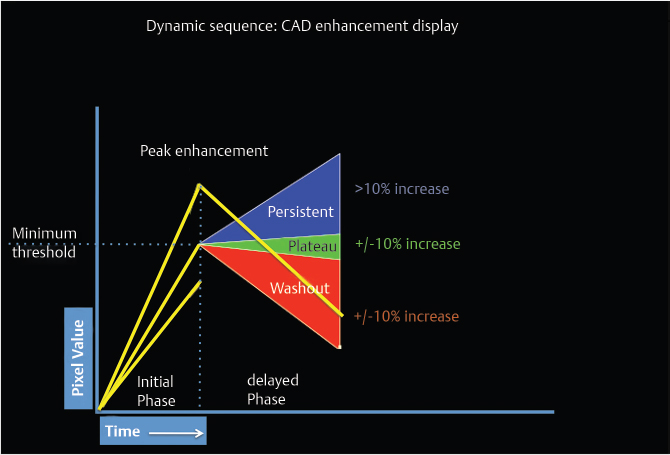
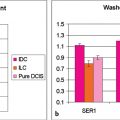
DCE-MRI kinetic techniques derived from imaging acquired over a standard time interval following contrast injection (5–7 minutes) include measures of the uptake and washout of contrast in tissues and contain diagnostically useful information. The shape of the signal-intensity-versus-time curve (TIC, or signal time-course, or kinetic curve), which plots signal intensity over time, has been found to be useful in the classification of enhancing lesions. Signal intensity is analyzed on a pixel-by-pixel basis within an enhancing lesion. TIC data can be obtained by using a manual technique, placing a region-of-interest (ROI) of at least 3 pixels on the most suspicious region of enhancement within an enhancing lesion. Changes in signal intensity are then monitored over time. Accurate analysis of TIC data strongly depends on predictable delivery of a GBCA using a bolus technique and a dose administered according to patient body weight. Most practices in the United States now utilize computer-aided analysis systems, allowing depiction of kinetic parameters on a pixel-by-pixel basis in parametric images describing intralesional variations in blood flow. These analytic tools can not only automatically display TICs, but also generate color maps of lesions that enhance above a set threshold. Thresholds are usually set between 50% (slow initial rise), 50 to 100% (medium initial rise), and >100% (fast initial rise). The parametric images reflect all lesions or tissues enhancing above a predetermined threshold below which no enhancement is measured, and exhibit “persistent” (continued increasing enhancement >10% above threshold), “plateau” (relatively constant signal intensity), and “washout” (decreasing signal intensity following peak enhancement >10% below threshold). Lesion color-coding of the delayed phase of enhancement can facilitate interpretation of the kinetic data (Fig. 6‑6).
Given that MRI is usually the last study in the diagnostic chain to be acquired, knowledge of the patient’s medical history and review of all prior imaging studies are essential for optimal interpretation of the breast MR examination.
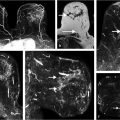
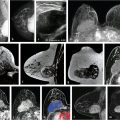
6.4 Interpretation Challenges
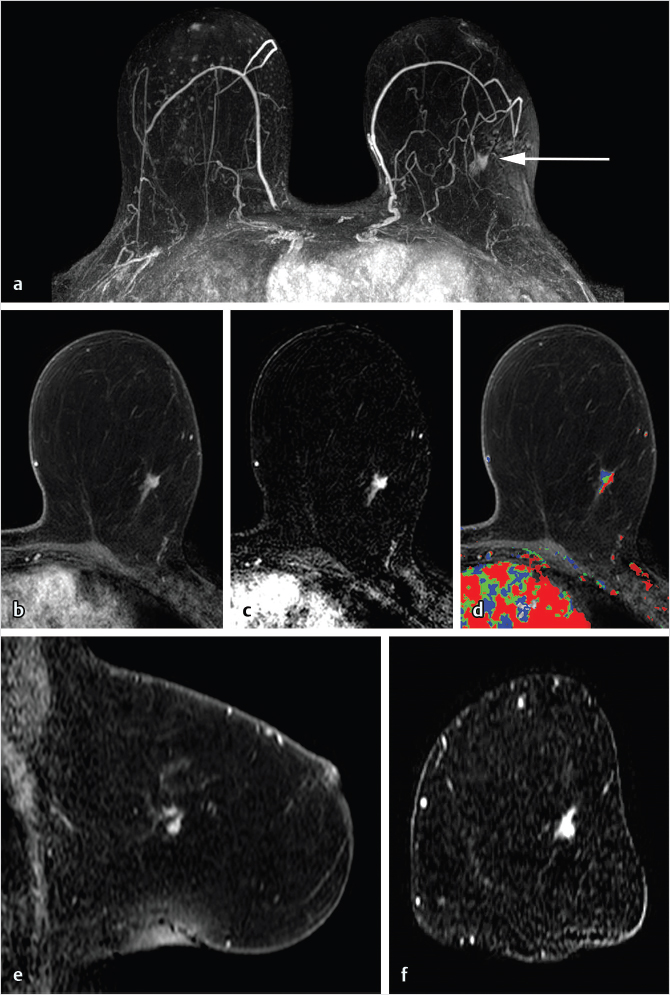
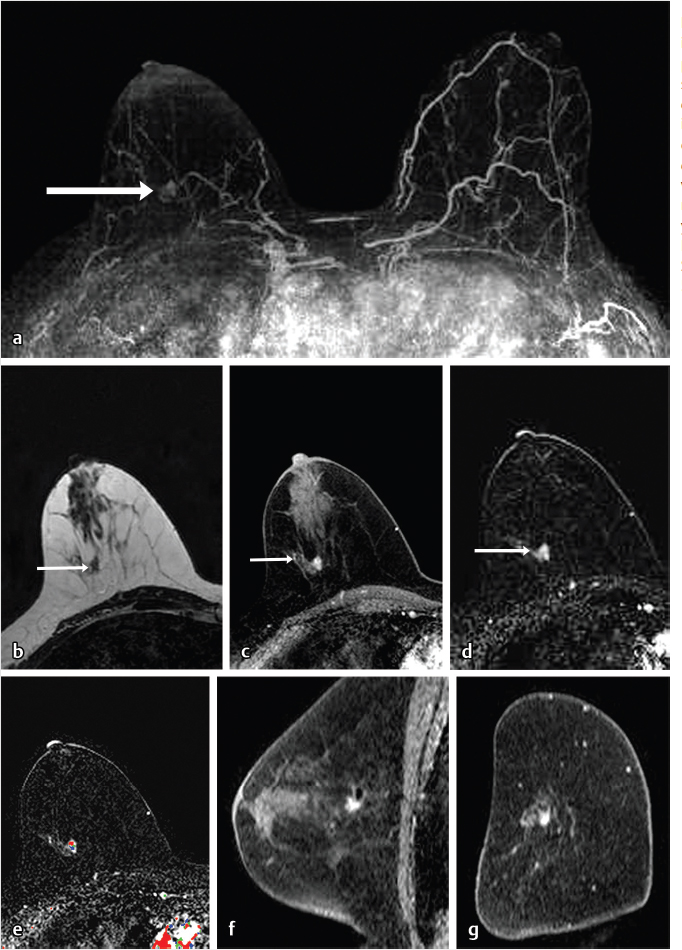
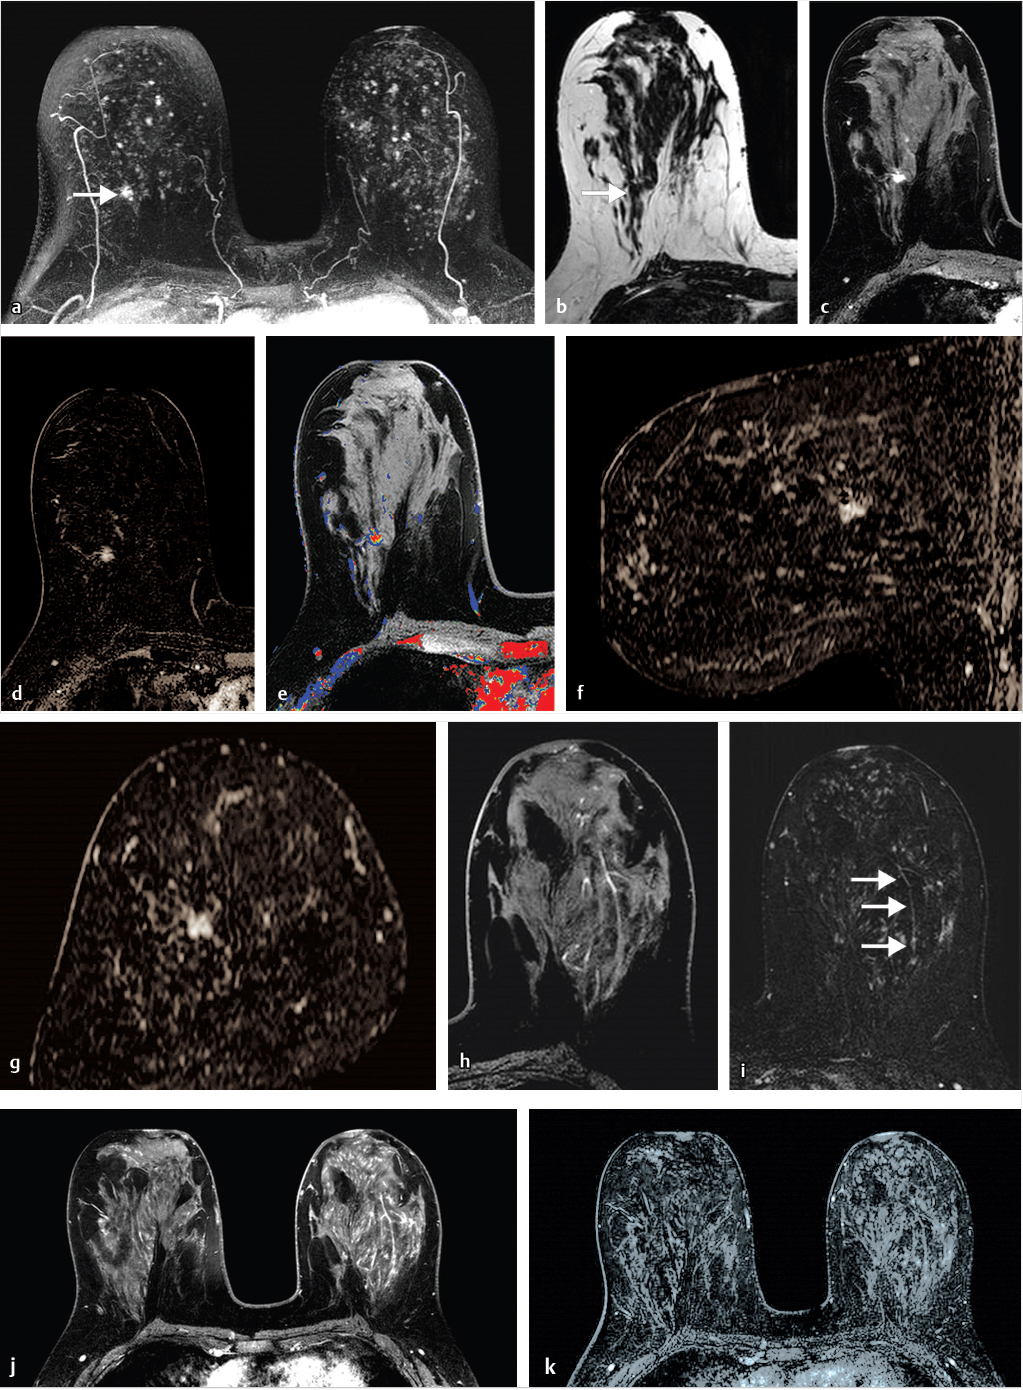
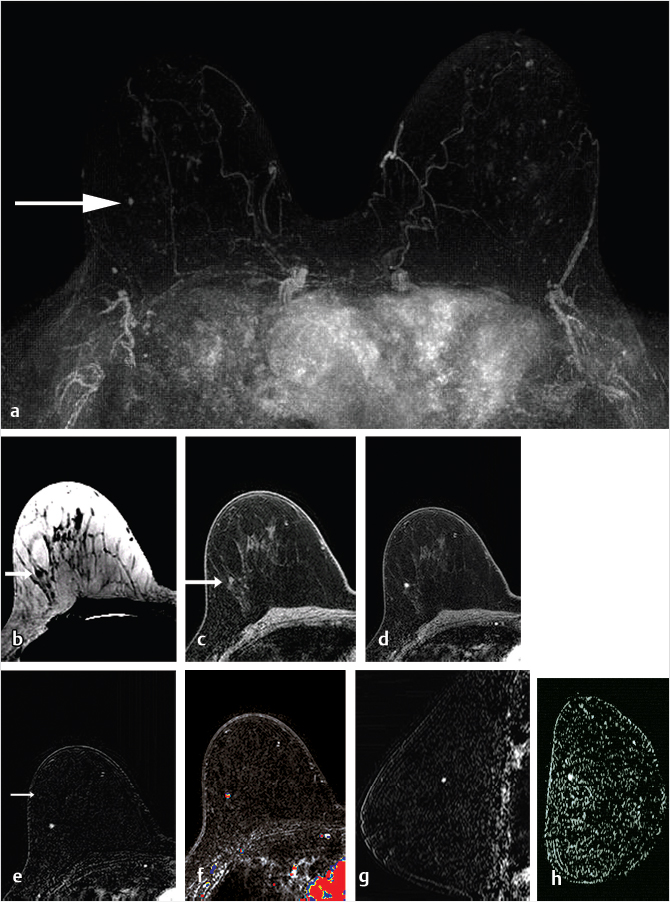
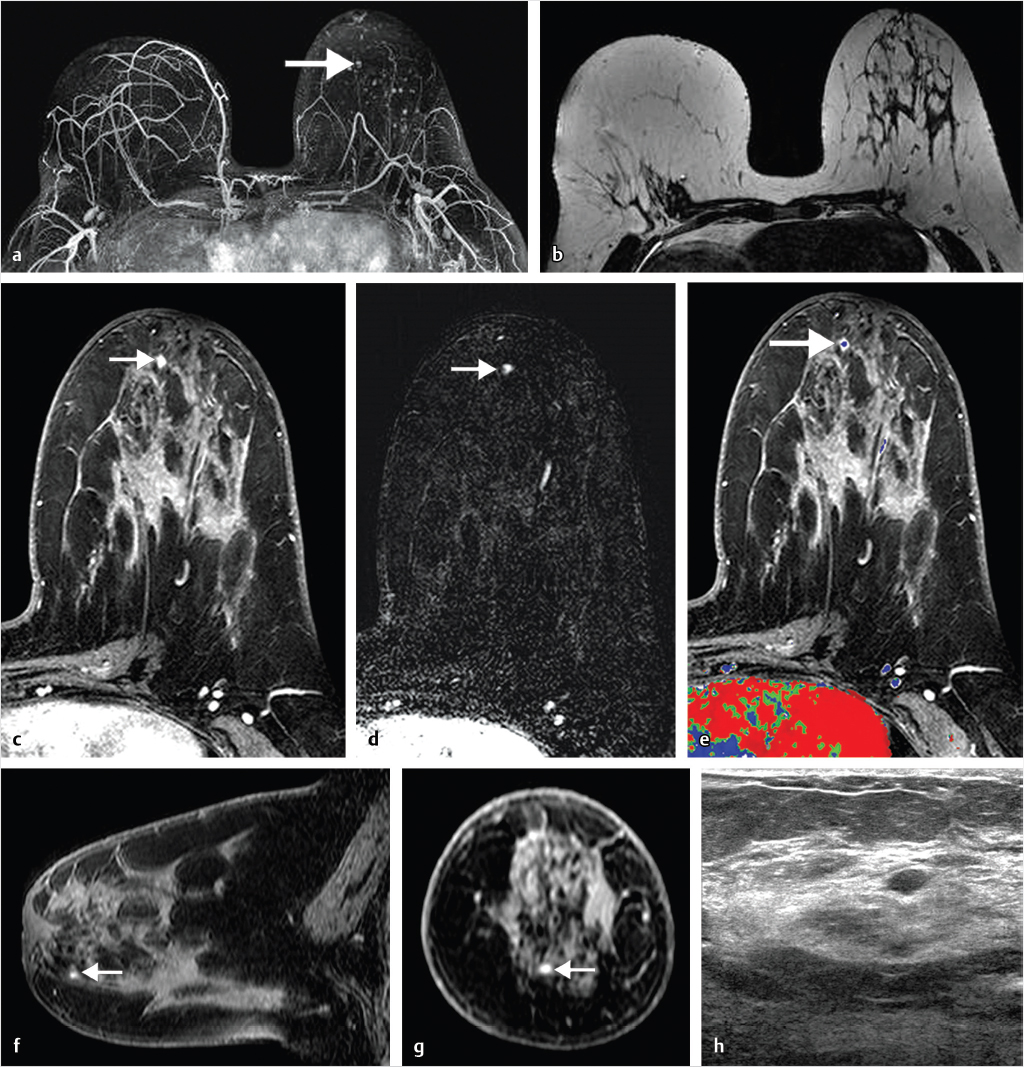
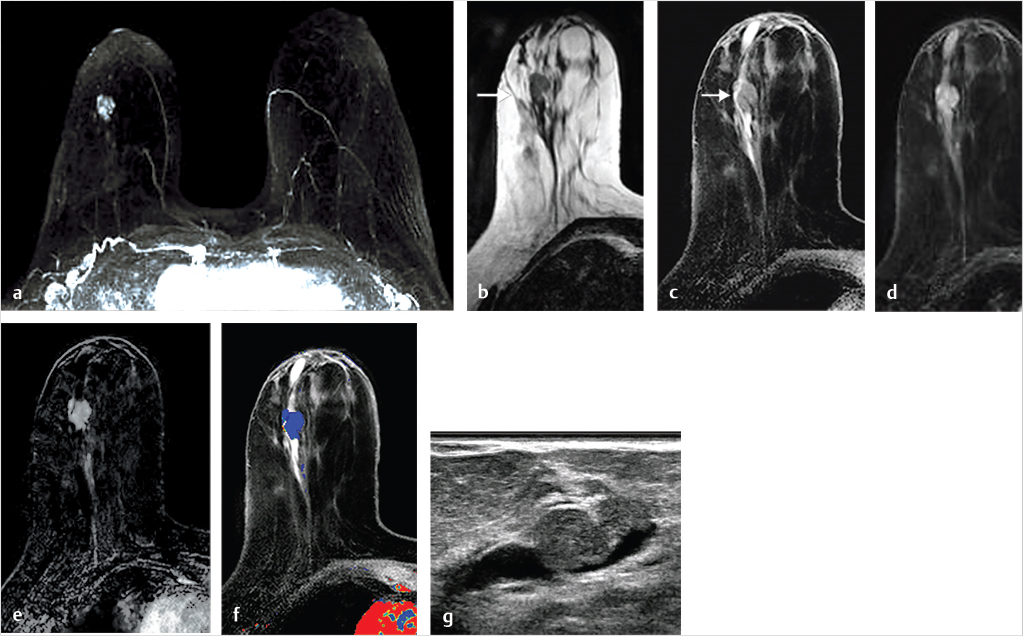
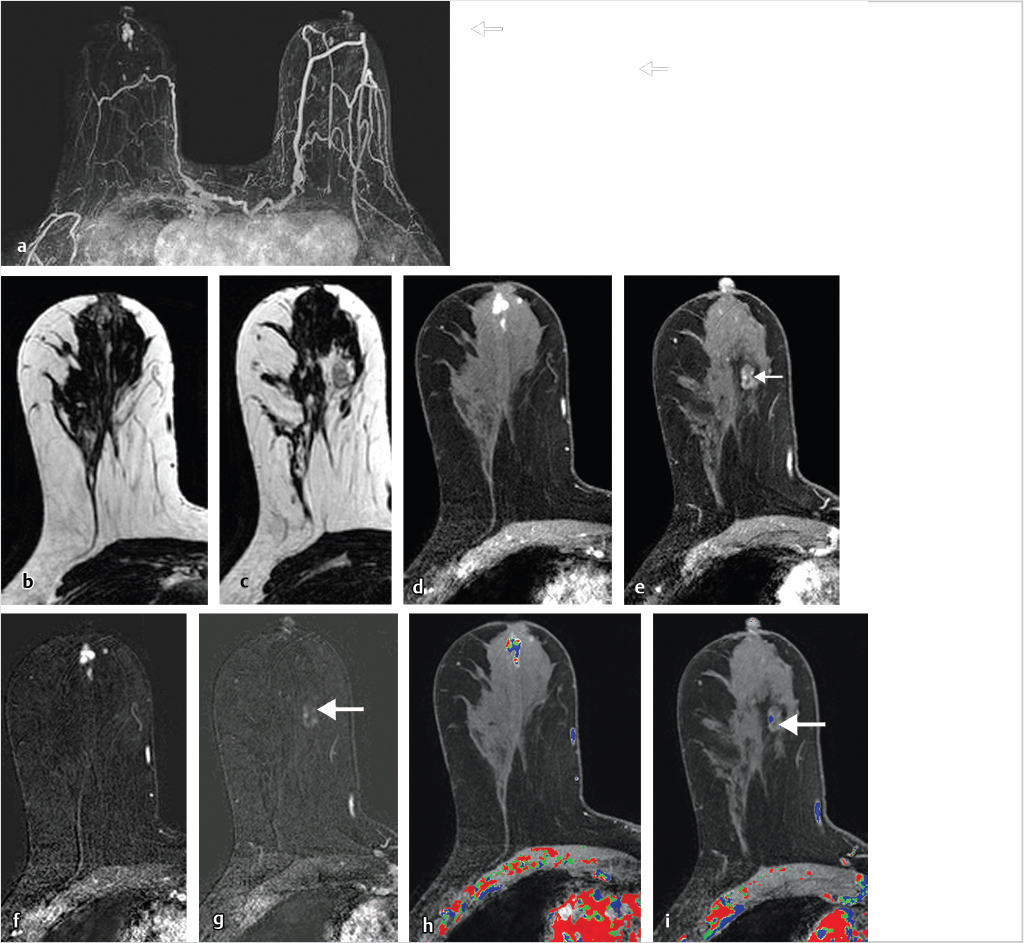
Sources of error in breast MR interpretation may be attributed to technical incidents such as equipment malfunction and artifacts, host-related issues such as marked BPE or motion, and human errors of perception or misinterpretation. As discussed in ▒Chapter 5░, breast MRI is technically demanding and requires excellent fat saturation and high spatial and temporal resolution with rapid acquisition of postcontrast sequences. Technical errors in clinical practice that commonly affect interpretation include poor positioning, inadequate contrast injection, and patient motion. Careful assessment of image quality by the technologist and radiologist in routine practice is necessary to avoid these errors. Perception failures at screening account for missed cancers and may be exacerbated by marked BPE, which may mask small malignancies (Fig. 6‑7; Fig. 6‑8; Fig. 6‑9; Fig. 6‑10). Appropriate scheduling of the MR examination according to the timing of the patient’s menstrual cycle can often alleviate this problem. Small cancers are often best identified on the first postcontrast subtracted series in a standard acquisition, or on an ultrafast sequence where BPE is minimal (Fig. 6‑11; Fig. 6‑12). Small or even large in situ cancers may be difficult to detect even in the presence of mild BPE; high spatial resolution at 3 T facilitates detection of such cancers (Fig. 6‑13; Fig. 6‑14). Benign findings that may cause difficulty in interpretation and affect specificity negatively include certain lymph nodes, papillomata, fat necrosis (Fig. 6‑15; Fig. 6‑16; Fig. 6‑17), and fibroadenomata (Fig. 6‑18; Fig. 6‑19, Fig. 6‑20). These lesions may exhibit rapid enhancement, often with washout kinetics, careful morphologic analysis being necessary for accurate diagnosis; isotropic or near isotropic, MPR can be useful in these cases.
6.4.1 Skin Enhancement
Skin enhancement may be seen at the site of recent percutaneous biopsy but may also reflect spread of malignancy to the dermis. Malignant skin involvement may be evident remote from the site of a newly diagnosed cancer or may directly involve the dermis. Cowden’s syndrome is a rare autosomal dominant inherited disorder characterized by diagnosis of multiple hamartomas and is associated with a predisposition for breast carcinoma. An example of a patient with Cowden’s syndrome and an aggressive inflammatory breast cancer (IBC) with direct skin involvement is shown in Fig. 6‑21.
6.4.2 Inflammatory Changes
Inflammation due to mastitis may be focal or diffuse. Detection of segmental NME is usually associated with ductal carcinoma in situ (DCIS); benign diagnoses with this finding and distribution are uncommon. An example of inflammatory changes presenting as segmental NME, mimicking DCIS, is shown in Fig. 6‑22.
6.5 Postsurgical Complications
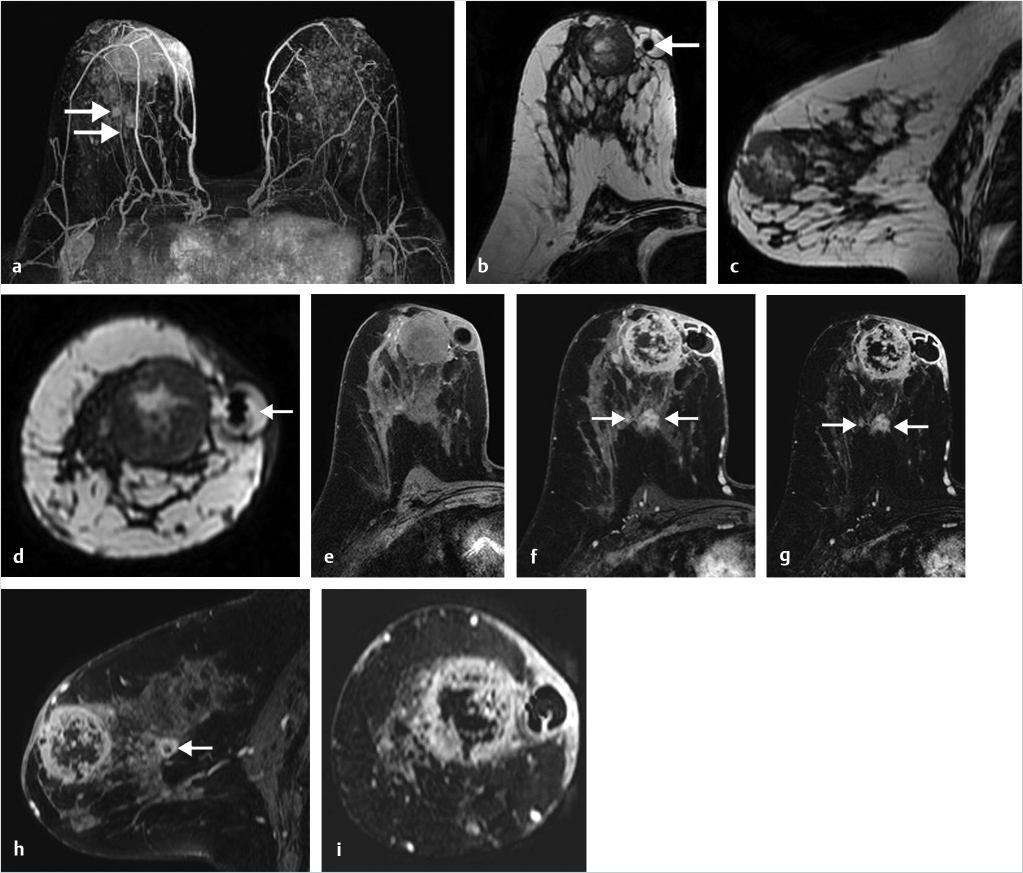
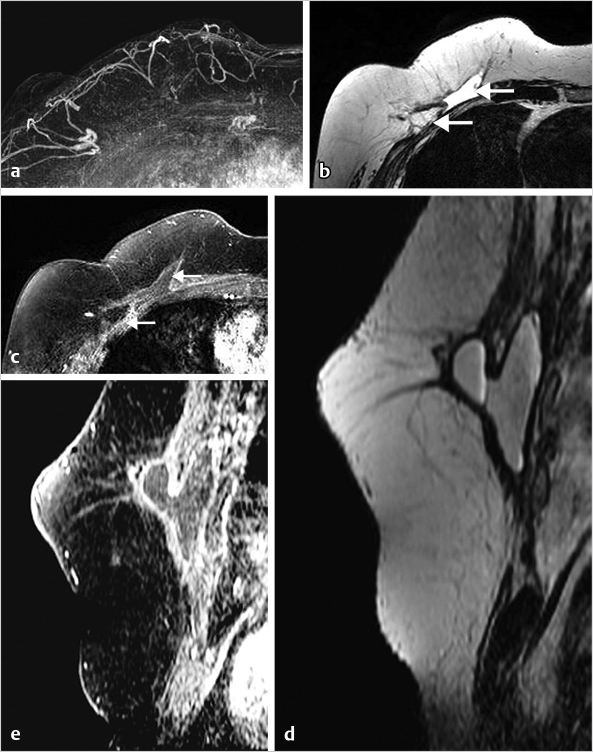
The T2w series is very helpful for evaluation of the posterior breast and chest wall, particularly when complications from implant augmentation or reconstructive surgery result. An example of postsurgical complications following expander placement for breast reconstruction is shown in Fig. 6‑23.
6.6 The Male Breast
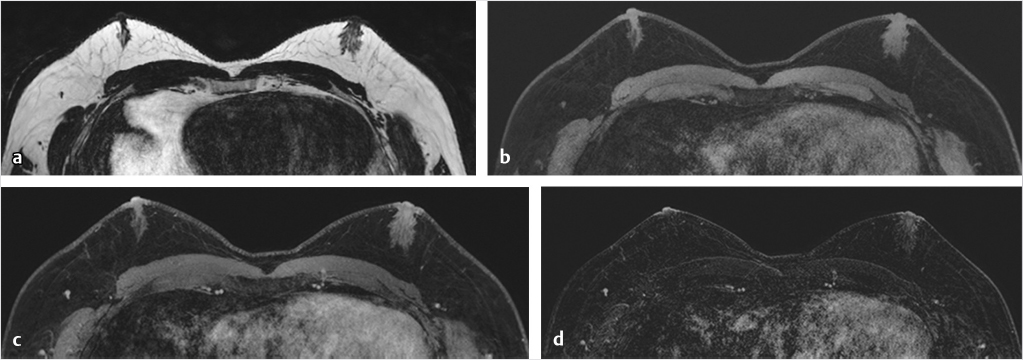
Breast cancer in men is rare, accounting for less than 1% of breast cancers. Physiological gynecomastia occurs in neonates and puberty, and with obesity and ageing. Gynecomastia can be caused by an increased estrogen to testosterone ratio in men treated with estrogen therapy for prostate cancer and by a variety of other medications. Mammography is usually the recommended test when men are referred for imaging. An example of gynecomastia on MRI is shown in Fig. 6‑24.
6.7 Nipple Enhancement
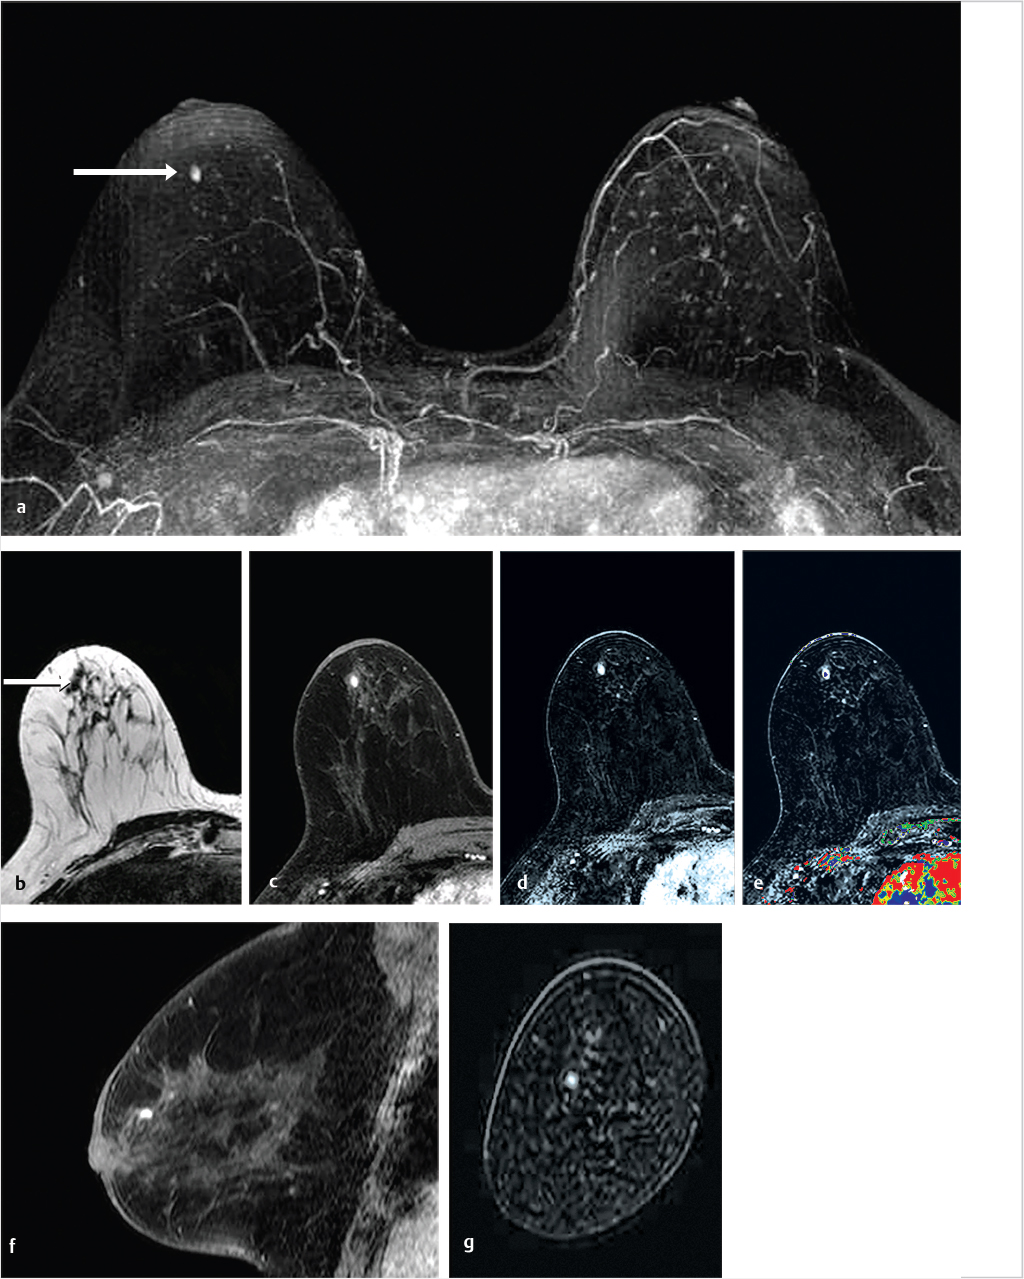
Normal nipple enhancement can mislead the reader because the nipple often enhances with varying intensity due to the rich blood supply of the nipple–areolar complex, and the enhancement may not necessarily be symmetric. The radiologist should be careful when the nipple is inverted because normal nipple enhancement may simulate a subareolar enhancing mass. Abnormal nipple enhancement is found in patients with Paget’s disease, IBC, lymphatic obstruction, and inflammation. An example of an epidermal inclusion cyst within the nipple is shown in Fig. 6‑25.
6.8 Breast Carcinoma in Augmented Breasts
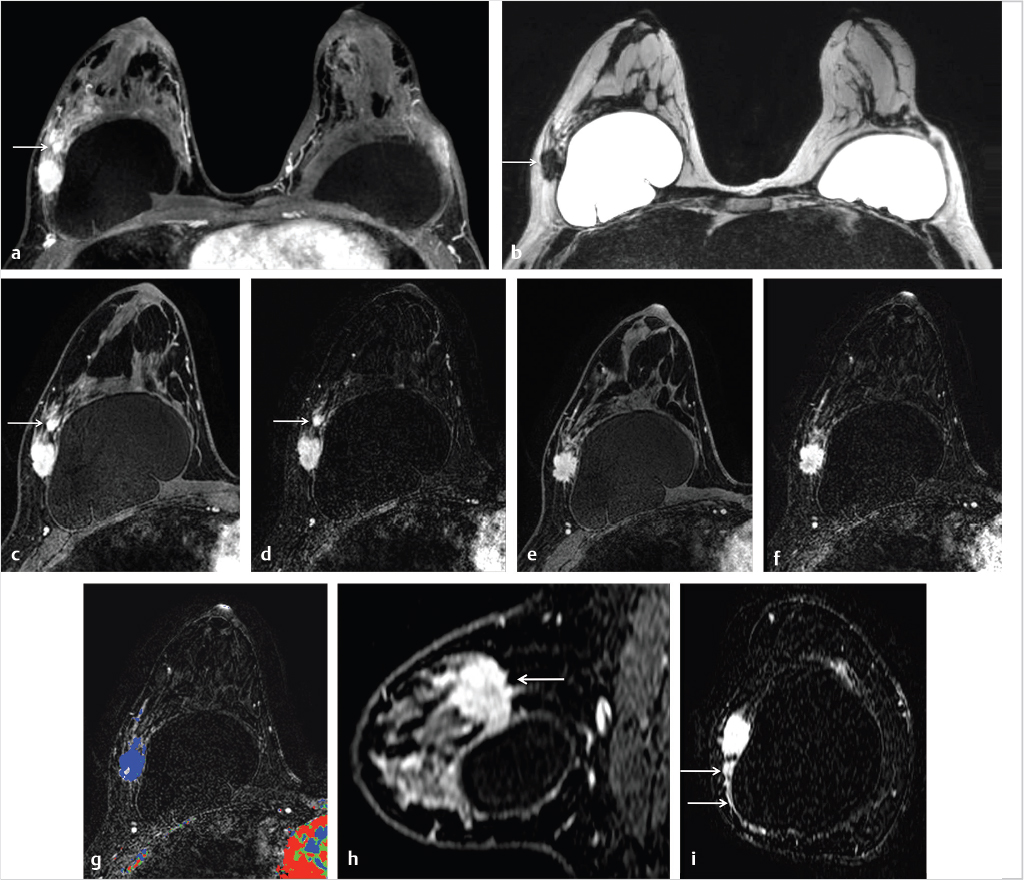
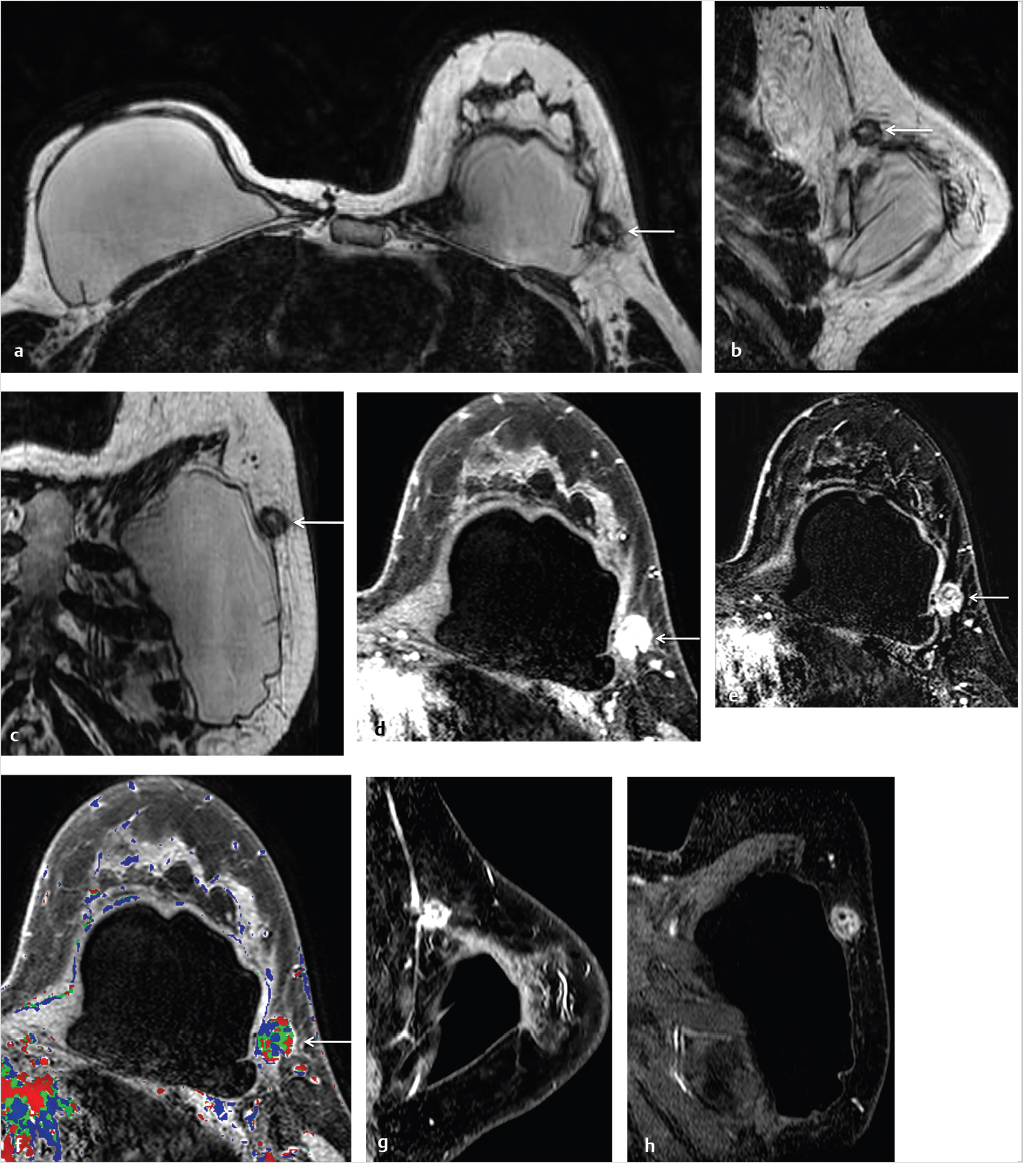
Breast implant surgery has been performed routinely for augmentation and reconstruction purposes for over 50 years, employing a large variety of devices including saline, silicone double-lumen types using both saline and silicone, and polyacrylamide gel. Contrast-enhanced MRI is necessary for cancer screening or diagnosis of suspected tumor. A causal relationship between malignancy and implant placement has not been found. 1 Breast carcinomas often contact the implant surface and tumors may spread along the contour of the implant. The use of MR MPR in such cases is particularly helpful for surgical planning. Examples of two patients with saline implants and associated malignancy are shown in Fig. 6‑26 and Fig. 6‑27.
Breast implant–associated anaplastic large cell lymphoma (BIA-ALCL) is a rare, distinct type of T cell lymphoma which develops around implants, causing pain and breast swelling and, less commonly, a palpable breast mass. 2 The underlying mechanism of this disease is thought to be due to chronic inflammatory change resulting from indolent infections, leading to malignant transformation of T cells that are anaplastic lymphoma kinase (ALK) negative and CD30 positive. Mean time to presentation is about 10 years following augmentation surgery and fluid is shown to develop around the implant. Immunohistochemistry confirms the diagnosis BIA-ALCL with CD30+ and ALK– expression. In most cases, surgical treatment is curative and includes capsulectomy and removal of the implant. When disease is more advanced, chemotherapy, radiotherapy, and lymph node dissection may be necessary.
6.9 Benign Papillary Lesions and Nipple Discharge
Papillary lesions of the breast represent a diverse group of lesions that share a common frond-like growth pattern with epithelium supported by a fibrovascular stroma. These breast lesions include benign papilloma, papillary DCIS, and invasive papillary carcinoma. Myoepithelial cells line the basement membrane in benign papillomata and papillary DCIS lesions, but are absent in invasive papillary carcinoma.
6.9.1 Solitary Intraductal Papillomata
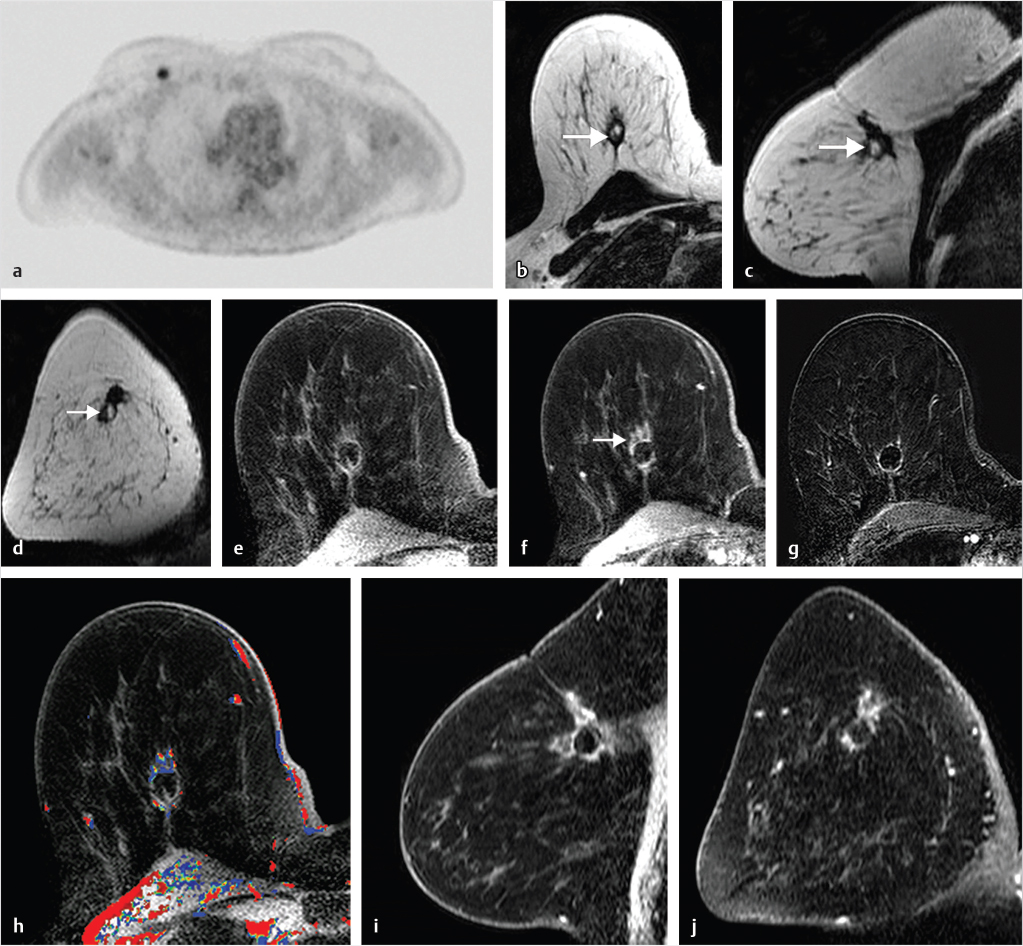
These lesions are usually identified centrally in the large lactiferous subareolar ducts and cause bloody or serous nipple discharge when symptomatic. They are often nonpalpable, ranging from 3 to 5 mm in size, and are frequently mammographically occult. 3 The dominant feature of large duct papilloma is that of a circumscribed mass with or without calcifications on mammography, and a circumscribed hypoechoic mass arising within an ectatic duct or a complex mass with increased blood flow on ultrasound. Papilloma may be associated with a dilated duct on both mammography and ultrasound. 4 MRI features similarly identify a circumscribed subareolar mass smaller than 1 cm, with rapid homogeneous enhancement and varied kinetics in the delayed phase. 5 , 6 Dilated ducts exhibiting high T2w and T1w signal caused by hemorrhage may be associated with a papilloma. 7 Although the morphologic characteristics of most papillomata suggest benignity, the kinetic finding of washout in the delayed phase is not uncommon and differentiation from malignancy may require tissue sampling in some cases. Management of large duct papilloma generally depends on whether atypia is associated with the histologic diagnosis. 7 , 8 , 9 A diagnosis of papilloma with atypia confers a much higher patient risk (7.5 times) than that of a papilloma without atypia. 10 In clinical practice, most papillomata diagnosed on core biopsy with a finding of associated atypia are excised. There are no consensus recommendations for the management of papilloma without atypia, and in many cases follow-up with clinical examination and imaging is recommended.
6.9.2 Multiple Intraductal Papillomata (Multiple Peripheral Papillomatosis)
These lesions are much less common, arise from the terminal ductal lobular unit, and are usually found in the periphery of the breast. Despite their different site of origin and multiplicity, the imaging findings on MRI are similar to those of solitary large duct papilloma. A hereditary condition known as juvenile papillomatosis, first described by Rosen in adolescents and young women, confers a slightly higher breast cancer risk, the imaging findings being similar to those of multiple intraductal papillomata. 11
6.9.3 Clinical Nipple Discharge
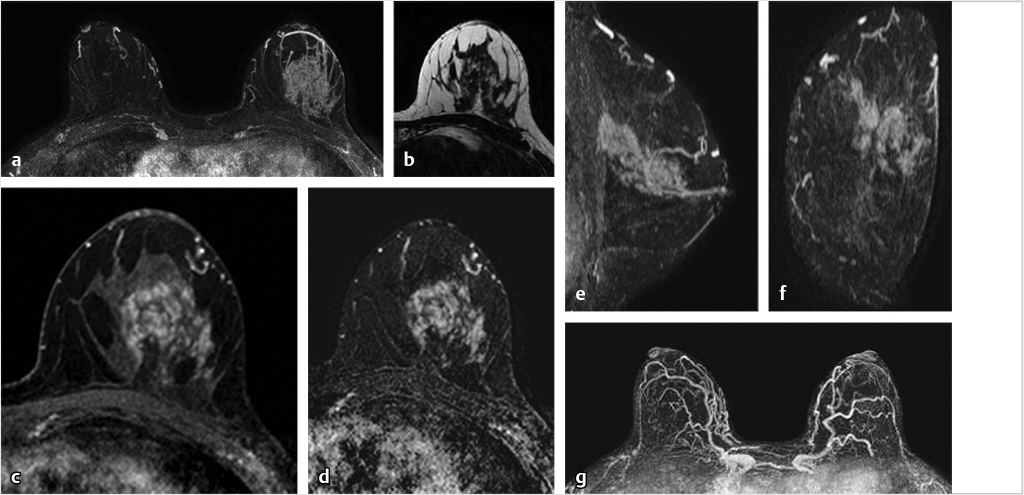
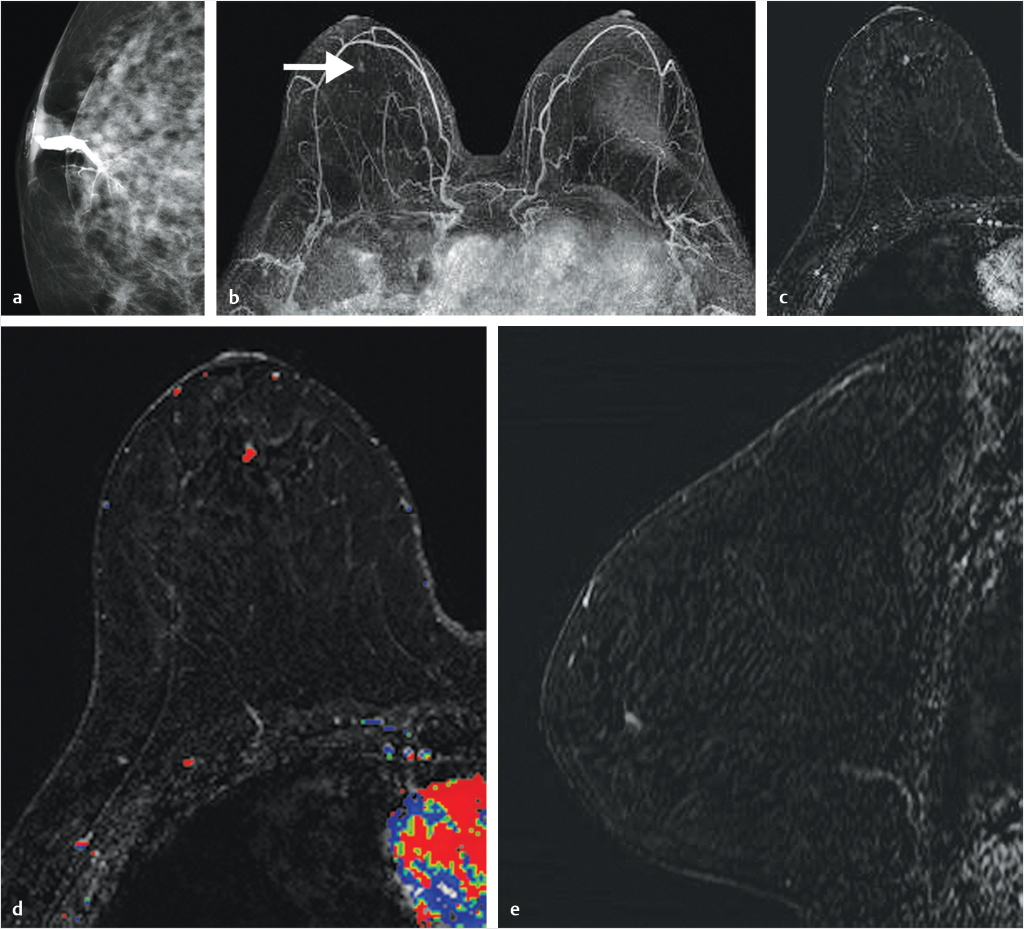
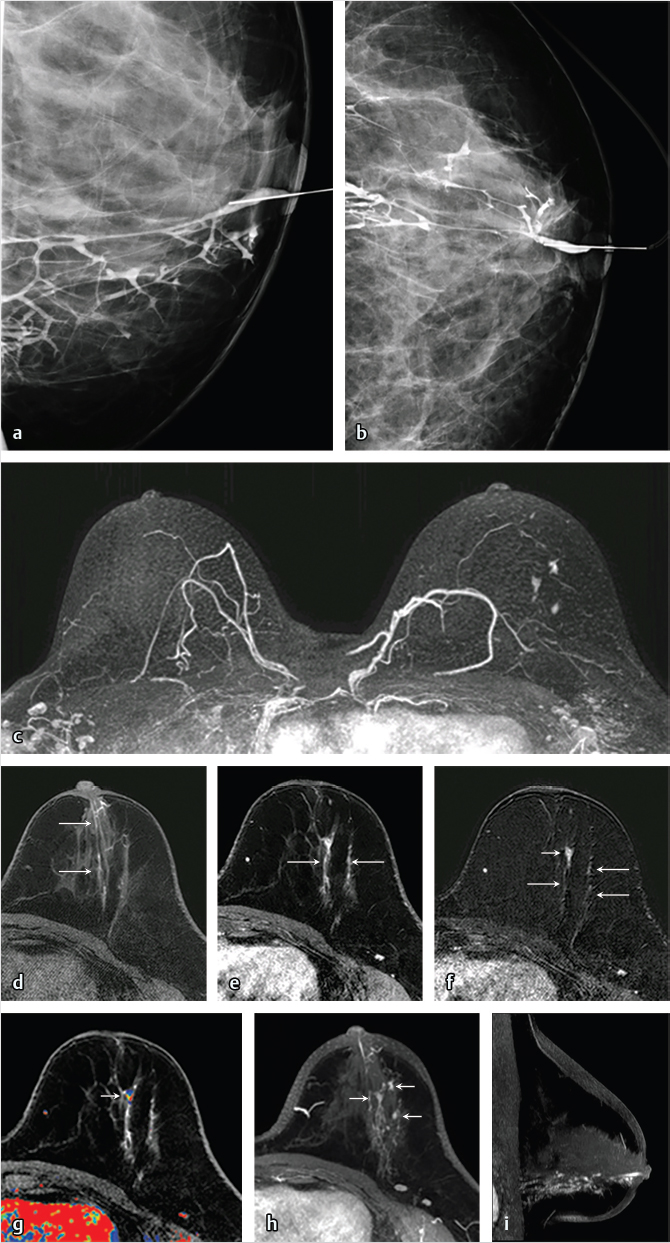
The standard-of-care imaging protocol for most women with spontaneous bloody or serous nipple discharge consists of imaging with mammography, ultrasound, and galactography. These studies identify the causative lesion in many, but not all cases, and the gold standard for treatment of patients with nipple discharge and negative imaging findings is surgery with large duct excision. 12 , 13 Most causes of nipple discharge are benign; a report on 586 patients who underwent surgery for significant nipple discharge stratified the breast pathology as follows: papilloma 48%, fibrocystic change 33%, cancer 14%, and high-risk lesions 7%. 14 Studies have shown that the performance of breast MRI is superior to that of galactography for detection and characterization of papillary lesions, 15 , 16 and radiologists increasingly use MRI for definitive assessment of women with nipple discharge (Fig. 6‑28; Fig. 6‑29). The increased use of MRI for this indication has come into play for two main reasons, both resulting in change of management. Firstly, the addition of MRI to the presurgical imaging protocol results in higher sensitivity than other standard imaging tests and may detect unsuspected malignant disease not associated with the known papilloma, thus affecting patient management (Fig. 6‑30). Secondly, absence of significant breast enhancement would likely preclude diagnosis of cancer given the high negative predictive value of MRI, and perhaps obviate the need for surgical duct excision, unless the discharge were to be too troublesome for the patient. Further clinical studies are needed; however, thought should be given to the management of women with nipple discharge now that we have a test with exquisite sensitivity and a very high negative predictive value. A reasonable consideration could be to allow a patient the choice of surgery or follow-up when MRI is negative.
Related posts:
Stay updated, free articles. Join our Telegram channel

Full access? Get Clinical Tree


