6 SPECT and SPECT/CT for the Respiratory System
6.1 Introduction
Since its first description by Wagner et al in 1964, 1 the planar lung scan has been one of the most commonly performed studies in nuclear medicine. While it can be used to investigate various respiratory disorders, its primary role is in the diagnosis and evaluation of pulmonary embolism (PE). However, planar ventilation-perfusion (V/Q) scanning, a two-dimensional technique, has well-recognized limitations, particularly related to overlap of anatomical segments. Embolic defects may not be detected if there is “shine-through” occurring from underlying lung segments with normal perfusion, thus resulting in an underestimation of the extent of perfusion loss. 2 Furthermore, the medial basal segment of the right lower lobe is often not visualized on planar scans. Assigning defects to specific lung segments on planar imaging is often difficult due to the variability in segment size and shape between patients. 3 Single-photon emission computed tomography (SPECT) overcomes this limitation through its ability to generate three-dimensional (3D) imaging data. V/Q SPECT is increasingly being used in many imaging centers and has been shown to have a higher sensitivity, specificity, and accuracy, as well as a lower indeterminate rate, than planar imaging. 4 Hybrid SPECT/computed tomography (CT) scanners can now perform combined V/Q SPECT with CT (generally using low-dose CT protocols) to further enhance diagnostic accuracy of V/Q SPECT. This chapter will summarize how V/Q SPECT and SPECT/CT are performed, outline strengths and weaknesses compared to planar lung scans and CT pulmonary angiography (CTPA), describe typical patterns, normal variants, and caveats relevant to image interpretation, and outline applications in areas other than the evaluation of PE.
6.2 Performing V/Q SPECT
As with planar imaging, the usual approach with SPECT is to perform a ventilation study followed by the perfusion study when technetium-99 m (99mTc)-based agents are used.
6.2.1 Ventilation
For ventilation imaging, several alternatives exist. 5 These include the following:
Inert radioactive gases such as krypton-81 m (81mKr) and xenon-133 (133Xe).
Radiolabeled aerosols, most commonly 99mTc-diethylenetriaminepentaacetic acid (99mTc-DTPA) but occasionally sulfur colloid or albumen.
Technegas (99mTc ultrafine carbon suspension) (Cyclopharm, Sydney, Australia).
Each has its advantages and disadvantages (► Table 6.1); however, most centers performing SPECT would use either Technegas (preferable, especially if underlying airways disease 6 )or 99mTc-DTPA aerosol. 81mKr is also an ideal ventilation agent for SPECT; however, it is expensive, requires continuous administration, it is no longer available in the United States, and its use is limited to some European centers. Although still used in the United States for planar imaging, 133Xe is unsuitable for SPECT due to its low-energy photons leading to poor resolution and high scatter.
6.2.2 Perfusion
99mTc-macroaggregated albumin (99mTc-MAA) is generally used to assess perfusion. 7
The dose of 99mTc-MAA used is dependent on the ventilation agent used.
If a radioactive gas is used, the dose of perfusion agent is typically lower than if a technetium-based ventilation agent is used as the signal from the radioactive gas can be separated from that of the perfusion agent based on the energy level of the emitted photons.
If a technetium-based agent is used for both ventilation and perfusion imaging, a greater dose of perfusion agent (resulting in a perfusion-ventilation dose ratio of at least 4:1) is required to “drown out” the underlying ventilation signal. 7
The administered activity of 99mTc-MAA is typically 2.5 to 6 mCi (100-250 MBq).5,7
For pregnant patients, dose reduction is usually implemented. This can be achieved by reducing the administered dose of both the ventilation and perfusion agents, usually by half. 8 This will necessitate a longer acquisition time to maintain images of good quality. Some centers advocate omitting the ventilation scan; however, the radiation savings from this approach are minimal, and diagnostic accuracy may be adversely impacted. 9 In centers performing SPECT/CT imaging, consideration can be given to omitting the CT scan to reduce breast radiation exposure.
6.2.3 Image Acquisition and Processing
Multihead gamma cameras (either dual or triple head) are required for SPECT imaging. 5 Acquisition times become prohibitive for standard clinical practice if a single-head camera is used.
A typical protocol that uses a multihead camera requires 15 to 25 minutes of total acquisition time for a V/Qdata set. 5 , 10 This is faster than traditional six- or eight-view planar imaging. 10 , 11
If V/Q can be performed simultaneously (e.g., when 81mKr is used for ventilation), the acquisition time is halved. 12
Representative acquisition and processing parameters are shown in ► Table 6.2. Note that if 81mKr is used for ventilation, a medium energy collimator is typically used.
SPECT/CT imaging is acquired on a hybrid SPECT/CT scanner.
While most hybrid scanners can perform diagnostic quality CT, they can also be operated solely for attenuation correction and anatomical localization using “low-dose” parameters. 13
For lung scanning, the CT acquisition is typically acquired immediately after the perfusion SPECT. Intravenous contrast is not required, and a reduced beam current of the order of 20 to 80 mA will suffice. 4 This results in an absorbed dose of the order of 1 to 2 mSv. 7 , 9 , 12 , 14 This compares favorably with the 2 to 2.5 mSv from the V/Q scan itself and is well below the levels received from a diagnostic CTPA. 9 , 15 , 16
Due to the duration of acquisition time for SPECT imaging, breath holding is not feasible, and these are therefore performed during free breathing. To better match the CT images to SPECT acquisitions, it has been suggested that they be performed using a mid inspiratory breath hold, or during shallow breathing, rather than at maximal inspiration. 17
The CT acquisition time is rapid (< 1 minute), and combined with the setup time, the procedure adds only 1 to 2 minutes to a V/QSPECT study.


6.2.4 Image Display and Reviewing
Image review should occur following coregistration of the V/QSPECT data sets (as well as the CT data sets in the case of SPECT/Cr).
Images are best viewed simultaneously in transverse, coronal, and sagittal planes on a workstation (► Fig. 6.3). This allows the reporter to interactively examine and triangulate the linked V/Q SPECT studies as well as the CT in each of the three orthogonal imaging planes and to adjust the relative image intensities, especially of fused images (► Fig. 6.4).
Review of images on a workstation also facilitates the viewing of CT data in different windows so that lungs, soft tissue, and bones can all be reviewed, as appropriate.
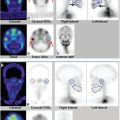
Segmental lung anatomy charts may be of help for reporting specialists, particularly for reporters who are inexperienced (► Fig. 6.5). 8
V/Q SPECT studies are usually reported using the European Association of Nuclear Medicine (EANM) reporting guidelines. These guidelines recommend that studies be reported as positive for PE if there is V/Q mismatch of at least one segment or two subsegments that conform to pulmonary vascular anatomy (► Table 6.3). 7 Probabilistic reporting (as used for planar scanning) is not recommended, and has not been validated, for V/Q SPECT. 11 , 18 While the EANM reporting guidelines do not specifically address hybrid imaging, these guidelines are also generally used to report V/ Q SPECT/CT studies. Indeed, the addition of the CT component is likely to help classify the V/Q SPECT pattern more appropriately. The CT will provide patient-specific anatomical information, including the lung and segment borders, fissures, and the location of major vessels, as well as the presence of parenchymal disease (► Fig. 6.6).
Further demonstration of V/Q abnormalities can be made by creating a quotient or ratio image. In these images, the ratio of counts is usually derived by the formula (q-v2),where V 1 are counts at time of ventilation acquisition and V2 decay corrected counts at time of perfusion acquisition. There are novel ways of displaying V:Q quotient data to assist image reporting. Palmer et al have described a technique where these images can be presented as either 3D surface-shaded images or as tomographic sections in each of the orthogonal planes. 19 These “quotient images” can be helpful in facilitating image reporting and are a useful way of demonstrating the location and extent of mismatched defects (► Fig. 6.7).
Planar-like images can be generated from SPECT data using several approaches. While Bailey et al have described a technique using reprojection, 20 many of the commercial vendors offer a simpler approach using an “angular summing” technique. 11 With this approach, images are generated by summing several consecutive projections from the SPECT acquisition. This can blur small defects as data are acquired over an arc; however, the images produced approximate true planar images (► Fig. 6.8). 21 These “pseudoplanar” images give a familiar and rapid view of the lungs for quick evaluation and may be of particular value during the transition phase from planar imaging to SPECT imaging. 8 As the images are generated from the SPECT data, no additional image acquisition time is required.


6.3 Clinical Indications
The main clinical roles of V/Q SPECT (and SPECT/CT) include the following:
Diagnosis of patients with suspected PE.
Monitoring of patients diagnosed with PE:
To assess for the development of interval PE.
To monitor defect reperfusion.
To quantify regional lung V/Q, for example, in patients undergoing (or being considered for) lung cancer reduction surgery or to assist in radiotherapy planning.

6.4 Accuracy
Based on pooled literature, V/Q SPECT has sensitivities ranging from 80 to 100% and specificities ranging from 93 to 100%. 4 , 7 , 18 Bajc et al, citing experience from more than 3,000 patients, quote negative predictive values for V/Q SPECT of 97 to 99%, sensitivities of 96 to 99%, and specificities of 91 to 98% for PE diagnosis. 7
V/Q SPECT imaging has also been consistently shown to have an indeterminate rate of less than 5%, typically in the 1 to 3% range. 5 , 7 , 10 , 22 , 23
6.5 Comparison with Planar Imaging
Studies comparing planar and SPECT lung scanning have consistently demonstrated the superiority of SPECT over planar imaging.
Animal studies done using dogs 24 and pigs 25 as well as studies using Monte Carlo simulation 26 have all shown a higher sensitivity for the detection of PE with SPECT compared with planar imaging.
In humans, Bajc et al found SPECT to be more sensitive than planar imaging (100 vs. 85%) in the detection of PE. 22 They showed that SPECT had less interobserver variation and better delineation of mismatched defects compared with planar imaging.
Collart et al demonstrated that SPECT was also more specific than planar imaging (96 vs. 78%) and had better reproducibility, both intraobserver (94 vs. 91%) and interobserver (88 vs. 79%). 27
In a study of 83 patients, Reinartz et al demonstrated that, compared with planar imaging, SPECT had a higher sensitivity (97 vs. 76%), specificity (91 vs. 85%), and accuracy (94 vs. 81%).” In this series, SPECT increased the detection of segmental defects by 13% and subsegmental defects by more than 80%.
Leblanc et al demonstrated that SPECT has a very high negative predictive value (98.5%) for PE. 10 Le Roux et al have shown that a negative V/Q SPECT based on EANM reporting criteria carries a 3-month thromboembolic event rate of less than 0.5%. 28
Multiple studies have demonstrated nondiagnostic rates of less than 5% for V/QSPECT. 10 , 22 , 23 This is much lower than that reported for planar imaging. In the landmark PIOPED study (which used 133Xe as the ventilation agent), the indeterminate rate was 39%. 29


In summary, published literature has consistently demonstrated that SPECT has a greater sensitivity and specificity, improved reproducibility, and a lower indeterminate rate than planar lung scintigraphy, and it has a high negative predictive value.
Related posts:
Stay updated, free articles. Join our Telegram channel

Full access? Get Clinical Tree


