Abstract
The focus of this chapter is to review the imaging characteristics of non-invasive cancer (ductal carcinoma in situ [DCIS]) and the MRI appearance of this lesion which often presents as non-mass enhancement. The increased sensitivity for MRI detection of DCIS in recent years, above and beyond the sensitivity of mammography, is likely due to improved spatial and temporal resolution made possible with use of modern higher field strength magnets and newer acquisition protocols. Reported MRI sensitivities for DCIS in the more recent literature are significantly higher than those of mammography and range from 79% to 97%. Ultrafast perfusion imaging is also able to detect non-mass enhancement (NME) reliably even at lower spatial resolution, with the advantage that absence of BPE in these 1-30 second images greatly improves lesion conspicuity. In this chapter we discuss not only the biology and the distinct molecular and genetic expression profiles of DCIS, but also the salient features of this diagnosis which can be challenging because NME is not generally seen on precontrast imaging and lacks a clear lesion interface and distinct margins. The focus on the imaging findings in this chapter is exemplified by 37 case examples of normal ducts, ductal pathology and DCIS. A discussion of MRI investigations of DCIS and the clinical management of patients with a DCIS diagnosis, is also included in this chapter.
7 Image Interpretation: Noninvasive Cancer
7.1 Background
Ductal carcinoma in situ (DCIS) has been known for many years as a “mammographic disease.” This diagnosis, rarely identified before the advent of mammographic screening, has increased dramatically over the years, with 63,410 new DCIS cases diagnosed in women in 2017 in the United States. The increasing rate of DCIS is strongly associated with a concurrent increase in rates of mammography screening and is similar to the increasing incidence of DCIS in other developed countries where breast screening programs are conducted. Early reports in the 1930s of a precursor lesion that could progress to invasion led to first use of the term carcinoma in situ. In the era before breast screening, most in situ lesions were detected clinically as a palpable mass, Paget’s disease, or nipple discharge. Incidence in the United States has increased sevenfold, from 1973 through the late 1990s, with the most rapid increase found among women older than 50 years. As of January 1, 2005, an estimated 500,000 women were living with a diagnosis of DCIS in the United States and this number is estimated to increase to more than one million women by 2020 assuming constant incidence and survival rates.
DCIS is defined as a preinvasive form of breast cancer whereby a clonal proliferation of malignant epithelial cells originating in the terminal ductal lobular unit (TDLU) remain confined to ducts and do not invade beyond the basement membrane into the surrounding breast tissue. Evidence suggests that approximately 30 to 50% of DCIS lesions will progress to invasion over time if left untreated. 1 , 2 The important question is, of course, whether advanced imaging can not only improve identification of DCIS but also select those lesions that are most likely to invade. DCIS is generally found as microcalcifications on mammography and nonmass enhancement (NME) on magnetic resonance imaging (MRI). Both methods exhibit morphologic and distribution characteristics, which reflect a spectrum of heterogeneous lesions with diverse histological, molecular, and genetic characteristics. MRI, although not as widely used clinically as mammography, is a functional imaging technique and has the highest sensitivity for DCIS of all imaging modalities. 3
7.2 Mammography
DCIS typically presents as a nonpalpable, 10- to 20-mm, calcified lesion detected at mammography, usually exhibiting calcifications in a grouped, linear, or segmental distribution. Calcifications with suspicious morphology on mammography include amorphous, course heterogeneous, fine pleomorphic, and fine linear or fine linear-branching subtypes. The typical fine linear malignant calcifications contained within lobules and ducts are probably caused by central necrosis occurring as a result of hypoxia, because blood supply by diffusion from extraductal vessels becomes inadequate due to rapid tumor growth. DCIS may involve multiple sites contained within the same ductal system separated by normal tissue (“skip lesions”), involving adjacent or even remote ductal systems which may occupy an entire breast lobe. 4 Although calcified necrotic tumor is a frequent mammographic presentation of DCIS, other findings such as mass, asymmetry (associated with fluid in the micropapillary subtype), or architectural distortion are seen in approximately 10 to 20% of cases.
7.3 Biology of Ductal Carcinoma In Situ
Noninvasive cancers comprise a heterogeneous group of lesions with variable histopathologic, biologic, and genetic features. Lesions that are heterogeneous in grade are assigned the highest grade; standard histologic assessment of DCIS typically involves assessment of both qualitative and quantitative features. Qualitative features include assessment of the architectural growth pattern, nuclear grade (high-, intermediate-, and low-grade cytologic features), and presence or absence of central necrosis. High-grade noninvasive lesions with high mitotic indices generally exhibit rapid growth rates and will almost invariably progress to invasion, whereas low-grade lesions may remain quiescent, never invade, and, if they do invade, will progress to low-grade invasive cancer. Tabar and colleagues have postulated that certain morphologic characteristics of calcifications represent a duct-forming invasive cancer rather than an in situ lesion and therefore patients with this type of presentation may require more aggressive treatment. Careful mammographic and pathologic evaluation with correlation of magnified mammographic imaging and large section histology specimens has informed this opinion. 5
Few studies have focused on risk factors for DCIS; however, it is generally agreed that the risk factors for in situ disease are the same as those for invasive breast cancer. These indicators include increasing age, family history of breast cancer, genetic predisposition, high mammographic density, late age at menopause, and nulliparity. The natural history of DCIS, and of breast cancer overall, is still poorly understood and it makes sense therefore to focus research efforts on this earliest stage of breast cancer in order to gain knowledge about its origins and the mechanisms responsible for progression from noninvasive to invasive disease. In order to achieve this goal, we must improve our understanding of the biology of DCIS and the key events responsible for its transition to invasion. Invasive tumors require a vascular supply for continued growth and depend on angiogenesis, which is the term describing the complex process leading to the formation of new blood vessels from a preexisting vascular network, and this is likely also true for DCIS lesions. 6 Neoangiogenesis in invasive cancer is mediated not only by vascular endothelial growth factor (VEGF), a potent angiogenic factor, but also by other angiogenic and antiangiogenic factors. Tumor angiogenesis is an independent prognostic factor in invasive cancer, and is correlated with VEGF, microvessel density (MVD), and contrast enhancement in breast MRI. It is reasonable therefore to expect that the kinetic behavior of DCIS enhancement would also reflect DCIS biology. Expression of VEGF has been found in approximately 85% of DCIS lesions. 7 Angiogenesis in preinvasive cancer may not necessarily be associated with the typical dense, leaky neovasculature seen with invasive cancers. Studies of the vascular distribution associated with DCIS have shown two patterns: (1) vascular cuffing forming a ring, wherein blood vessels pack densely around neoplastic ducts immediately underlying the basement membrane, 8 or (2) a more diffusely dispersed pattern with scattered permeating blood vessels located in the surrounding stroma. These patterns of microvasculature are reflected in the enhancement patterns at high-resolution MRI, presenting often as clustered ring or diffuse (heterogeneous/homogeneous) enhancement. The diffuse enhancement pattern is often associated with high histologic grade and necrosis.
7.3.1 Molecular Markers
Cancer is a genetic disease wherein malignant transformation is driven by changes in DNA. In the larger context of tumor biology, the molecular profiles of DCIS and invasive breast cancer are similar, supporting a common origin. The distinct molecular characteristics of DCIS mirror those of invasive breast cancer by tumor grade. 9 Molecular pathways are altered in DCIS, and characterization by DNA, RNA, and protein can not only elucidate the molecular pathways critical for cancer etiology but also identify disease subtypes that have the potential to correlate with prognosis and therapeutic prediction. Surprisingly, few differences on a genomic or gene-expression level exist between DCIS and invasive disease, and DCIS breast lesions are considered to be nonobligate precursors of invasive cancer. This general understanding has not resulted from tracking the natural history of this disease and following women with DCIS over time without treatment, but rather by acknowledgement of a large body of indirect evidence linking the precursor status of in situ disease to invasion. For example, considerable evidence points to the increased risk of invasive ductal carcinoma (IDC) recurrence at the resection site in women with prior DCIS diagnosis and treatment, and the frequent coexistence of invasive and noninvasive disease in the same lesion, sharing of many of the same molecular and genetic abnormalities in both. 10 , 11
Protein expression in DCIS is usually assessed via immunohistochemistry (IHC) obtained on tissue sections. Estrogen receptor (ER) status is a proven prognostic marker in breast cancer; its main clinical value is its ability to predict response to hormonal therapy. Most laboratories in the United States use IHC to determine ER and progesterone receptor (PR) results on primary breast carcinoma. Approximately 70 to 80% of DCIS lesions are ER-positive and are less likely to be associated with high nuclear grade, human epidermal growth factor (HER-2/neu) or p53 positivity, or a high proliferative rate (Ki-67). Only 20 to 30% of DCIS patients exhibit HER-2/neu overexpression 12 by measuring ErbB2 gene amplification, as assessed by IHC or fluorescence in situ hybridization (FISH). HER-2/neu-positive DCIS is more likely to be ER–, PR–, and have high nuclear grade. The proportion of HER-2/neu-positive DCIS is similar to IDC; however, the triple-negative phenotype (ER–, PR–, HER-2/neu-negative) is less common in DCIS. 13
7.3.2 Gene Expression Profiles
Microarray analysis, identifying specific gene expression profiles, yields prognostic and predictive information that may be useful for indicating the likelihood of response to therapy. In the past few years, there have been several commercially available prognostic gene expression profile assays developed for clinical breast cancer assessment, Oncotype DX and MammaPrint among them. These companies provide a commercial assay designed to assess tumor recurrence probability and have developed a prognostic indicator for DCIS, providing treatment decision support for patients with newly diagnosed breast cancer. The oncotype DX method utilizes quantitative reverse transcription-polymerase chain reaction to analyze the expression of 21 genes (16 cancer-related and 5 control genes) and to provide an estimated distant disease recurrence score ranging from 0 to 100. Further understanding of the genesis of aggressive forms of DCIS and how these lesions transform themselves and progress to invasion is needed before confident therapeutic management of women with this diagnosis can be determined.
7.4 MRI of Ductal Carcinoma In Situ
Reported MRI sensitivities for DCIS in the more recent literature are significantly higher than mammography and range from 79 to 97%. Optimal technique is a prerequisite for improved identification of NME, and when achieved, individual ducts are discernable and tumor is readily identified in both ducts and lobules. We know that DCIS exhibits heterogeneous findings on both mammography and MRI, with each modality exhibiting some features that are associated with lesion aggressiveness. The histologic classification of DCIS was initially based on metrics developed for IDC: invasive cancers classified as grade I, II, or III, and noninvasive cancers categorized as low, intermediate, or high grade based on nuclear features such as size and mitotic activity. Mixed histologic subtypes are found in more than one-half of DCIS cases. 14 DCIS, however, unlike IDC, exhibits singular architectural growth patterns that reflect cell distribution within the duct lumen; these patterns of tumor growth are often visualized on mammography as calcium distribution in ducts and lobules and on MRI as internal enhancement patterns of NME. The nuclear grading and histologic growth patterns of in situ lesions are classified as solid, papillary, micropapillary, cribriform, and presence or absence of necrosis. Studies have shown that imaging can reflect tumor biology, for example, fine linear/fine linear-branching patterns of calcifications at mammography show considerably worse survival outcome than amorphous or round calcifications, 15 and higher-grade in situ lesions at MRI exhibit increased contrast enhancement compared with low-grade DCIS. 3 , 8
Accurate diagnosis of DCIS may be challenging because NME is not generally seen on precontrast imaging and lacks a clear lesion interface and distinct margins. However, modern MRI methods obtained at higher spatial and temporal resolution show excellent visualization of involved ducts and lobules. 16 Typical signs include a distinctive nonmass morphology, clumped or clustered ring internal enhancement, in a segmental, linear, or regional distribution. Unlike mammography where the DCIS finding is often that of calcified necrotic tumor, MRI detects intermediate- and high-grade DCIS and associated foci of invasive cancer that is often occult at mammography and ultrasound.
7.4.1 Terminal Ductal Lobular Units and Ducts
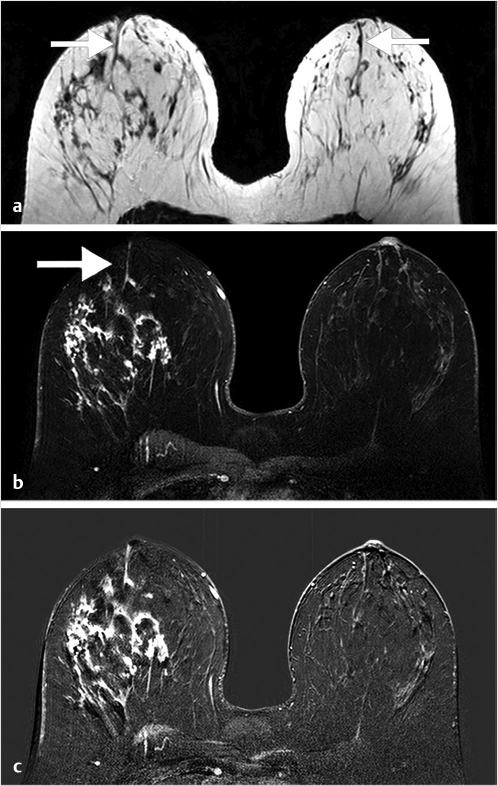
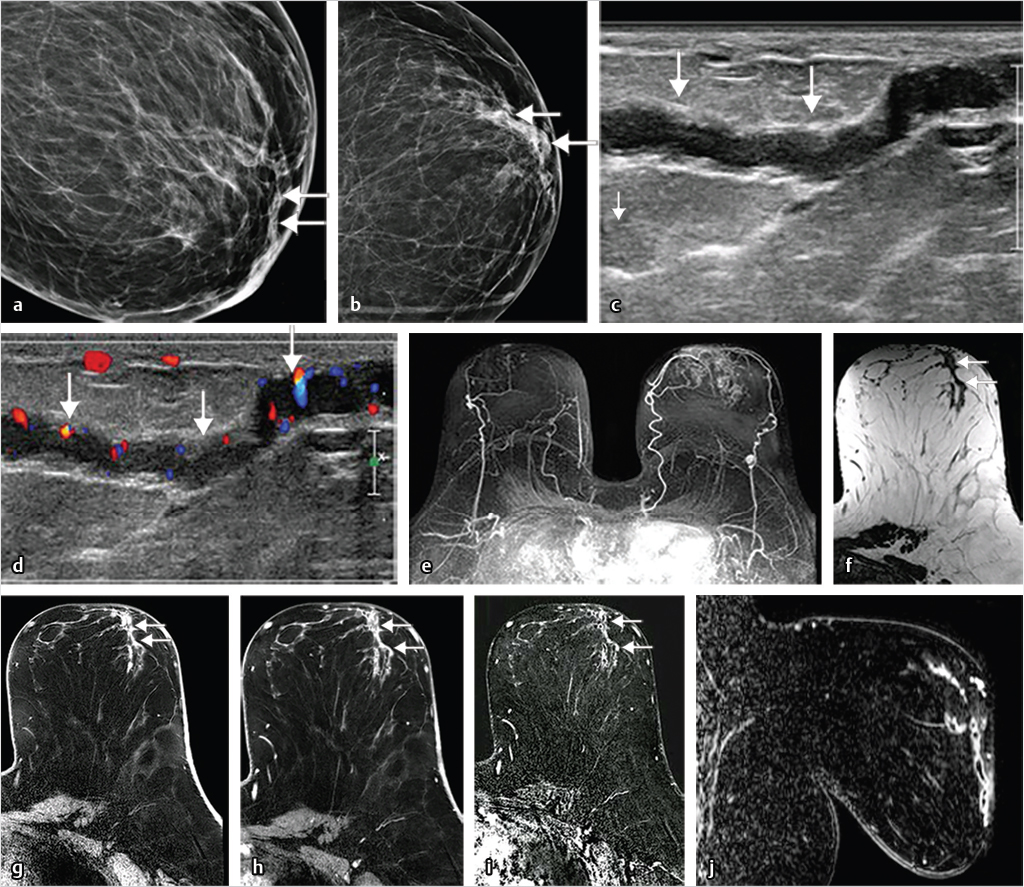
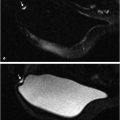
Normal TDLUs measure about 1 mm in diameter, enhance in varying degrees, and represent normal background parenchymal enhancement (BPE) on MRI. The entire TDLU complex including surrounding fat and fibrous tissue measures about 5 mm. High-resolution MRI can visualize normal (nonenhancing) central ducts measuring 0.1 mm in diameter, seen best in fatty breasts (Fig. 7‑1). Abnormal enhancing ducts containing DCIS (Fig. 7‑2) may be visible not only in the subareolar region but also with variable distribution throughout the affected breast; these diseased ducts enlarge up to about 1.0 mm in diameter and are visible in any type of FGT.

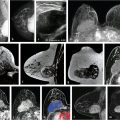
Benign, nonenhancing, dilated ducts are often identified in the subareolar region in women of all ages and may contain fluid or debris with signal intensities similar to water: hyperintense on T2-weighted (T2w) and hypointense on T1w series (Fig. 7‑3). Other ectatic ducts may contain proteinaceous or hemorrhagic intraductal material exhibiting variable signal on T2w and T1w series: the higher the protein content, the lower the signal intensity on T2w series and the higher the intensity on T1w series (Fig. 7‑4, Fig. 7‑5). Infrequently, benign ectatic ducts may become inflamed exhibiting duct wall and periductal enhancement separated by nonenhancing duct contents. These ducts can be differentiated from enhancing malignant ducts by their typical “tram-track” appearance on MRI (Fig. 7‑6 , Fig. 7‑7). Ducts with a linear enhancement distribution are clearly visible at high-resolution MRI and should be considered to be suspicious, whether visible centrally or elsewhere in the breast. This pattern of enhancement generally indicates a high-risk lesion, such as atypical duct hyperplasia (ADH) and lobular neoplasia, or DCIS. Examples of high-risk lesions are shown: pleomorphic LCIS (Fig. 7‑8), Fig. 7‑9, Fig. 7‑10), flat epithelial atypia (FEA) (Fig. 7‑11), and ADH (Fig. 7‑12). High-risk lesions exhibit MR findings which may be very similar in morphology and internal enhancement characteristics to DCIS lesions (Fig. 7‑13), with the exception that the enhancement is generally lower and detection is more difficult at lower field strength.


7.5 Morphology of Ductal Carcinoma In Situ
NME is described in the ACR Breast Imaging Reporting and Data System (BIRADS) MRI Lexicon 17 as enhancement that is not a mass or focus but is still discrete from normal, surrounding BPE. This definition includes enhancement patterns that may extend over small or large regions and may exhibit normal fibroglandular tissue or fat interspersed between the abnormally enhancing components. NME is characterized by its distribution and pattern of internal enhancement (Table 7‑1), and is the reported lesion type in the majority of DCIS cases. 18 , 19 Although any distribution pattern can be seen in DCIS lesions, segmental and linear enhancement is most commonly found. 10 , 19 , 20 The lexicon descriptors for NME are discussed below.
Distribution | a. Focal b. Linear c. Segmental d. Regional e. Multiple regions f. Diffuse |
Internal enhancement patterns | a. Homogeneous b. Heterogeneous c. Clumped d. Clustered ring |
Source: American College of Radiology. 17 | |
7.5.1 Distribution of Enhancement
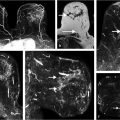
Focal enhancement is defined as a small, confined area whose internal enhancement may be characterized as a nonmass internal enhancement pattern, occupying less than a breast quadrant volume and may exhibit fat or normal glandular tissue interspersed between the abnormally enhancing components (Fig. 7‑14). Linear enhancement is arrayed in a line (not necessarily a straight line) or a line that branches (Fig. 7‑15). This distribution may elevate suspicion for malignancy as it suggests enhancement within or around a duct. Segmental enhancement is defined as triangular or cone shaped with the apex at the nipple, suggesting enhancement within or around a duct or ducts and their branches, thus increasing the likelihood of malignancy (Fig. 7‑16, Fig. 7‑17, Fig. 7‑18, Fig. 7‑19). Regional enhancement encompasses more than a single duct system and is used for enhancement that occupies a large portion of breast tissue, at a minimum 25% of a quadrant. This distribution pattern can be seen in invasive cancers such as lobular or HER2-enriched lesions in addition to DCIS lesions, bearing in mind that lack of orientation toward the nipple might suggest an invasive process (Fig. 7‑20). Enhancement of multiple regions, by definition, does not conform to a segmental distribution and is seen in at least two large volumes of tissue (Fig. 7‑21). Diffuse categorization is defined as enhancement being distributed randomly throughout the breast (Fig. 7‑22).


Related posts:
Stay updated, free articles. Join our Telegram channel

Full access? Get Clinical Tree


