9 Diffusion Tensor Imaging
9.1 Introduction
In Chapter 8, isotropic diffusion and the related diffusion weighted-imaging (DWI) were described. This chapter introduces a special case of DWI, diffusion tensor imaging (DTI) and other diffusion magnetic resonance imaging (MRI)-derived methods that are sensitive to anisotropic diffusion. The chapter also discusses the theory of DTI and other diffusion MRI-derived methods for anisotropy modeling and their application in the human brain. Chapters 10 and 11 discuss the application of DTI in surgical planning.
The human brain forms a complex network of billions of neurons. The rapid increase in knowledge about the human brain anatomy, physiology, and pathologies was originally based primarily on invasive animal or postmortem human studies. With the development of MRI, the first tool to gain noninvasive insights into the human brain was introduced. Initially, this technique proved to be valuable for assessing the macroscopic structure of brain regions and their pathologies (e.g., by identifying volumetric abnormalities of white matter [WM] or gray matter [GM] tissue).
Nevertheless, conventional MRI does not allow inferences to be made about the microstructural organization of tissue. WM and GM are depicted as largely homogeneous regions, with no means of identifying, for example, single-fiber strands and axonal connectivity patterns, well known from invasive animal and human postmortem studies.
The development of DWI changed this dramatically. DWI is a technique that enables the noninvasive probing of molecular diffusion processes and has found a wide range of applications in material sciences and medicine. Since its introduction in 1985, DWI has developed rapidly and enables insights into the anatomical and physiological properties of human tissue on a microscopic scale that cannot be obtained with other imaging techniques. The first medical applications of DWI focused on the management of acute stroke patients by analyzing the measured diffusivity maps. Over the last 10 to 15 years technical and methodological advances in DWI—such as DTI, diffusion spectrum imaging (DSI), and high angular resolution diffusion imaging (HARDI)—shifted the focus of research toward the analysis of WM structures, its disorders, and the mapping of the human connectome using fiber tractography.
Fiber tractography on the basis of DWI enables the three-dimensional (3D) reconstruction of the major WM pathways connecting the different regions of the cortex and thus a tract-specific analysis of tissue properties reflected in the DWI signal. It proved to be of great value in the identification of specific fiber bundles in vivo, tract-specific analysis (tractometry) and diagnosis of neurodegenerative diseases and neurolog disorders, development and aging studies, as well as surgical planning.1,2,3,4,5,6 Besides these applications for visualization, quantifying, and analyzing the WM tracts themselves, tractography is also used for automatically subdividing the cortex into areas with similar connectivity patterns. Such GM parcellations have shown to be in good agreement with histology and functional MRI (fMRI).7
Because fiber tractography builds on a series of other processing steps, adding multiple layers of abstract modeling, simplification, and accumulated errors to the desired information about WM fibers, it comes with a number of limitations and issues to be considered. The quality of a tractogram depends on three main factors:
The acquisition parameters and quality of the raw diffusion-weighted data
The voxel-wise mathematical modeling of diffusion of the raw data
The actual tractography method itself
Fiber tractography is very sensitive to image quality and acquisition parameters. Depending on the method used, a single distorted voxel can compromise the complete fiber, causing it to end prematurely or leading it astray.8 Also, the choice of imaging parameters—such as the number of acquired diffusion directions, the strength of the applied diffusion weighting, and the voxel size—can introduce considerable changes in the final tractogram. Another limitation directly arises from the fact that many fiber tractography algorithms assume a correlation of the principal diffusion directions of water molecules, usually represented by a mathematical model, and the principal fiber direction in the corresponding image voxel.3,9 This assumption is valid only for certain fiber configurations and can cause a considerable number of false-positive or false-negative fibers in the final tractography result. Additionally, DWI does not provide information about the position of the neuronal synapses, which is necessary for a correct determination of fiber origins and terminations, or about the distinction between afferent and efferent axonal pathways.7 Besides relying on the accuracy and validity of the preceding processing steps, fiber tractography shows a high degree of variability across different algorithms and subjects. This is owed to the different assumptions the methods are based on as well as their sometimes complex parametrization. Many studies also observed that WM boundaries are commonly underestimated by most of the tractography methods currently available.6,10
Over the last couple of years a substantial effort was made to alleviate these issues on all levels, including studies for optimal acquisition sequences,11,12,13 novel preprocessing and diffusion modeling techniques,14,15 as well as a wide variation of fiber tractography methods,16 ranging from local deterministic approaches through probabilistic methods to global tractography. As these novel ideas and methods were being introduced, a number of new questions became increasingly important:
Which of the methods is the best? Is there a single best method for all the tasks at hand? What does “being the best“ mean in the context of tractography?
In short, how can fiber tractography be evaluated? Although these questions cannot be answered to a full extent, the current chapter aims to explain the pros and cons of different methods and describe ways and means to evaluate a complete DTI pipeline before application of the results in a patient setting (Chapters 10 and 11). This chapter discusses commonly used methods for DWI-derived signal modeling and fiber-tracking methods.
9.2 Diffusion-Weighted Imaging
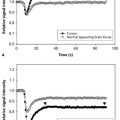
In theory, every conventional MRI sequence can be sensitized for diffusion with additional strong magnetic field gradients. The basic principle of DWI is that particles moving around in a magnetic field gradient store the history of their movement as an accumulated phase gained at the different positions. Stejskal and Tanner17 presented a DWI sequence based on a pulsed field gradient spin-echo (PFGSE). This sequence applies a strong diffusion-encoding gradient pulse of amplitude and direction G before the application of the 180-degree pulse. Particles at different positions along this direction will accumulate a different phase Φ1{{\Phi }}_{1} during the gradient application time δ. Here we are assuming that δ is short enough to render diffusion taking place during the application of the gradient pulse insignificant (narrow pulse approximation). After the 180-degree pulse, the diffusion encoding gradient pulse is applied a second time, resulting in a second phase shift Φ2{{\Phi }}_{2} (Fig. 9.1).

For all stationary particles, the resulting net phase shift amounts to Φ1-Φ2=Φ1-Φ1=0{{\Phi }}_{1}-{{\Phi }}_{2}={{\Phi }}_{1}-{{\Phi }}_{1}=0. The minus sign is a result of the 180 degree echo pulse. Particles that displace during the time ∆ gain different phases during the first and second gradient pulse. This results in a net phase shift Φdiff=Φ1-Φ2≠0{{\Phi }}_{diff}={{\Phi }}_{1}-{{\Phi }}_{2}\ne 0. Because randomly diffusing spins accumulate different phase shifts Φdiff {{\Phi }}_{diff} the signal measured when particles are diffusing along the direction of the gradient will be attenuated compared to a reference measurement S0{S}_{0}, acquired without the application of the gradient. The signal attenuation due to diffusion processes is usually expressed as follows:
with q=γGδ\mathbit{q}=\gamma \mathbit{G}\delta . One measurement E(q)E\left(\mathbit{q}\right) can be envisioned as one point in a three-dimensional (3D) space, further on denoted as q-space. By rewriting the net phase shift of a spin as Φdiff=-q(x1-x2){{\Phi }}_{diff}=-\mathbit{q}\left({x}_{1}-{x}_{2}\right) with the spin‘s start and end locations x1{x}_{1} and x2{x}_{2}, the signal attenuation is described as follows:
where ρ(x1) \rho \left({x}_{1}\right) is the spin density at location x1{x}_{1} and P(x1,x2,Δ) P\left({x}_{1},{x}_{2},{\Delta }\right) the diffusion propagator. In case of a Gaussian diffusion propagator, Equation 9.2 can be written as follows:
The factor b=q2Δ-δ3b={\mathbit{q}}^{2}\left({\Delta }-{\delta \over{3}}\right), first introduced by Bihan and Breton,18 is called b-value and characterizes the strength of the diffusion weighting. Equation 9.3 can be easily rearranged to calculate DD. Because the diffusion coefficient of a fluid is constant, but the measured value varies depending on q and the tissue architecture, DD is denoted as the apparent diffusion coefficient (ADC). If the shape of the diffusion propagator is not known a priori, one can either fit mathematical models that assume certain properties of the propagator to the measured data or one can directly estimate the so-called ensemble average propagator (EAP) from the q-space data. Using the net displacement variable =x2-x1={x}_{2}-{x}_{1}, the EAP is defined as follows:
with Equation 9.4, Equation 9.2 can be simplified:
Related posts:
 7 Perfusion Imaging: Perfusion CT
 6 Perfusion Imaging: Arterial Spin Labeling
 1 Conventional Morphological Imaging: MRI Remains the Workhorse
 15 Image-Guided Neurosurgery: Intraoperative MRI
 18 On the Horizon: Going Beyond Conventional MR Contrast Agents
 13 It’s Not Just the Tumor: Treatment Effects
Stay updated, free articles. Join our Telegram channel

Full access? Get Clinical Tree


