Anju Sahdev, Rodney H. Reznek
Adrenal Imaging
The Adrenal Glands
With the increasing use of cross-sectional imaging, adrenal lesions are frequently identified in routine practice and are seen in up to 5% of abdominal CTs.1 Pathognomonic imaging features have been established for many of these lesions, including myelolipomas, adenomas, haematomas and cysts. Most adrenal lesions are benign. However as the adrenal gland is also a frequent site for metastastic disease, distinguishing between benign and malignant masses on imaging in patients with primary cancers elsewhere is essential. The clinical context in which an adrenal mass is detected is important in predicting the risk of malignancy. Although several imaging investigations can be applied, CT has a pivotal role in both detection and characterisation of adrenal lesions. In functioning adrenal disease, clinical and biochemical findings should direct the radiologist to the correct interpretation and diagnosis. This chapter looks at adrenal anatomy, physiology, the characteristic imaging features of common adrenal lesions, the application of modern imaging techniques in evaluating an incidental adrenal mass and functioning and non-functioning adrenal disease.
Anatomy and Physiology
Anatomy
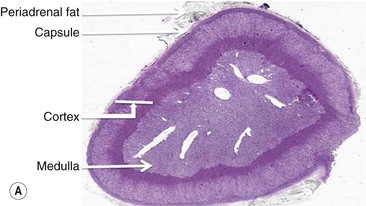
The adrenal gland is a composite gland made up of two neuroendocrine organs, the adrenal cortex of mesodermal orgin and adrenal medulla of neuroectodermal origin. Modern imaging techniques cannot distinguish between cortex and medulla as separate zones.
Each gland is found in the suprarenal fossa, the left gland is crescentic and right gland is pyramidal in adults. Although variable, the approximate size of each gland is 5 × 3 × 1 cm and weighs between 4 and 6 g each. Prolonged stress, however, can induce hypertrophy and hyperplasia, increasing both size and weight. The adrenal arterial supply comes from the adrenal arteries arising directly from the abdominal aorta or from the inferior phrenic and renal arteries. The shorter right adrenal vein drains directly to the inferior vena cava whilst the longer left adrenal vein may drain to the renal vein or IVC. Lymphatic channels are only present in the capsule and not within the glands.
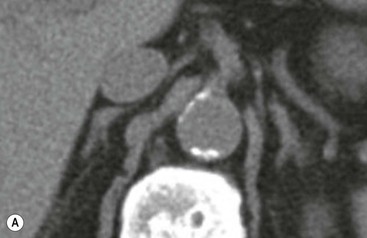
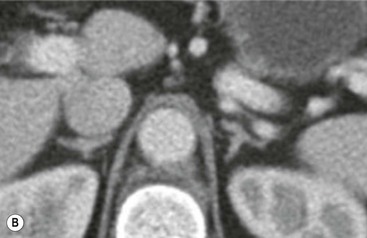
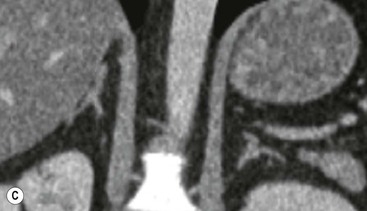
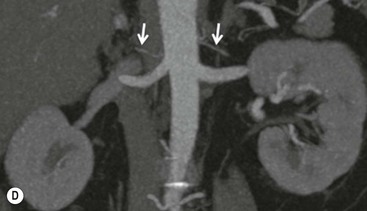
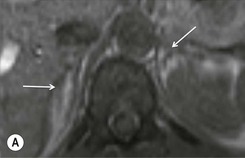
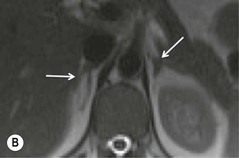
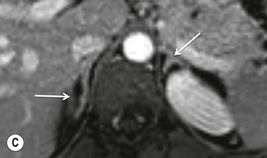
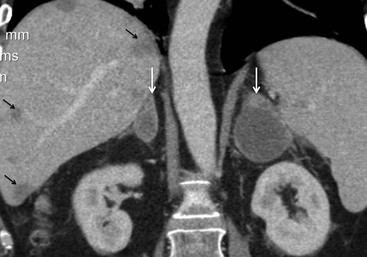
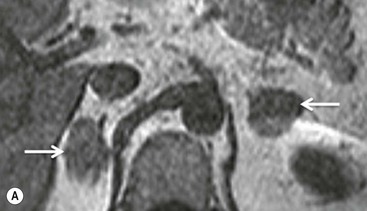
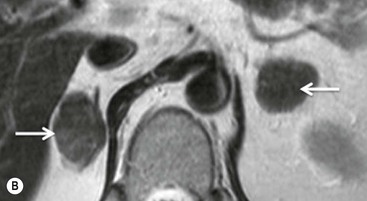
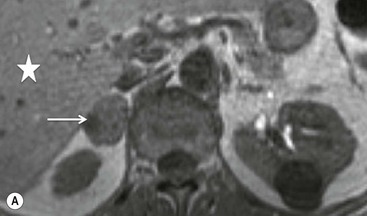
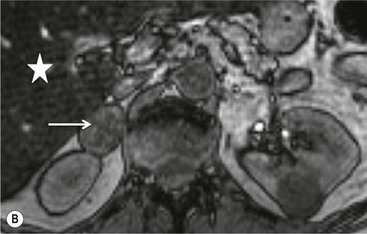
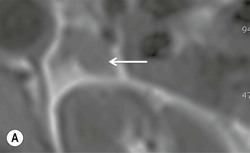
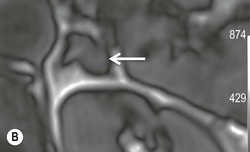
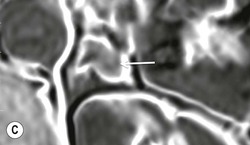
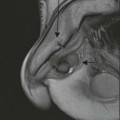
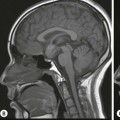
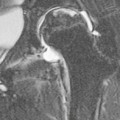
The ideal imaging parameters for imaging the adrenal glands on CT and MRI are summarised in Tables 44-1 and 44-2. On cross-sectional imaging, both adrenal glands can be divided into a body, medial and lateral limbs. The right adrenal body should not exceed 8 mm and the left adrenal body should not exceed 10 mm in maximum dimension. The maximum normal adrenal limb thickness is 5 mm. The normal adrenal demonstrates uniform contrast enhancement on arterial and venous phase CT and the cortex cannot be distinguished from the medulla (Fig. 44-1). On MRI, both glands have a uniform intermediate T1 and a low-to-intermediate T2 signal intensity and are better demonstrated on T1 fat-saturated images as nulling the signal from surrounding retroperitoneal fat augments the adrenal signal (Fig. 44-2).
TABLE 44-1
CT Parameters for Imaging the Adrenals
| Slice Thickness (mm) | Plane | |
| Unenhanced | 3–5 | Axial |
| 60 s post-contrast | 1–3 | Axial and coronal |
| 15 min post-contrast | 1–3 | Axial and coronal |
TABLE 44-2
MRI Parameters for Imaging the Adrenal Glands
| Weighting | Plane | Slice Thickness (mm)/Gap (mm) |
| Standard Sequences | ||
| T1 | Axial | 3–5/3 |
| T2 | Axial and coronal | 3–5/3 |
| CSI (in- and out-phase) | Axial | 3–5 |
| T1 fat sat | Axial | 5–7/3 |
| Optional Sequences | ||
| T1 fat sat with gadolinium | Axial and coronal | 5–7/3 |
| DWI (b = 0, 250, 500, 1000, 1200) | Axial | 3–5 |
Physiology
The adrenal cortex synthesises and secretes corticosteroids which include mineralocorticoids, glucocorticoids and sex hormones, all derived from cholesterol (Fig. 44-3).
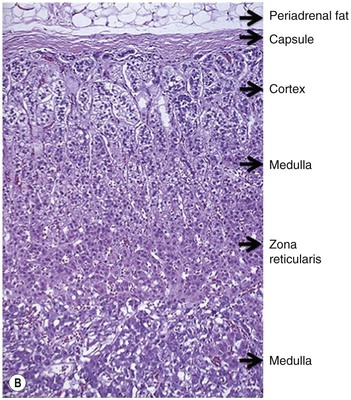
The outer zona glomerulosa produces aldosterone and other mineralocorticoids and is chiefly under the control of angiotensin II.
The central broad zona fasciculata and zona reticularis are influenced primarily by ACTH and produce glucocorticoids and some androgens and oestrogens, respectively. The main glucocorticoid is cortisol and it has an important role in carbohydrate, fat and protein metabolism.
The adrenal medulla contains the chromaffin cells producing catecholamines (noradrenaline and adrenaline) and is the major source of noradrenaline (in addition to the organ of Zuckerkandl located at the aortic bifurcation). The medulla synthesises and secretes the catecholamines in response to signals from preganglionic nerve fibres in the sympathetic nervous system.
Incidentally Detected Adrenal Mass
Incidentally detected adrenal masses in patients with no known malignancy occur in 5% of all abdominal CT examinations.1–3 These masses are usually benign, but when detected they often present a diagnostic dilemma and require clinical evaluation to exclude endocrine disease, primary adrenal cancer and metastases from other malignancies. The important questions to answer before a suitable management plan can be made are to determine if the lesion is functioning or non-functioning and if it is benign or malignant. Function is clinically and biochemically established, whilst benign adrenal masses such as lipid-rich adenomas, myelolipomas, adrenal cysts and adrenal haemorrhage have pathognomonic cross-sectional imaging appearances, as discussed below.
Adrenal adenomas are more common in some inherited diseases, including multiple endocrine neoplasia type I, Beckwith–Weidmann syndrome and the Carney complex. The likelihood of developing an adenoma increases with age. Based on pathological studies, about 6% of the population over 60 years of age harbour an adrenal adenoma.4 Of these, 80% are benign non-functioning adenomas. Adrenal masses are also frequently discovered during imaging performed for staging of patients with cancer. The prevalence of adrenal masses increases to 9–13% in patients with a known underlying malignancy.1,2 The adrenal gland is a relatively frequent site for metastatic disease but even in patients with a known carcinoma, only 26–36% of adrenal masses are metastatic.5 This incidence of metastatic adrenal lesions increases to 71% if the adrenal mass is larger than 4 cm and demonstrates an increase in size on follow-up imaging within 1 year.6
The nature of incidentally detected adrenal masses can be determined with a high degree of accuracy using computed tomography (CT) or magnetic resonance imaging (MRI) alone. Positron emission tomography (PET) is also increasingly used in clinical practice to characterise adrenal lesions in patients being staged for cancer.
A small minority of adrenal masses elude precise characterisation on cross-sectional imaging and remain indeterminate. These are usually some lipid-poor adenomas, adrenal metastases, adrenal carcinomas and phaeochromocytomas. It is clearly important to make the distinction between these lesions in patients undergoing staging for a known carcinoma, as the presence of metastases contraindicates radical curative surgery or radiotherapy. On occasion the distinction can be difficult as there remains an overlap between imaging features of some benign and malignant lesions. CT and MRI techniques are optimised to maximise specificity for benign adrenal adenomas whilst still maintaining an acceptable sensitivity. Conversely, PET techniques are optimised for detection of malignant disease.
A variety of combinations of imaging techniques are used for characterisation of adrenal masses and these are discussed in the following section.
Computed Tomography (CT)
Lesion Size and Contour
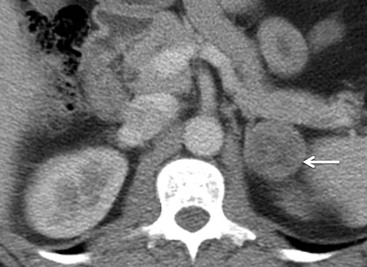
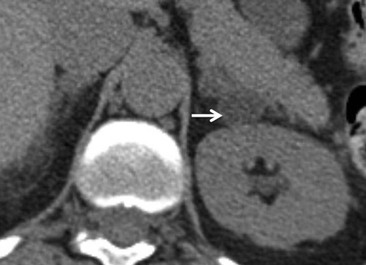
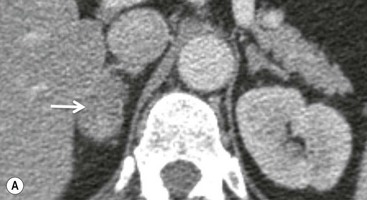
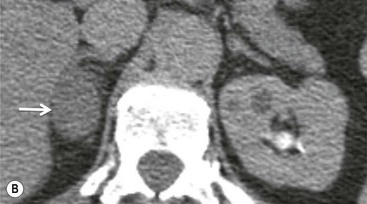
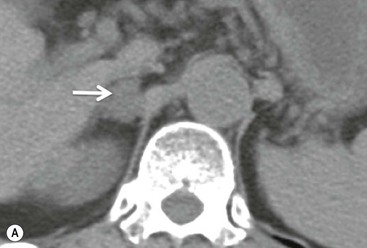
On unenhanced CT, imaging findings that suggest a higher likelihood of malignancy include a large lesion size, irregular contour, heterogeneous appearance and a temporal increase in size. Lesions greater than 4 cm in diameter have a higher likelihood to be either metastases or primary adrenal carcinomas.6,7 However, size alone is a poor discriminator between adenomas and non-adenomas. In a study by Lee et al., using 3.0 cm as the maximum size cut-off, the sensitivity and specificity for adenomas was only 79 and 84%, respectively (Figs. 44-4 and 44-5).7 Although it has been suggested that adenomas have a smooth contour, whilst malignant lesions have an irregular shape, this as a single feature is insufficient in discriminaing.
Rapid change in size does raise the suspicion of malignancy as adenomas are slow-growing lesions.
Guidelines published by the American College of Radiology suggest that for lesions >4 cm in size, adrenal resection without any other additional imaging work-up should be considered once biochemical evaluation to exclude phaeochromocytomas has been performed if typical imaging features such as those seen in benign lesions such as myelolipomas, adenomas, cysts are not present.8 The same guidelines also controversially suggest that in patients with no history of prior malignancy who present with a <4 cm adrenal mass with benign imaging features such as smooth external contour and homogeneous appearance, a follow-up in 6–12 months is adequate and no additional imaging with contrast enhancement or chemical shift imaging (CSI) MRI is required. In the authors’ experience, other confirmative features of a benign lesion are needed before this guideline can be safely applied.
Intracellular Lipid Content of the Adrenal Mass
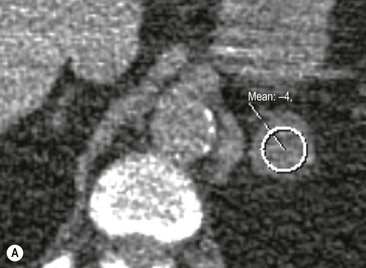
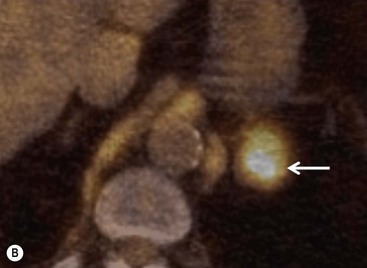
The majority (>70%) of adenomas have a high intracellular lipid content which lowers their non-contrast CT density and hence their attenuation value. If an adrenal mass measures 0 HU or less, the specificity of the mass being a benign lipid-rich adenoma is 100% but the sensitivity is only an unacceptable 47%. Boland et al. performed a meta-analysis of 10 studies demonstrating that if a threshold attenuation value of 10 HU was adopted, specificity was 98% and sensitivity increased to a clinically acceptable 71%.9 Therefore, 10 HU is the most widely used threshold value for the diagnosis of a lipid-rich adrenal adenoma. In another study by Song et al.,3 in 973 consecutive patients with 1049 incidental adrenal masses, adenomas accounted for 75% of incidental masses, of which 78% were lipid-rich adenomas, with a non-contrast CT attenuation value of less than 10 HU. By using a threshold of 10 HU, the sensitivity and specificity for the detection of an adenoma at unenhanced CT is 89% and 100%, respectively.10 Therefore most lesions can be fully characterised by CT alone and require no further confirmatory imaging (Fig. 44-6). Lesions on unenhanced CT with an attenuation greater than 10 HU require further evaluation with either contrast-enhanced washout CT, MRI or scintigraphy.
Contrast Enhancement and Contrast Washout Characteristics
On unenhanced CT, up to 12–30% of benign adenomas have an attenuation value of greater than 10 HU and are considered lipid poor.9–13 Malignant lesions and phaeochromocytomas are also lipid poor. Characterisation of adrenal masses using contrast-enhanced CT relies on the unique physiological perfusion patterns of adenomas. Adenomas enhance rapidly after contrast medium administration and also demonstrate a rapid washout of contrast medium—a phenomenon termed contrast medium washout. Malignant lesions and phaeochromocytomas enhance rapidly but demonstrate a slower washout of contrast medium.
The difference in contrast enhancement washout characteristics between adenomas and malignant lesions has been shown to be a consistent and reliable technique. The percentage of contrast enhancement washout between enhanced images acquired 60 s after contrast medium administration and the delayed images acquired 15 min after contrast medium administration can be used to differentiate adenomas from malignant lesions.14–16 Measurements of the attenuation values of the mass before injection of contrast medium, at 60 s following injection of contrast medium and then again at 15 min, are made using an electronic cursor that encompasses at least two-thirds of the mass. These contrast medium enhancement washout values are only applicable to relatively homogeneous masses without large areas of necrosis or haemorrhage. Both lipid-rich and -poor adenomas behave similarly, as this property of adenomas is independent of their lipid content (Fig. 44-7). The percentage of absolute contrast enhancement washout (ACEW) can be calculated thus:
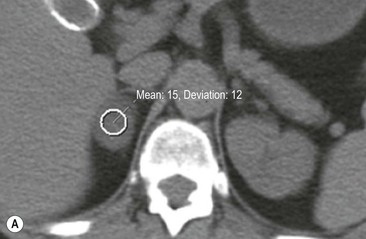
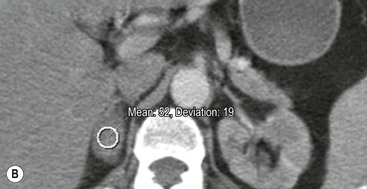
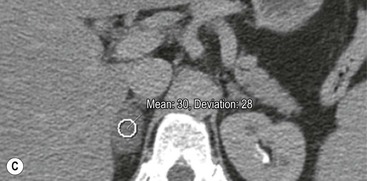
The contrast-enhanced CT (CE CT) value is the attenuation value of the mass, in Hounsfield units, 60 seconds after commencement of intravenous contrast medium administration. The delayed attenuation value is the attenuation value of the mass, in Hounsfield units 15 min after commencement of contrast medium administration. Unenhanced CT attenuation is the attenuation value of the mass before administration of contrast media.
If a 15-min delayed protocol is used, an absolute contrast enhancement washout of 60% or higher has a sensitivity of 86–88% and a specificity of 92–96% for the diagnosis of an adenoma.16
However, the measurement of this absolute contrast medium enhancement washout requires a non-contrast image. Frequently, in clinical practice, only post-contrast are available (Fig. 44-8). In these patients, by performing a delayed 15-min CT the percentage relative contrast enhancement washout can be calculated thus:
The enhanced and delayed attenuation values are measured as described previously. After 15 min, if a relative enhancement washout of 40% or higher is achieved, this has a sensitivity of 96% and a specificity of 100% for the diagnosis of an adenoma.11
Phaeochromocytomas may cause confusion as they may be of sufficiently low attenuation (1.8–42 HU) on non-contrast-enhanced CT to be mistaken for adenomas and show contrast washout profiles similar to adenomas (absolute washout 40–89% and relative washout 16–83%). Phaeochromocytomas, although rare, may present as incidental masses and on CT mimic both adenomas and malignant masses.12 Therefore, if there is doubt, a phaeochromocytoma should be excluded by clinical and biochemical evaluation.
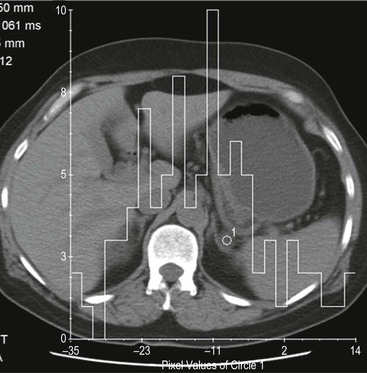
Histogram Analysis Method
Although contrast enhancement washout criteria have a high sensitivity and specificity for adenomas, the technique is somewhat cumbersome, requiring contrast medium administration and delayed images up to 15 min after contrast enhancement. Unenhanced CT alone, when using a threshold of 10 HU or less, has a 100% specificity but a low sensitivity for adenomas. CT histogram analysis is a technique that has been applied to both non-contrast-enhanced and contrast-enhanced images.17–21 A region of interest (ROI) cursor is drawn covering at least two-thirds of the adrenal mass, excluding areas of necrosis. The individual attenuation values of all the pixels in the ROI are plotted against their frequency and the amount of lipid in the mass is proportional to the number of negative pixels (less than 0 HU). The original studies demonstrated 97% of adenomas contain negative pixels. Eighty-five per cent have more than 5% negative pixels and 83% have more than 10% negative pixels. No metastases had negative pixels.18 The performance of histogram analysis is variable in the literature and subsequent studies have reported negative pixels in non-adenomas including metastases, phaeochromocytomas, and carcinomas.19,20
CT histogram analysis on unenhanced images may be a useful adjunct to the CT attenuation values, as the combination of CT attenuation value <10 HU or > 10% negative pixel content would correctly identify 91% of adenomas compared with 66% using CT attenuation values alone (Fig. 44-9).10,20,21 On enhanced CT, the low sensitivity of histogram analysis precludes clinical usefulness.20
Magnetic Resonance Imaging
Conventional Spin-Echo Imaging
On conventional T1 and T2 images, considerable overlap exists between the signal intensities of adenomas and metastases and up to a third of lesions remain indeterminate.22–24
Gadolinium-Enhanced Magnetic Resonance Imaging
The accuracy of MRI in differentiating benign from malignant masses can be improved by using intravenous gadolinium injection and T1-weighted sequences. After gadolinium enhancement, 90% of adenomas demonstrate homogeneous or ring enhancement while 60% of malignant masses have heterogeneous enhancement. Adenomas again show early peak enhancement, and the time to reach peak enhancement is the strongest discriminator between adenomas and malignant adrenal masses. The value of peak enhancement has no statistical difference between adenomas and metastases.25 However, as with signal characteristics alone, there is considerable overlap in enhancement characteristics of benign and malignant masses, limiting its clinical application in distinguishing adenomas from malignant masses.
Chemical Shift Imaging
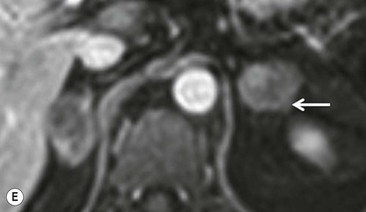
Chemical shift imaging (CSI) relies on the fact that, within a magnetic field, protons in water molecules oscillate or precess at a slightly different frequency than the protons in lipid molecules. As a result, water and fat protons cycle in and out of phase with respect to one another. By selecting appropriate sequencing parameters, separate images can be acquired with the water and fat protons oscillating in-phase and out-of-phase to each other. The signal intensity of a pixel on in-phase images is derived from the signal of water plus fat protons when water and fat are present in the same pixel. On out-of-phase sequences, the signal intensity is derived from the difference of the signal intensities of water and fat protons. Therefore, adenomas which contain intracellular lipid lose signal intensity on out-of-phase images compared to in-phase images, whereas malignant lesions and phaeochromocytomas, which lack intracellular lipid, remain unchanged.
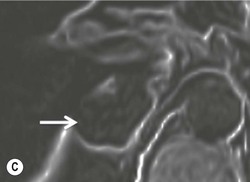
Simple visual assessment of relative signal intensity loss is accurate in most cases, but quantitative methods may be useful in equivocal cases (Fig. 44-10).
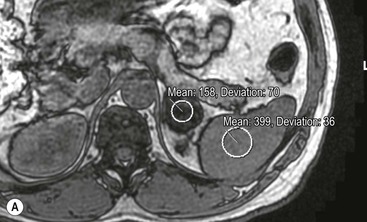
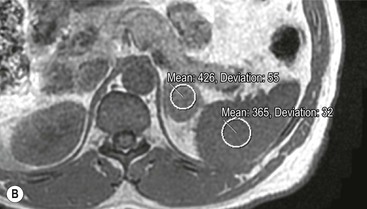
There are several quantitative ways of assessing the degree of loss of signal intensity. Quantitative analysis can be made using adrenal-splenic ratio (ASR) and signal intensity index (SII). MR signal intensity units are arbitrary units and therefore comparison of signal intensity of the adrenal mass to an internal reference provides a more accurate analysis than evaluation of two values from the same organ. A variety of ratios comparing the loss of signal intensity in the adrenal mass with that of the liver, paraspinal muscle or spleen on in-phase and out-of-phase images have been used. Fatty infiltration of the liver (particularly in oncology patients receiving chemotherapy) and iron overload make the liver an unreliable internal standard. Fatty infiltration in mainly elderly patients or due to disuse may also affect skeletal muscle to a lesser extent. To calculate adrenal-lesion-to-spleen ratio (ASR), regions of interest (ROIs) are used to acquire the signal intensity (SI) within the adrenal mass and the spleen from in-phase and out-of-phase images. The ASR reflects the percentage signal drop-off within the adrenal lesion compared with the spleen and it can be calculated thus:
An ASR ratio of 70 or less has been shown to be 100% specific for adenomas but only 78% sensitive (Fig. 44-11).26
Signal intensity index uses the same characteristics of the adrenal mass on both in- and out-of-phase imaging and can be calculated thus:
Signal intensity indices have been shown to discriminate between adenomas and metastases with an accuracy of 100%.27 Adenomas characteristically have signal intensity indices greater than 5%, whilst metastases have indices lower than 5% (Fig. 44-12). However subsequent studies have used thresholds of between 1 and 30% in identifying adenomas.28 This variability can be partly explained by the difference in imaging parameters like T1 weighting, repetition time, and flip angles which affect the quantification of lipid.29 Individual centres need to determine which threshold to use depending on the imaging parameters employed.
The combination of spin-echo signal characteristics, gadolinium enhancement and chemical shift imaging is currently 85–90% accurate in distinguishing between adenomas and non-adenomas. There are few direct comparisons between CT and MRI. As both unenhanced CT and chemical shift imaging rely upon the same property of adenomas, namely their lipid content, the performance of the techniques correlate. Recent studies indicate that CSI is more sensitive in the detection of intracellular lipid than CT. Whereas on unenhanced CT, up to 30% of adenomas are lipid poor, only 8% demonstrate no loss of signal intensity on CSI. In addition, more lipid-poor adenomas can be distinguished from non-adenomas using signal intensity indices without the use of intravenous contrast media. When CSI was applied to lipid-poor adenomas with non-contrast CT attenuation values between 10 and 30 HU, CSI detected adenomas with a sensitivity of 89%. Therefore in this group of adrenal masses, CSI detects more adenomas than non-contrast-enhanced CT.30,31
Further modification of CSI to subtraction CSI entails post processing of the CSI data whereby the out-of-phase images are subtracted from the in-phase images. The subtracted images can be evaluated either quantitatively or qualitatively. Qualitative assessment is visual, with adenomas demonstrating higher signal intensities than metastases on subtracted images. Quantitatively, the mean signal intensity from a region of interest in the subtracted image is obtained. If the cutoff values of the subtracted signal intensities selected are above 106 for adenomas and below 36 for metastases, the reported accuracy of distinguishing between the two lesions is 100%. One advantage of subtraction MRI is that the technique uses no calculation of ratios or formulas. This technique can be used in equivocal cases to further improve diagnostic CSI accuracy in distinguishing adenomas from non-adenomas (Figs. 44-13 and 44-14).32
Positron Emission Tomography
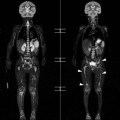
Whole-body positron emission tomography (PET) with [18F]-fluorodeoxyglucose (18F-FDG) improves the characterisation of malignant adrenal lesions. In early studies, in relation to lung cancer, 18F-FDG PET was shown to be highly accurate in differentiating adrenal benign non-inflammatory lesions from malignant disease. Larger, more recent studies confirm the high sensitivity of PET-CT in detecting malignant lesions but the specificity is lower, ranging between 87 and 97%. This loss of specificity is attributable to a small number of adenomas and other benign lesions that mimic the high metabolic activity of malignant lesions.33,34
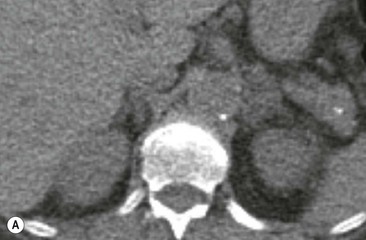
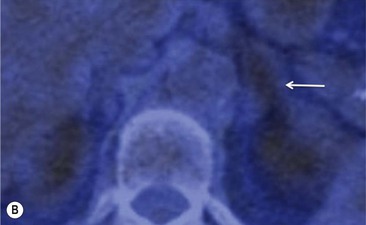
To distinguish between adenomas and non-adenomas, qualitative visual assessment alone of FDG activity in benign adrenal adenomas is variable, ranging from mild, moderate to high FDG uptake while malignant masses have moderate to high uptake. When compared to FDG uptake in the liver, benign adenomas have been shown to have FDG uptake less than, equal to, or more than the liver in 51, 38 and 10%, respectively. No non-adenomas had activity less than the liver and FDG uptake equal to, or more than the liver in 25 and 75%, respectively. However, as 48% of adenomas demonstrate moderate and high FDG, they mimic malignant masses, thereby limiting the role of 18F-FDG PET in clinical practice (Figs. 44-15 and 44-16).35,36
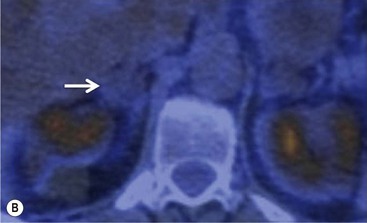
Quantitative evaluation using standardised uptake values (SUVs) using a cutoff value of 2.68–3.0 separates malignant from benign adrenal masses with a high sensitivity (99%), specificity (92%), positive predictive value (89%), and negative predictive values (99%). When combined FDG PET and CT data, including contrast washout characteristics, are analysed, the sensitivity, specificity, positive predictive value and negative predictive value for malignant adrenal masses improve to 100, 98, 97 and 100%, respectively.35–37 False-positive lesions for malignancy encountered at integrated PET-CT include adrenal adenomas, phaeochromocytomas, adrenal endothelial cysts, inflammatory and infectious lesions. False negatives for malignancy have been reported in adrenal metastases with haemorrhage or necrosis, small (5–10 mm) metastatic nodules, and metastases from pulmonary bronchioloalveolar carcinoma or carcinoid tumours (Fig. 44-17).
Although the maximum SUV uptake values for adenomas are lower than metastases, as for qualitative evaluation considerable overlap remains. More sophisticated quantification methods have been proposed looking at the ratio of SUV of the adrenal mass and the liver. Lesions that demonstrate visual uptake and SUV less than the liver have now been confirmed on several studies to be benign lesions with a specificity of 100%. A negative PET may predict a benign tumour that would potentially prevent the need for biopsy or surgery in lesions with inconclusive CT or MR imaging. However, lesions with visual and SUV uptake equal to or greater than the liver still remain problematic as the specificity for malignant disease is between 88 and 94%.35
The specificity of PET can be improved with the use of [11C]metomidate (MTO), a marker of 11β-hydroxylase, as a tracer for adrenocortical tissue. With this tracer, phaeochromocytomas, metastases to the adrenal gland, and non-adrenal cortical masses are all MTO-uptake negative. However, the tracer has an increased uptake in both adenomas and adrenocortical carcinomas, hence being unable to distinguish between these lesions.38
Percutaneous Adrenal Biopsy
Related posts:
Stay updated, free articles. Join our Telegram channel

Full access? Get Clinical Tree


