Fig. 6.1
Left ventricular (LV) volumes and ejection fraction (EF) quantification with 3D echocardiography in a patient with dilated cardiomyopathy (DCM) with severe LV dilatation and dysfunction. The endocardial border is manually traced in the apical four-chamber (upper left panel ), two-chamber (upper right panel ), and short-axis (mid left panel ) views, and a 3D LV model is automatically generated (mid right panel ); subsequently, 3D LV volumes and EF are measured, and a time–volume change curve of all segments during the cardiac cycle is provided (lower panel ). EDV end-diastolic volume, ESV end-systolic volume, SV stroke volume
Technological advances in the field of cardiac ultrasound have lead to further new noninvasive techniques, such as TDI and speckle-tracking strain imaging, for assessing cardiac mechanics and segmental and global LV function. The peak systolic myocardial velocity S’, a simple TDI index of systolic longitudinal function, is a marker of impaired subendocardial fiber contraction and correlates with myocardial fibrosis [9]. In addition, strain evaluation (by TDI, 2D and 3D speckle-tracking echocardiography) allows discrimination between active and passive movement of all myocardial segments and permits separate assessments of distinct components of myocardial deformation (i.e., longitudinal versus circumferential shortening and radial thickening) [10]. Also, all myocardial deformation parameters, including longitudinal, circumferential, and radial strain and torsion, are reduced in DCM patients (Fig. 6.2, Clips 6.2a, 6.2b, and 6.2c) [11].
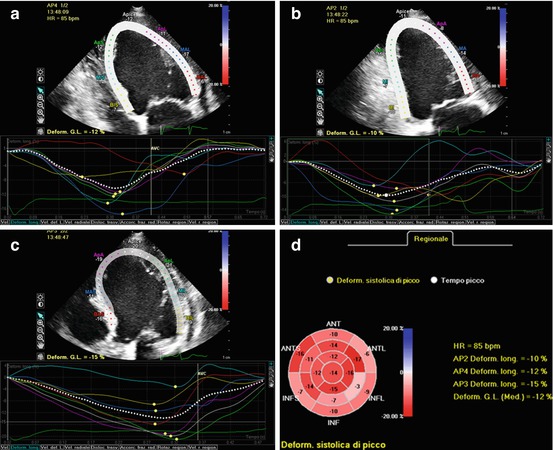
Fig. 6.2
Left ventricular (LV) longitudinal strain evaluation by 2D speckle-tracking echocardiography in apical four- (a), two- (b), and long-axis (c) views in a dilated cardiomyopathy (DCM) patient. In each view, the LV region of interest in the 2D speckle-tracking analysis is shown (upper half of each panel), together with longitudinal strain curves for each segment (lower half of each panel). Final results of the strain analysis for each LV segment are displayed in a bulls-eye plot (d). Global longitudinal strain is automatically calculated by the software and is importantly reduced (−12 %)
6.3 Left Ventricular Diastolic Function
TDI of the mitral annulus is a relatively novel method for assessing diastolic function. It is performed in apical four-chamber view, placing the pulsed-wave tissue Doppler on the septal or lateral annulus of the mitral valve (MV), showing a Doppler pattern with E’ and A’ waves. The ratio of transmitral E velocity to mitral annular E’ velocity (E/E’) is a marker of left atrial (LA) pressure, is related to exercise capacity in DCM, and provides prognostic value [12]. On the other hand, E/E’ ratio has a wide grey zone, and its accuracy is questionable, particularly in patients with advanced DCM and severe heart failure (HF). In fact, a study with invasive hemodynamic correlations showed that E/E’ ratio had a weak correlation with LV filling pressures in DCM patients, particularly in those with severe LV dilation and after CRT [13].
Other new indices for diastolic function evaluation obtained by speckle-tracking analysis are promising. Circumferential strain and strain rate during late diastolic LV filling, E/circumferential strain rate at early diastolic LV filling, and E/circumferential strain at the time of peak E wave showed greater area under the curve than the E/E’ ratio for predicting pulmonary capillary wedge pressure (PCWP) >12 mmHg [14]. Also, LA strain assessment with speckle-tracking technique demonstrated a better correlation than other Doppler indices, such as E/E’ ratio, with LV filling pressure as measured by right catheterization, in patients with advanced systolic HF [15]. Specifically, peak atrial longitudinal strain is a parameter for functional assessment of the atrial reservoir phase (which is essential for LV filling), and results progressively reduced with the increase of LV filling pressure. Therefore, peak atrial longitudinal strain demonstrated a strong inverse correlation with PCWP and excellent diagnostic accuracy in predicting elevated filling pressure [15].
6.4 Left Ventricular Dyssynchrony
There is evidence that LV mechanical dyssynchrony is an independent determinant of response to CRT and long-term survival [16]. Advanced indices of intraventricular mechanical dyssynchrony are based on TDI, speckle-tracking imaging, and 3D echocardiography [17].
The rocking motion of the apex (apical rocking) can be quantified by TDI by measuring the transverse motion of the LV apex perpendicular to the LV long axis. This index is clinically feasible, reproducible, and has predictive value for response and long-term survival following CRT [18]. Furthermore, the time from QRS onset to peak systolic velocity can be measured by TDI imaging at the level of different basal and mid-LV segments: the time difference between peak contraction of opposite segments is an index for LV dyssynchrony. Contraction delay between the basal septum and the basal lateral wall in the apical four-chamber view is usually considered, but this index can be measured from multiple apical views in up to 12 segments. Moreover, TDI-derived longitudinal strain and strain-rate imaging allows LV dyssynchrony evaluation by measuring the time delay between peak systolic strain rate [19]. The Predictors of Response to CT (PROSPECT) trial demonstrated a low sensitivity and specificity of echocardiographic TDI markers of LV dyssynchrony for predicting response to CRT [20]. The TDI markers indeed show low feasibility and reproducibility. In particular, in advanced DCM patients with extended areas of akinesis, identifying systolic contraction timing and measurements of TDI parameters are particularly problematic and can be misleading, as it is impossible to discriminate passive from active myocardial movements.
New echocardiographic techniques not included in the PROSPECT trial involve speckle-tracking strain evaluation and 3D echocardiography, even if the temporal resolution of these techniques is relatively low and inferior compared with TDI [21, 22].
LV dyssynchrony with speckle-tracking strain analysis (Fig. 6.3) is calculated as the time difference in peak strain values (radial and circumferential in the short-axis plane, longitudinal and transverse in the long-axis plane) between opposing segments (most frequently between the anteroseptal and posterolateral wall) [21]. Longitudinal and radial strain parameters appear to be more reproducible and accurate for quantifying LV mechanical dyssynchrony [21, 23]. In the prospective multicenter Speckle Tracking and Resynchronization (STAR) study [24], radial and transverse LV strains were both significantly associated with EF response and long-term outcome (death, heart transplant, LV assist device) after CRT. Lack of baseline radial or transverse LV dyssynchrony (defined as ≥130 ms opposing wall delay) appeared to be a marker of adverse prognosis following CRT [24].
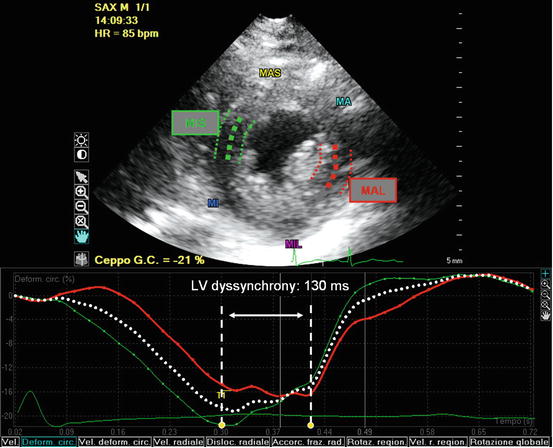
Fig. 6.3
Evaluation of left ventricular (LV) dyssynchrony with 2D speckle-tracking strain analysis calculated as the time difference in peak circumferential strain between opposing segments (mid-inferoseptal and mid-anterolateral wall) in the short-axis plane. In this case of advanced dilated cardiomyopathy (DCM), there was significant LV dyssynchrony (130 ms). MA mid anterior, MAL mid anterolateral, MAS mid anteroseptal, MI mid inferior, MIL mid inferolateral, MIS mid inferoseptal
Furthermore, 3D echocardiography has emerged as a novel technique for dyssynchrony quantification based on analysis of volume variations of each segment in the same cardiac cycle: if the contraction is dyssynchronous, there is dispersion in the time each segment takes to reach its minimum volume. The 3D systolic dyssynchrony index is defined as the standard deviation of the time to minimum systolic regional volume using a 16-segment model (Fig. 6.4). A cutoff value of systolic dyssynchrony index ≥5.6 % has been proposed to predict response to CRT [25]. More recently, 3D speckle-tracking imaging has emerged for calculating LV dyssynchrony by assessing myocardial deformation within the LV 3D full volume [26]. With this technique, the maximal opposing wall delay and the standard deviation of time to peak (radial) strain of 16 LV segments are derived as LV dyssynchrony indices. HF patients show higher 3D dyssynchrony indices compared with normal individuals; moreover, in patients who underwent CRT, 3D imaging demonstrated effective LV resynchronization with considerably improved systolic function [26].
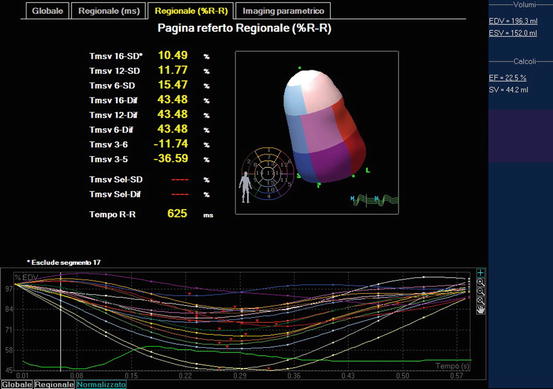
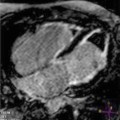
Fig. 6.4
Quantification of left ventricular (LV) dyssynchrony by 3D echocardiography: the systolic dyssynchrony index (defined as the standard deviation of the time to minimum systolic regional volume using a 16-segment model) was 10.49 % in this patient, indicating significant LV dyssynchrony
Larger studies are needed to determine the best LV mechanical dyssynchrony echocardiographic parameter for predicting CRT response and long-term survival. Moreover, besides LV mechanical dyssynchrony, it seems important to use advanced imaging to evaluate other aspects to maximize response to CRT, including detecting necrotic tissue, presence of viability, and availability of coronary veins for optimal LV lead position [27]. Echocardiography might play a role in identifying the optimal site for LV pacing, first by detecting the myocardial area of latest mechanical activation (in particular, by 2D and 3D speckle-tracking imaging) [28
 Dilated Cardiomyopathy: Usefulness of Imaging in Prognostic Stratification and Choice of Treatment
 Hypertrophic Cardiomyopathy: Clinical Assessment and Differential Diagnosis
 Definition, Classification, Epidemiology, and Clinical Relevance of Cardiomyopathies
 Arrhythmogenic Right Ventricular Cardiomyopathy: Clinical Assessment and Differential Diagnosis
 Infiltrative/Storage Cardiomyopathies: Clinical Assessment and Imaging in Diagnosis and Patient Management
 Restrictive Cardiomyopathy: Clinical Assessment and Imaging in Diagnosis and Patient Management


Related posts:
Dilated Cardiomyopathy: Usefulness of Imaging in Prognostic Stratification and Choice of Treatment
Hypertrophic Cardiomyopathy: Clinical Assessment and Differential Diagnosis
Definition, Classification, Epidemiology, and Clinical Relevance of Cardiomyopathies
Arrhythmogenic Right Ventricular Cardiomyopathy: Clinical Assessment and Differential Diagnosis
Infiltrative/Storage Cardiomyopathies: Clinical Assessment and Imaging in Diagnosis and Patient Management
Restrictive Cardiomyopathy: Clinical Assessment and Imaging in Diagnosis and Patient Management
Stay updated, free articles. Join our Telegram channel
Full access? Get Clinical Tree
