This review summarizes results from studies that have applied advanced magnetic resonance (MR) imaging techniques to patients with pediatric-onset multiple sclerosis (MS), and includes a discussion of cortical imaging techniques, volumetry, magnetization transfer and diffusion tensor imaging, proton magnetic resonance spectroscopy, and functional MR imaging. Multicenter studies on the sensitivity of these techniques to natural history of disease and treatment response are required before their implementation into clinical practice.
Key points
- •
Advanced MR imaging techniques are more specific than conventional sequences to the heterogenous features of MS disease and permit quantification of tissue damage in normal appearing brain tissue.
- •
Recent volumetric studies have revealed that global brain volume and head size are reduced in children with MS compared to matched healthy children. These findings suggest that pediatric MS may affect primary brain and skull growth.
- •
Thalamic volume and diffusion tensor indices such as fractional anisotropy and mean diffusivity are associated with cognitive impairment in children with MS.
- •
Studies applying techniques such as focussed cortical imaging, magnetization transfer and functional MR imaging, and MR spectroscopy are limited, and should represent key areas of MR imaging research in pediatric-onset MS to aid in understanding the some of the earliest signatures of MS disease.
Introduction
The sensitivity of conventional magnetic resonance (MR) imaging (ie, proton density, T2-weighted, fluid-attenuated inversion recovery (FLAIR), and T1-weighted sequences) to detect subclinical disease activity has led to its incorporation into diagnostic criteria for individuals suspected of having multiple sclerosis (MS), and to its use in providing prognostic information for patients in the earliest disease stages. However, the strength of association between conventional MR imaging findings and clinical parameters in patients with established MS is only modest. This association may be explained by the lack of specificity of conventional MR imaging for the heterogeneous features of MS disease as well as its inability to quantitatively characterize damage to normal-appearing white matter (NAWM) and normal-appearing gray matter (NAGM). Over the past 2 decades, advanced MR imaging techniques have been developed with the objective to identify in vivo quantitative pathologic substrates of clinical disability and provide more specific or sensitive end points for treatment trials. These techniques are not routinely available for clinical use, because they require standardized acquisition, rigorous image analysis pipelines, MR imaging scanner quality-control monitoring, and control or reference data. Multicenter studies on the sensitivity of these techniques to natural history of disease and treatment response are required before their implementation into clinical imaging protocols.
This review summarizes results from studies that have applied advanced MR imaging techniques to patients with pediatric-onset MS, and includes a discussion of cortical imaging techniques, volumetry, magnetization transfer (MT) and diffusion tensor (DT) imaging, proton magnetic resonance spectroscopy ( 1 H-MRS), and functional MR imaging (fMR imaging). The application of advanced MR imaging techniques to pediatric MS is still in its infancy, and therefore, for several techniques, the literature available for review is limited.
Cortical imaging
Background
Several histopathologic studies have shown that a substantial proportion of the focal cerebral lesion load in adult patients with MS is located within the cortex or at the junction between the cortex and subcortical white matter and that cortical lesions are actively inflammatory and appear early on in the MS disease course. Postmortem studies of adult patients have shown that cortical lesions can be classified according to 4 subtypes: (1) lesions involving the cortical gray matter and adjacent subcortical white matter, termed leukocortical lesions; (2) intracortical lesions located solely within the cortex and not involving the subpial cortex or subcortical white matter; (3) lesions beginning in the subpial cortex but that do not reach the boundary between gray and white matter; and (4) lesions involving the entire width of the cerebral cortex, from subpial cortex to the border between gray and white matter. These lesions are not typically resolved on conventional MR imaging sequences because of their small size, their poor contrast against normal-appearing cortical gray matter, and the effects of partial voluming from the surrounding cerebrospinal fluid.
The ability to detect and quantify the level of cortical involvement has important implications, because quantitative MR imaging studies in adults with MS have shown evidence of cortical gray matter damage in the earliest clinical stages of the disease, and cortical gray matter volume loss occurs at a faster rate than that of the white matter. In addition, MR imaging measures of cortical gray matter damage, specifically accumulation of intracortical lesions, have shown stronger correlations with clinical measures of physical and cognitive impairment and with co-occurring epilepsy, compared with measures of white matter lesion burden. Guidelines for the scoring of cortical lesions have recently been proposed. The presence of at least 1 cortical lesion independently predicts MS diagnosis in adults with a first attack of central nervous system (CNS) demyelination. Disease-modifying therapy in adults with MS has also been shown to decrease the number of new cortical lesions and slow the rate of cortical atrophy when compared with untreated patients.
Cortical Imaging Techniques
Several pulse sequences have been shown to substantially improve detection of cortical lesions. Compared with two-dimensional T2-weighted spin-echo imaging, the three-dimensional (3D) fast FLAIR sequence, which allows acquisition of thinner slices, has an increased sensitivity for cortical lesions. However, delineation of cortical lesions on T2-weighted and FLAIR imaging remains a challenge because of poor gray matter–white matter contrast, which makes complicates classification of lesions as intracortical, leukocortical, or juxtacortical. Limited blood-brain barrier permeability and low inflammatory cell infiltration in cortical lesions, as well as low myelin density in the upper layers of the neocortex, decrease T2 contrast.
Introduction of the double inversion recovery (DIR) sequence has substantially increased the in vivo detection of cortical lesions. By selecting inversion times that can simultaneously achieve T1-based suppression of the signals from both white matter and cerebrospinal fluid, the DIR sequence yields images in which T2 variations within gray matter are more easily detected. The result is superior delineation of the gray matter and the boundary between the cortex and subcortical white matter, with lesions appearing hyperintense. Using DIR imaging, intracortical lesion detection rates per patient increase by 152% compared with FLAIR imaging, and by 538% when compared with T2-weighted imaging. DIR imaging at 3 T results in a 192% increase in cortical lesion detection compared with 1.5-T DIR images. A study of the probabilistic distribution and frequency of cortical lesions in adults with MS confirmed earlier histopathologic studies, showing that more than 80% of lesions were found in the frontotemporal cortex, with a predilection for the motor cortex in approximately 35% of patients and anterior cingulate gyrus in 10%. There are likely still many cortical lesions not resolved by DIR, because only about 10% to 20% of cortical lesions identified through postmortem immunohistochemistry are detected on DIR imaging.
Given that DIR imaging is limited by a low cortical lesion detection rate compared with histopathologic studies, poor delineation of lesion borders, artifacts caused by cerebrospinal fluid flow and pulsation, and an intrinsically low signal-to-noise ratio, combining DIR imaging with other sequences may improve cortical lesion detection and reliability of cortical lesion classification. Using a combination of phase-sensitive inversion recovery (PSIR) and DIR techniques yields a 337% increase in total number of cortical lesions detected when compared with FLAIR; intracortical lesion detection was increased by 417%, mixed gray-white matter lesions by 396%, and juxtacortical lesions by 130%.
3D spoiled gradient-recalled (SPGR) echo imaging provides high spatial resolution and high signal-to-noise ratio images within a clinically acceptable acquisition time. The superior contrast between gray matter and white matter achievable with SPGR permits increased classification accuracy for cortical lesions. One study reported that 30 of the 119 cortical lesions (11 patients) initially identified on DIR and PSIR images were reclassified after reviewing the 3D-SPGR images, with most reclassified from mixed gray-white matter lesions to purely intracortical.
Cortical Lesion Detection in Pediatric MS
Only 1 study has evaluated the presence, frequency, and type of cortical lesions in individuals with pediatric-onset MS compared with adult patients. Only 8% of the pediatric patients had cortical lesions, compared with 66% of adults with MS. Although the number and volume of white matter lesions did not differ between pediatric and adult patients with MS, mean cortical lesion count in pediatric patients was only 0.08, compared with 1.99 cortical lesions per adult patient. Median cortical lesion volume was also lower in pediatric versus adult patients. All cortical lesions in the pediatric patients were located at the gray matter–white matter boundary, which is where proliferation of myelin into the peripheral cortical neuropil occurs during childhood and adolescence.
These data suggest that cortical lesion formation is rare in patients with pediatric MS. Whether the formation of cortical lesions is rare in the early stages of MS cannot be determined from this study because the median disease duration was 2 years longer for adult-onset compared with pediatric-onset patients. It is possible that the degree of gray matter maturation in pediatric versus adult patients may explain why children with MS have fewer cortical lesions. Quantification of cortical volume by measuring cortical thickness has been conducted in adults with MS. Studies to assess whether cortical thinning is more prominent than cortical lesion accrual seen in children with MS have not yet been performed. Additional studies in children with MS are required to identify optimal MR imaging techniques for cortical lesion detection, and to better understand the frequency and localization of cortical lesions and their correlation with clinical parameters such as cognitive impairment.
Volumetry
Background
MR imaging measurement of volume loss in MS is appealing because it is believed to reflect a sensitive but nonspecific measure of irreversible axonal loss and the neurodegenerative aspect of MS pathobiology. Longitudinal studies in adults with MS have shown that volume loss is evident in the earliest stages of the disease and predicts clinical progression and that patients with the highest rate of volume loss early in the disease reach higher levels of disability than those with a slower rate of volume loss. Gray matter volume loss specifically develops at a faster rate than does white matter volume loss and shows stronger correlations with clinical disability than white matter loss and conventional T2 lesion measures.
Methodology for Measuring Brain Volume
From a technical point of view, measurement of brain volume is appealing, because it can be achieved using a conventional T1-weighted MR imaging pulse sequence. However, because the typical rate of brain volume loss in adults with relapsing-remitting MS is only between 0.5% and 1% per year, detection of these subtle volume changes requires quantitative techniques that rely on careful and consistent image acquisition, the use of image analysis algorithms that are not typically available or too intensive to run on MR imaging consoles, as well as the oversight of a trained operator. The technical demands of performing volumetric measurements have prevented their use outside the research setting.
The available methods for estimating brain volume differ depending on whether the intent is to measure volume change from serial images or to measure absolute or normalized volume from individual scans. When measuring absolute brain volume, 2 broad strategies apply. One is to classify each of the voxel elements of the image as either brain parenchyma or nonbrain. This classification can be based on image intensity, perhaps with the aid of spatial maps of prior probability, or by evolving a deformable model to find the brain surface. The brain volume is then directly computed by summing the volumes of the constituent voxels. A second strategy is to use image registration to warp the shape of a reference brain image onto the given image. Volume is then computed using the spatial transformation and the brain boundary defined on the reference image.
A challenge to estimating absolute brain volume is that the MR imaging scanner may not have sufficient geometric accuracy to correctly report the differences on the order of 1% that are anticipated. This limitation can be overcome by careful geometric calibration of the MR imaging scanner with a specialized phantom or by normalizing the brain volume to another structure. Normalization of brain volume to intracranial volume is a common strategy for analyzing cross-sectional data.
Deformation-based and voxel-based morphometry are 2 methods that allow estimation of brain volume change from serial images. In the case of deformation-based morphometry, images from the time series are warped to align with each other using image registration, and the brain boundary is estimated once for the entire series. Compared with estimating brain volume from individual scans, this approach has the advantage that the alignment between consecutive scans after warping tends to be more accurate than the alignment between a given image and the generic reference image. Voxel-based morphometry takes a similar approach, except that only linear or coarse scale nonlinear alignment is applied. The changes between consecutive images are then detected as small changes in gray level intensity that correspond to shifts in the position of the boundary that are smaller than the dimensions of the voxel. These brain shifts can be integrated across cortical regions or averaged across individuals to obtain estimates of volume change. Both deformation-based and voxel-based morphometry are generic methods that apply equally well to analyzing subregions of the brain or to boundaries other than the cortical surface.
Unique Methodological Issues in Brain Volume Measurement in Children
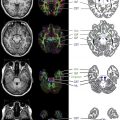
In healthy individuals, brain volume is nearly constant between the ages of 20 and 55 years, but in children and adolescents, the brain is still growing with age, and the rate of growth varies between individuals. Thus, choosing appropriate metrics to compare brain volumes among children is challenging. Methods of brain volume measurement that rely on normalization to the inner surface of the skull are inaccurate in children, especially between the ages of 10 and 12 years, because the skull and brain show a differential rate of brain growth. To overcome this challenge, a recent study that compared brain volume loss in children with MS with healthy controls proposed a novel approach of using a z score at each location in the brain to represent whether the local volume at each given location was larger or smaller than that for a database of age-matched controls ( Fig. 1 ). The z scores were computed by warping the given brain image to a reference image and computing the Jacobian determinant of this transformation. These Jacobian determinants can then be compared with those found for the age-matched reference population to compute the number of standard deviations by which the given individual deviates from the mean for that location. A positive Jacobian determinant value indicates a local volume increase relative to the template, and a negative determinant value indicates a local decrease in brain volume.

Volumetry in Pediatric MS
Several cross-sectional studies have been conducted to assess brain volume change in children with MS compared with healthy individuals and correlate these changes with clinical measures of disability and cognitive impairment. One study used a segmentation technique to calculate the brain parenchymal fraction, which normalizes parenchymal volume to the volume bounded by the inner skull surface; similarly, normalized gray and white matter fractions were also computed. Three key findings can be noted from this study. First, compared with adults with MS matched for disease duration, pediatric patients showed a higher brain parenchymal fraction and gray matter fraction. Second, when comparing adults with pediatric-onset MS with adult-onset patients matched for disease duration to assess the long-term impact of pediatric disease, no differences were found between groups for brain parenchymal fraction or white matter fraction, but adult patients trended toward greater gray matter volume loss compared with pediatric-onset adult patients. To assess age at onset-related differences in brain volume, a comparison between adults with pediatric-onset MS and adult-onset patients of similar age showed lower brain parenchymal and gray matter fractions in the adult pediatric-onset adult group compared with the adult-onset patients.
Another study used voxel-based morphometry to evaluate the pattern of gray matter loss in pediatric patients with MS compared with a control group matched for age and sex. No differences were detected in normalized brain and gray matter volume or intracranial volume between healthy individuals and children with MS, but patients showed locally reduced gray matter volume in the right and left thalami compared with controls. Although T2 lesion load was significantly negatively correlated with both left and right thalamic volume, no correlations were found with disability or disease duration. Children included in this study had a mean disease duration of only 3 years, and the accrual of disability in patients with pediatric-onset MS typically occurs 15 to 20 years after onset. The association between T2 lesion load and thalamic volume suggests that focal white matter lesions may cause retrograde or anterograde transynaptic degeneration of the afferent and efferent neuronal connections that relay through the thalamus. Evidence for this hypothesis is further given by a study that used deformation-based morphometry to evaluate the spatial distribution of brain volume loss in children with MS in a cross-sectional manner (see Fig. 1 ). Significant volume reductions were seen in the pulvinar and anterior nuclei of the left and right thalami as well as in the splenium of the corpus callosum and globus pallidus in pediatric patients compared with age-matched and sex-matched controls. T2 lesion load was negatively correlated with volume loss in the splenium of the corpus callosum, supporting the notion of Wallerian degeneration of the crossing nerve fiber tracts caused by axonal transection within hemispheric white matter focal lesions. Loss of volume within the optic tract (from the chiasm to the lateral geniculate bodies, and the anterior portion of the optic radiations) was associated with disease duration but not T2 lesion volume; however, post hoc analyses did not show any correlation between history of optic neuritis and optic pathway volume loss.
Using a region-of-interest method to analyze brain volume in children and adolescents with MS compared with healthy individuals, a significant reduction in global brain volume was detected in patients with MS. After correction for global brain volume, an even greater reduction in thalamic volume was observed in patients with MS compared with control individuals. Reduced normalized brain volume correlated moderately with increased T1 and T2 lesion volumes, suggesting an important contribution of focal MR imaging-visible lesions to the neurodegenerative process of MS. The investigators also observed a reduction in head size of the patients with pediatric-onset MS compared with matched healthy control individuals. Given that skull size is largely determined by brain growth during the first 10 years after birth, these findings suggest that pediatric-onset MS may affect primary brain and skull growth.
In a study of MR imaging correlates of cognitive impairment in children with MS, thalamic volume and corpus callosal area were positively correlated with an index of global intellectual function, mental processing speed, and confrontation naming. These findings support the notion that the neurodegenerative aspect of MS pathobiology is operative in the earliest stages of the disease and that immune-mediated damage of immature neural networks may have significant deleterious consequences on cognitive function. Longitudinal studies are needed to determine whether resiliency of developing neural networks is able to protect children with MS from long-term cognitive deficits.
MT imaging
Background
MR imaging studies have been pivotal in showing that pathologic changes are present not only within lesions but also in the normal-appearing brain matter (NABM) of patients with MS. MT imaging is a technique that can be used to quantify the level of microstructural damage within T2 visible lesions as well as NAWM and NAGM.
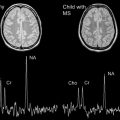
On MT ratio (MTR) maps, demyelinating lesions (T2 visible lesions) appear as hypointense ( Fig. 2 ). Postmortem studies of patients with MS have shown the relationship between low MTR and neuroaxonal damage and myelin loss both within lesions as well as in NABM. Remyelinated lesions have a higher MTR than demyelinated lesions, suggesting the potential role of MT imaging in monitoring remyelination.

Physics of MT Imaging
Conventional MR imaging pulse sequences exploit the properties (ie, T1 and T2 relaxation behavior as well as spin density) of free-water protons to produce tissue contrast. There is a pool of nonaqueous protons associated with proteins and macromolecules, such as myelin, which may permit quantification of myelin integrity in the context of MS. However, because of the short transverse (T2) relaxation times of these bound proton spins, signal decays too rapidly and prohibits acquisition of an MR imaging signal. Another challenge to imaging bound protons is that the frequency of the signal from aqueous protons is near that of the signal from the nonaqueous proton pool.
Using MT imaging, the protons bound to macromolecules can be probed via their exchange or transfer of magnetization with free-water protons. To achieve this goal, a selective radiofrequency pulse that is off the water resonance is applied to excite primarily the bound proton pool, thereby partially saturating its magnetization. Magnetization exchange between the partially saturated bound proton pool and the more mobile pool of spins causes a reduction in the signal measured by MR imaging. The MTR represents the efficiency of this magnetization exchange, and is calculated as a difference in signal between the images acquired with and without the off-resonance radiofrequency pulse. MTR maps are computed at a voxel level according to the following equation:
MTR=(1−MTon/MToff)×100%
Methods to Analyze MT Imaging Data
Several methods exist for analyzing MTR maps. These methods include computing average MTR within regions of interest such the NAWM or NAGM or within lesions; computing histograms of MTR for the whole brain; or voxel-by-voxel analysis. Voxel-by-voxel analysis is more technically demanding because image registration is required to identify corresponding voxels in multiple scans from a time series or across scans of different individuals.
MT Imaging in Pediatric MS
Only 3 studies have evaluated microstructural tissue abnormalities in children with MS using MT imaging. A preliminary study evaluated the average MTR and histogram peak height (ie, the most frequently occurring MTR value) in both the NABM and cervical spinal cord of 13 children with MS compared with age-matched and sex-matched healthy controls. However, no significant differences were found. In a follow-up study of 23 children with MS and 16 age-matched and sex-matched healthy controls, average MTR and histogram peak height in both the NAWM and NAGM were similar. In a study comparing 33 adults with pediatric-onset MS with 381 adults with adult-onset disease, MTR values tended to be lower within T2 lesions, NAWM, and NAGM, suggesting a greater degree of microstructural abnormality in pediatric-onset adult patients than adult-onset patients, perhaps explained by a longer disease duration. Further studies using voxel-based methods and longitudinal MTR analyses are required to determine the extent and time course for neuroaxonal and myelin injury in children and whether children show enhanced reparative capacity.
DT imaging
Background
Diffusion imaging is a powerful and sensitive technique used to noninvasively measure restriction of water diffusion in vivo within an image voxel, thereby providing information on the structural organization of the brain and spinal cord, as well as pathologic changes not visualized on conventional MR imaging scans. In diffusion imaging, the displacement (on the order of 10–15 μm ) of thermally driven, randomly moving (ie, Brownian motion) water molecules is measured. This distance is sufficient for restriction caused by subcellular and cellular structure to affect the measured signal; however, establishing which aspects of cellular structure account for observed changes is difficult. In white matter, the axonal membrane, intra-axonal structures such as neurofilaments, as well as the ensheathing layers of myelin, are all believed to affect the diffusion signal observed by MR imaging.
Physics of DT Imaging
The addition of a pair of strong gradient pulses to a spin-echo sequence is the most common strategy to create a diffusion-weighted imaging sequence, and is typically combined with an echo planar imaging readout for rapid acquisition. The amplitude, duration, and interval between the gradient pulses determine the diffusion weighting of the sequences and can be summarized by a single variable termed the b value. The exponential rate of signal loss with increasing b values is used to define the apparent diffusion coefficient (ADC) for a tissue and reflects both the diffusivity of water as well as the restrictions on water motion imposed by cellular structures. For the modest b values that are obtainable using clinical MR imaging systems, ADC shows little variation with b.
A limitation of reporting ADC alone is that for tissue with oriented structure, such as white matter tracts, the coefficient varies with the direction of the diffusion weighting gradients. A useful way to represent this directional dependence is to imagine an ellipsoidal region that describes where a given water molecule is likely to be found a short time later. Although this ellipsoidal confidence region needs to grow with time to allow for larger displacements of the water molecule, its shape remains the same. The ellipsoidal region can be represented mathematically by a 3-by-3 tensor, in which the eigenvectors of the tensor describe the axes of the ellipsoid and the eigenvalues the diffusivity along each axis. A minimum of 6 different diffusion-weighting directions is needed to estimate the DT for a given tissue.
Where water freely diffuses in all directions, such as in cerebrospinal fluid, this confidence region is spherical, representing isotropic diffusion. In tissue, where there are obstacles to water diffusion in certain directions, the confidence could be ellipsoidal, representing anisotropic diffusion. In myelinated tracts of the brain, for example, diffusion within each voxel occurs principally parallel to the axons, with relatively little diffusion perpendicular to the axon, possibly because of the hydrophobic nature of myelin. The principal eigenvector (λ 1 ) represents the diffusion direction of greatest magnitude within the voxel and is parallel to the white matter fibers. The secondary (λ 2 ) and tertiary (λ 3 ) eigenvectors are perpendicular to λ 1 and transverse to white matter fiber tracts.
Four diffusion parameters derived from the DT are typically reported in DT imaging studies: (1) mean diffusivity (MD) is the arithmetic average of the 3 diffusivities; (2) fractional anisotropy (FA) is a measure of the eccentricity of the ellipsoidal confidence region ; (3) parallel (axial) diffusivity (λ || ) is the same as λ 1 ; and (4) transverse (radial) diffusivity (λ ⊥ ) is the average of λ 2 and λ 3 ( Fig. 3 ).