Fig. 34.1
From birth, red marrow converts to fatty marrow from the periphery to the central skeleton. Superimposed on this centripetal pattern, red marrow converts to fatty marrow in the tubular bones proceeding from diaphysis to metaphysis until by the age of 20 years; only the proximal metaphyseal area contains appreciable red marrow
Bone marrow temperature is slightly lower (1.6–4.8°C) than normal body temperature. The propensity of red marrow to remain in the warmer more central parts of the skeleton may be related to temperature. It is known that armadillos and reindeer markedly increase their marrow fat or change marrow fat composition during the cold winter months and revert to a higher red marrow content during the warmer summer months (Weiss and Wislocki 1956; Soppela and Nieminen 2001).
Red and yellow marrow areas are not composed purely of either nonfatty cells or fat cells, respectively. Red marrow typically contains about 60 % hematopoietic cells and about 40 % fat cells (Fig. 34.2a, b) while fatty marrow contains about 5 % hematopoietic cells and about 95 % adipocytes (Hwang and Panicek 2007; Steiner et al. 1993). In other words, fatty marrow tends to be more pure than hematopoietic marrow.
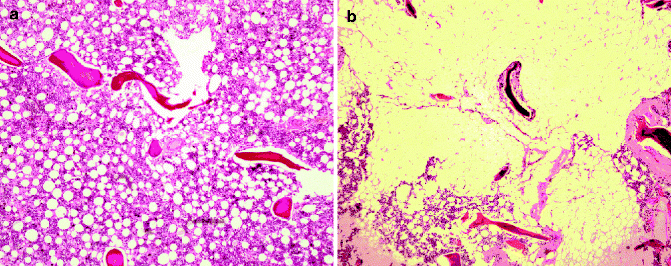

Fig. 34.2
(a) Histology of predominantly red marrow. There is still quite an abundance of fat cells present. (b) Histology of predominantly fatty marrow. There are only a few red cells present. In other words fatty marrow is more fatty than red marrow is red
Fat cells (adipocytes) as expected contain more lipid than hematopoietic cells while hematopoietic cells contain slightly more water and protein than adipocytes. The approximate chemical composition of fatty marrow is about 80 % lipid, 15 % water, and 5 % protein while that of red marrow is about 50 % lipid, 35 % water, and 15 % protein (Hwang and Panicek 2007; Steiner et al. 1993) (Fig. 34.3). This is important since MR quantification techniques such as MR spectroscopy use the fat to water ratio to determine the fat fraction (also referred to as percent fat content) in tissues (Fig. 34.4).
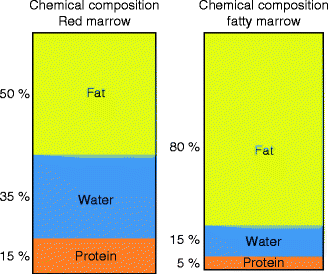
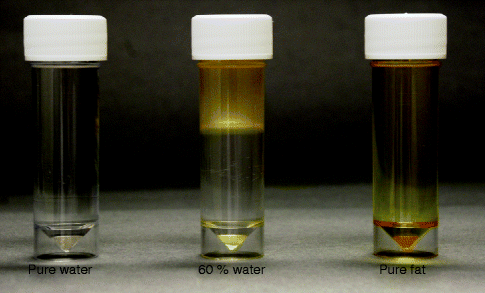

Fig. 34.3
Chemical composition of red marrow and fatty marrow. Hematopoietic marrow contains more water than fatty marrow

Fig. 34.4
Macroscopic appearance of pure water and fat and mixture of both
34.2 Bone Marrow Fat
Over the past two decades, a great deal has been learned about the structural and functional physiological processes occurring in the bone marrow with aging through noninvasive in vivo assessment with magnetic resonance imaging (MRI) and nuclear medicine studies including positron emission tomography (PET). The main functional MR-based techniques used to assess the bone marrow are MR spectroscopy, MR perfusion techniques, and MR diffusion techniques.
34.2.1 MR Spectroscopy
MR spectroscopy is the most widely used method to quantitatively assess marrow fat. MR spectroscopy uses the same basic principles as MRI but, rather than generating an image, focuses on analyzing the frequencies of the signals emitted from the area of interest. Thus, MR spectroscopy extracts information about the chemicals that reside within a particular frequency scale in both a qualitative and quantitative manner. Because MR spectroscopy analyzes selected frequencies, rather than a range of frequencies, the area examined with MR spectroscopy is larger than individual pixels as analyzed by MRI. In the bone marrow the focus of MR spectroscopy is the hydrogen nuclei (proton MR spectroscopy or 1H- MR spectroscopy), since hydrogen is by far the most abundant nucleus and emits the most intense radiofrequency signal. MR spectroscopy readout uses a parts-per-million scale to describe the position of the resonance frequencies on the x-axis.
34.2.2 Other Methods of Quantifying Marrow Fat
Other non-spectroscopic yet precise methods of quantifying fat fraction are available such as the three-point IDEAL (iterative decomposition of water and fat with echo asymmetry and least-squares estimation) or the 2-point Dixon method which involves sequential suppression or fat and water.
The accuracy of MR spectroscopic and non-spectroscopic methods in detecting the relative amount of water and fat in a sample has been tested against 11 different emulsions of increasing fat content. This study confirmed a high correlation (r 2 > 0.92) between MR methods of fat quantification and the percent fat volume fraction within test bottles (Bernard et al. 2008). The reproducibility of proton MR spectroscopy of the bone marrow has also been tested in a clinical setting (Griffith et al. 2009). Reproducibility of proton MR spectroscopy in all bone areas tested was high, ranging from 0.78 to 0.85, with the highest reproducibility being in those areas with the highest inherent fat content such as the femoral head and lowest in the femoral neck. Reproducibility of paired perfusion measurements ranged from 0.59 (enhancement slope femoral head) to 0.98 (enhancement maximum acetabulum). Overall reproducibility of (1)H MR spectroscopy and dynamic contrast-enhanced imaging tended to be best in areas with the highest inherent fat fraction or perfusion.
34.2.3 Imaging of Age-Related Physiological Changes in Bone Marrow Fat
Although an inverse relationship between increasing marrow fat and trabecular bone loss in senile osteoporosis has been recognized for 40 years (Dunnill et al. 1967), it has only recently, through the use of MR spectroscopy and other MR-based techniques, that marrow fat content can be quantified on a large scale (De Bisschop et al. 1993; Schellinger et al. 2000; Kugel et al. 2001; Jung et al. 2000; Liney et al. 2007; Chen and Shih 2006; Shih et al. 2004) and at different anatomical sites (Duda et al. 1995). Lifelong studies addressing physiological changes in marrow fat content show a gradual physiological increase in percentage marrow fat content with advancing years (Kugel et al. 2001; Griffith et al. 2012). An easily remembered approximation is that vertebral body marrow fat content increases from 25 % at 25 years of age to 65 % at 65 years of age (Kugel et al. 2001; Griffith et al. 2012). The mean volume of a lumbar vertebral body is about 16 ± 1.5 cm3.
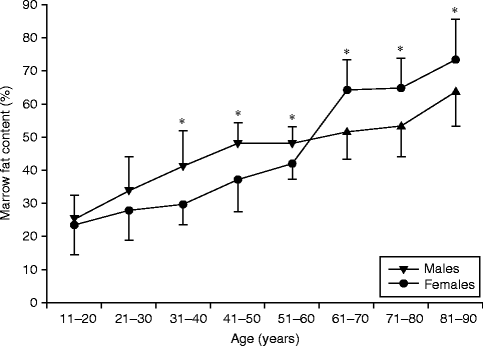
Over and above the increase in marrow fat content with age, MR-based studies have shown how a distinct sex difference in marrow fat content (Kugel et al. 2001; Griffith et al. 2012) exists. From the time of skeletal maturation to extreme old age, men show a gradual increase in marrow fat content of 7 % per decade throughout their life spans (Kugel et al. 2001; Griffith et al. 2012) (Table 34.1). In contrast women show a less steep increase in marrow fat of about 2–7 % up to 55 years though a dramatic increase in marrow fat content between the ages of 55 and 65 years (Kugel et al. 2001; Griffith et al. 2012) (Table 34.1, Fig. 34.5). Male vertebrae possess about 6–10 % more fat than female vertebrae of comparable age between the ages of 20 and 50 years (Kugel et al. 2001). Between 50 and 60 years, this sex difference narrows and disappears (Kugel et al. 2001). By 60 years of age, healthy women tend to possess about 10 % more marrow fat in their vertebrae than men (Griffith et al. 2012) (Table 34.1, Fig. 34.5).
Table 34.1
Fat content of lumbar vertebral bone marrow (%) grouped according to age (years) and sex
Age | 10–20 | 21–30 | 31–40* | 41–50* | 51–60* | 61–70* | 71–80* | 81–90* |
|---|---|---|---|---|---|---|---|---|
Men (%) | 24.6 | 33.5 | 41.4 | 47.6 | 47.7 | 64.2 | 64.7 | 73.2 |
Women (%) | 23.5 | 27.5 | 29.7 | 37.0 | 41.8 | 64.2 | 64.7 | 73.2 |
This sharp rise in marrow fat content in postmenopausal women may be due to a reduced need for hematopoietic marrow with cessation of menstruation. This, however, is not likely to be the dominant cause given that menstrual blood loss is generally quite low (median of about 43 ml/menstrual cycle) (Gao et al. 1987). The sharp increase in marrow fat content in early postmenopausal women may be due to relative estrogen deficiency, and, in this respect, the increase in marrow fat content does tally with changes in women’s fat distribution recognized to occur outside of bone at this time.
Although androgen and estrogen levels both decline in later years, estrogen levels fall particularly sharply in postmenopausal women, leading to a higher circulating androgen to estrogen ratio. This and other factors promote greater intra-abdominal or visceral fat, i.e., an android pattern of fat deposition in postmenopausal women (Toth et al. 2000; Blouin et al. 2008). This is different than the gynoid pattern of fat distribution seen in premenopausal women where fat tends to accumulate in the gluteal and thigh areas (Toth et al. 2000; Blouin et al. 2008). While there is no specific literature available on the relationship between estrogen and marrow fat content, it is known that visceral fat deposition (i.e., an android pattern of fat distribution) does correlate positively with marrow fat deposition (Bredella et al. 2011). It is feasible, therefore, that the increased marrow fat content seen in postmenopausal women may be the bone equivalent of android fat deposition. Android fat deposition is also associated with increased risk of cardiovascular disease and metabolic syndrome (Bredella et al. 2011). Marrow fat content in women remains consistently about 10 % higher than in men from 65 years to extreme old age. Even when bone mineral density and age are taken into account in logistic regression analyses, women over 65 years consistently have 10 % greater vertebral fat content than men (Griffith et al. 2012).
Similar findings were found using multivoxel chemical shift registration MRI to measure variation in the water fraction of the lumbar vertebral bone marrow with age and sex (Ishijima et al. 1996). The water fraction of bone marrow was calculated as 100× signal intensity of water voxel/signal intensity of water plus fat voxel. The water fraction for men was 75 % for young men, decreased to about 50 % for middle-aged men, and remained almost constant in later years (Table 34.2, Fig. 34.6) (Ishijima et al. 1996). Conversely in women, the water fraction for young women remained fairly constant at around 45 % but decreased quite rapidly in later years (Table 34.2) (Ishijima et al. 1996). This tallies quite closely with the lifetime age and sex MR spectroscopy data on percent fat content previously discussed, with an increase in fat content particularly in elderly women since fatty marrow contains much less water (∼ 5 %) than red marrow (∼35 %) (Hwang and Panicek 2007).
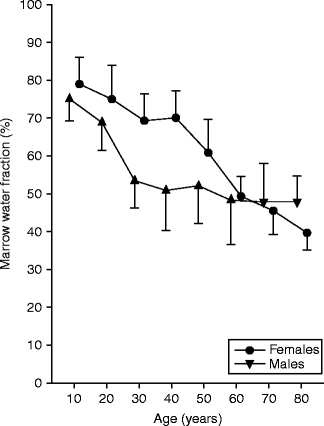
Table 34.2
Water fraction of bone marrow (%) grouped according to age (years) and sex
Age | 5–14 | 15–24* | 25–34* | 35–44* | 45–54* | 55–64 | 65–74 | 75–84* |
|---|---|---|---|---|---|---|---|---|
Men | 75.2 | 69.0 | 53.7 | 51.1 | 52.9 | 48.8 | 48.1 | 48.2 |
Women | 78.9 | 75.0 | 69.3 | 70.9 | 61.1 | 49.7 | 46.0 | 39.7 |

Fig. 34.6
Marrow water content (%) stratified for age and sex (Ishijima 2006)
While the above studies have focused on the lumbar vertebral body, other studies indicate that similar trends are to be been in the sacrum (Duda et al. 1995) and the proximal femur (Ishijima et al. 1996). Overall, there is at least a 40–50 % increase in fat cell content with increasing age. This increase in fat cell volume occurs primarily at the expense of functioning marrow volume. Although the trabecular volume decreases with age, the overall percentage decrease in trabecular volume is only approximately 5 % in volume. Since the marrow cavity is a defined space and bone vasculature do not seem to expand with age, one can infer that for any increase in fat cell content, there is almost a corresponding decrease in functioning marrow content.
34.3 Bone Marrow Perfusion
Cortical bone receives the majority (approximately two-thirds) of its blood supply from the medulla and the remainder from the periosteal arteries (Knothe Tate et al. 1998). The marrow cavity is supplied by larger nutrient arteries that pass through the cortical bone (Travlos 2006). Ascending and descending nutrient branches give rise to small thin-walled arterioles extending towards the endosteal margin of the cortex. These arterioles anastomose with a plexus of large thin-walled venous sinuses composed of flat endothelial cells with a discontinuous highly permeable basement membrane (Travlos 2006; Lichtman 1981). The venous sinuses drain via collecting venules back to the nutrient or emissary veins. This structural arrangement leads to a higher number of vessels and sinuses in the periphery and also slower flow at the periphery of the marrow cavity. Bone trabeculae do not contains vessels and are dependent on the adjacent marrow for their nutrients.
Blood flow is flow within vessels, i.e., intravascular flow. Perfusion, on the other hand, is a measure of blood flow together with capillary permeability and interstitial diffusion. Perfusion therefore is dependent on a host of other variables such as capillary surface area, capillary exchange, interstitial space, interstitial pressure, interstitial diffusion, and venous flow. In a study of ten young patients, estimated lower vertebral body blood flow as assessed by PET and a 15O-labeled CO2 steady-state technique was approximately 15 ml/min/100 g of healthy bone marrow (Kahn et al. 1994).
34.3.1 Bone Perfusion Assessed by MRI
MRI is the most widely used method of assessing tissue perfusion. Dynamic contrast-enhanced MRI (or MR perfusion imaging) involves the rapid acquisition of serial MRIs before, during, and after the administration of a contrast agent. Gadolinium chelate contrast agents rapidly diffuse into the extravascular interstitial space (also called the leakage space), at a rate determined by blood flow, capillary permeability, capillary surface area, and interstitial pressure, interstitial space, and interstitial flow. T1-signal intensity increases proportionately to the concentration of gadolinium chelate. Pharmacokinetic modeling ideally requires a nearly linear relationship between gadolinium chelate concentration and signal intensity. Exact linearity is never achieved and can only be approximated with low doses of gadolinium chelate (Donahue et al. 2006). Dynamic contrast-enhanced MRI permits a depiction of the wash-in and wash-out contrast kinetics within the tissue under investigation. Dynamic contrast-enhanced MRI or perfusion imaging is a very robust imaging technique which can be applied to almost any tissue. Empirical measures such as maximal signal intensity enhancement (E max) and enhancement slope (E slope) can be readily obtained (Fig. 34.7). Reproducibility of bone marrow dynamic contrast-enhanced MRI perfusion parameters has been tested and found to be sufficiently high, ranging from 0.59 to 0.98, with reproducibility highest in those areas with the highest inherent bone marrow perfusion (Griffith et al. 2009).
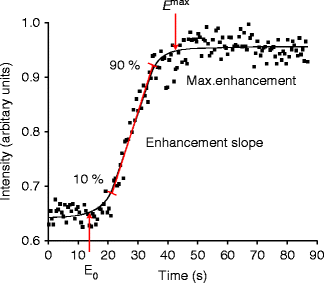

Fig. 34.7
Time-intensity curve with E max and E slope. E max represents maximum enhancement while E slope represents the slope of the rapidly uprising part of the curve
E slope and E max are derived from the first-pass phase of signal intensity enhancement and are considered to represent arrival of contrast material into the arteries and capillaries and its diffusion into the extracellular space. Although E slope and E max represent indices of perfusion, they are not in themselves a direct measure of perfusion. Nevertheless, they have been shown to be strongly predictive of tissue vascularity, microvessel density, and tissue necrosis (Choyke et al. 2003; Knopp and Cowper 2008). In simple terms, one could equate E slope more with the ability to deliver gadolinium to the tissues and thus dependent more on vascular supply, capillary network size, and permeability, while E max will be dependent on these factors though also on the perfusion demands of the tissues being investigated.
E slope and E max represent the easiest methods of analyzing perfusion data using time-intensity curves. Perfusion data acquired from dynamic contrast-enhanced MRI is also amenable to two-compartment pharmacokinetic modeling (either Tufts model or Brix model). The Tufts model (Fig. 34.8a) analyzes the concentration of contrast in the tissues using a combination of arterial input function and rate constants K trans, K ex, and K el. Arterial input function can be assessed by knowing the first-pass intensity profile of the feeding artery. K trans refers to the transport constant and is influenced primarily by blood flow. K ex


Stay updated, free articles. Join our Telegram channel

Full access? Get Clinical Tree


