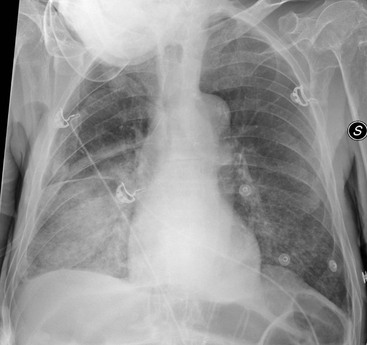
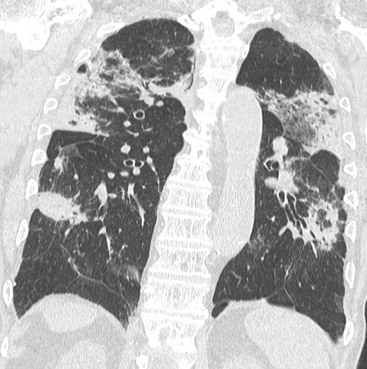
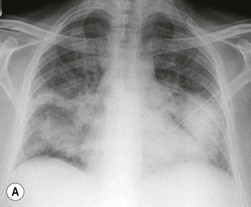
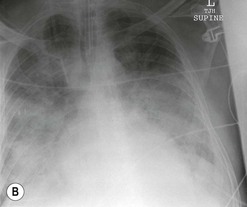
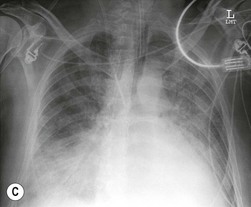
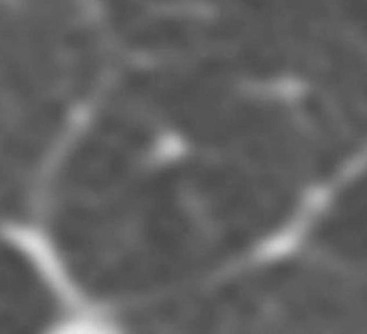
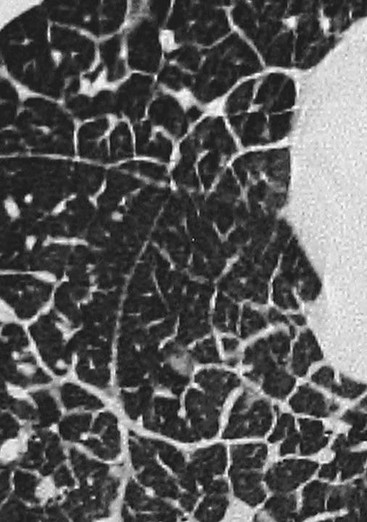
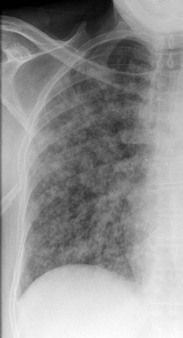
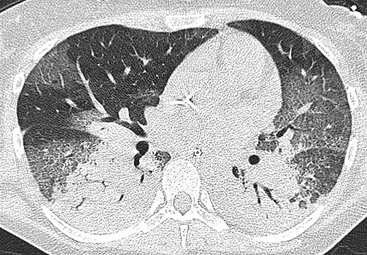
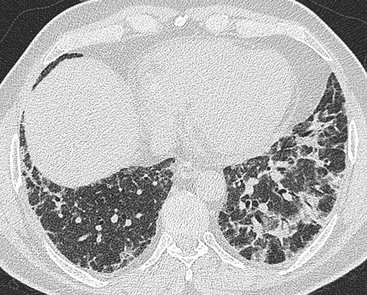
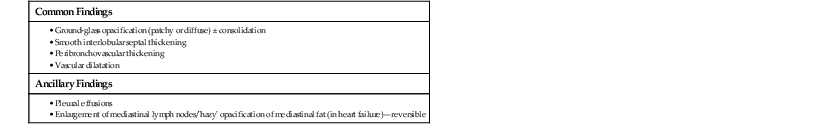
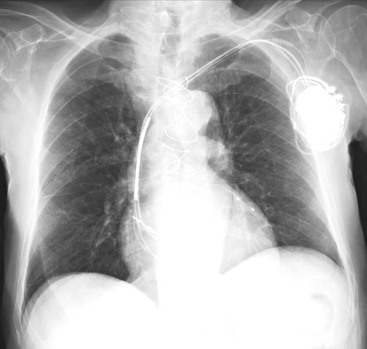
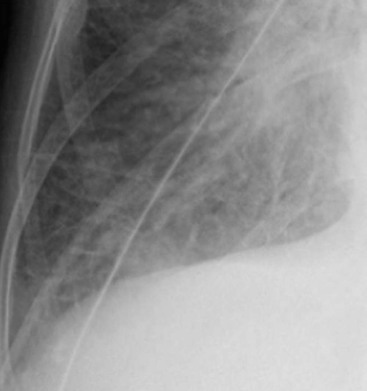
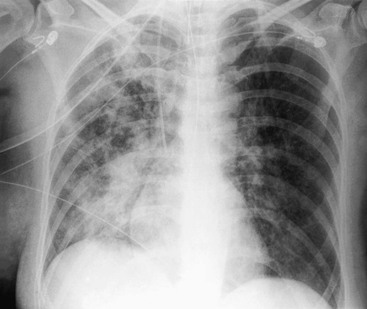
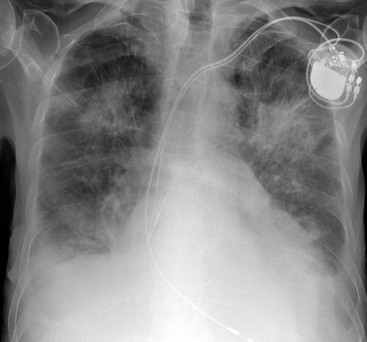
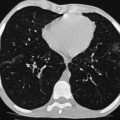
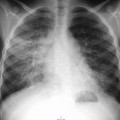
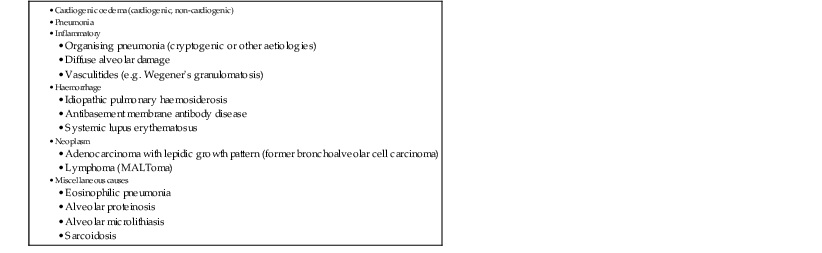
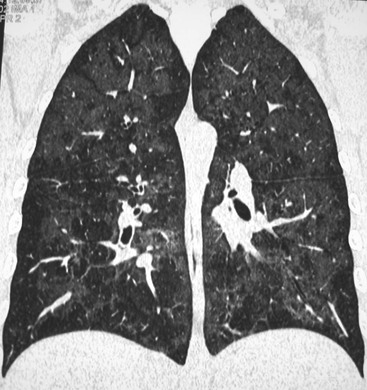
Nicola Sverzellati, Sujal R. Desai Diseases that principally involve the airspaces are common but the radiological approach to diagnosis is potentially daunting since opacification of the air spaces is a non-specific sign (Table 18-1). Any pathological process that displaces air from the alveoli will be depicted as airspace opacification but this pattern is most commonly seen when either fluid accumulates (as in pulmonary oedema) or there are inflammatory cells (as with infection) in the airspaces. This chapter considers some of the common and a few of the more unusual causes of airspace opacification in clinical practice. Airspace diseases caused by infection and cancer are considered in detail elsewhere (see Chapters 12 and 15). TABLE 18-1 Causes of Airspace Opacification The plain chest radiograph is often the first investigation clinicians will request. With experience, the radiologist can usually offer a sensible diagnosis or, at worst, a limited list of differential diagnoses. For this, an appreciation of the clinical background, the distribution of radiographic abnormalities and changes, if any, on serial examination are invaluable. It perhaps goes without saying that the imaging appearances must be considered in the clinical context and this may be diagnostic in some patients. For instance, lobar opacification in a patient with pyrexia and a productive cough is most likely to be caused by infection (Fig. 18-1). Alternatively, when there is known left ventricular dysfunction the likely cause of bilateral airspace opacification is pulmonary oedema. The distribution of airspace opacities on plain radiographs may be a differentiating feature: in cryptogenic organising pneumonia (COP), areas of consolidation tend to be more pronounced in the periphery and lower zones (Fig. 18-2).1 By contrast, in chronic eosinophilic pneumonia, the typical finding is of upper zone infiltrates which parallel the chest wall.2 A review of serial radiographs is an important part of the radiologist’s routine. Rapid clearing—occurring over a period of hours or, at most, a few days—suggests oedema fluid (Fig. 18-3) or pulmonary haemorrhage as the likely cause as opposed to, say, pneumonia. Opacities that are transient and migratory, in a patient with constitutional symptoms, should at least make the radiologist think about a diagnosis of an eosinophilic pneumonia. Computed tomography (CT) is frequently requested in patients with airspace disease and, occasionally, the CT features will be characteristic. One possible example is the so-called ‘crazy-paving’ pattern, which, in its classical form, is virtually diagnostic of alveolar proteinosis.3,4 However, in other instances, the radiologist may only be able to limit the list of diagnostic possibilities despite the additional information from CT (e.g. cavitation that may not have been evident on plain radiographs is only shown by CT). Therefore, except certain circumstances, the advantages of CT over plain radiography in the diagnosis of airspace diseases are not clearly defined.5 The air spaces are defined as the air containing part of the lung which includes the respiratory but not the terminal bronchioles. The latter are the last purely conducting airways of the bronchial tree and the region of lung subtended by a terminal bronchiole is the acinus.6 Important pathways of collateral ventilation (the pores of Kohn) link different alveolar units and can help to maintain lung inflation in the presence of proximal airway obstruction.7 These normal collateral pathways also facilitate the spread of certain diseases (most notably infections) into adjacent alveolar units. Another important unit of lung structure is the pulmonary lobule, defined as the smallest unit of lung bounded by connective tissue septa.8 Individual lobules are irregular polyhedrons, best seen subpleurally, measuring between 5 and 30 mm in diameter, and incorporating between 3 and 24 acini;9 the lobular bronchiole and adjacent artery form the core structures. Normal centrilobular arteries (with a maximum diameter of 0.2 mm) can be seen on high-resolution computed tomography (HRCT), but the wall of the accompanying bronchiole is too thin to be resolved10 (Fig. 18-4). The corollary is that bronchioles visible within the 2-cm subpleural space indicate wall thickening, dilatation and/or endobronchiolar filling. Infiltration of the interlobular septa by oedema fluid or malignant cells or thickening caused by fibrosis will render individual pulmonary lobules visible on HRCT11 (Fig. 18-5). One of the principal limitations of imaging studies is that a multitude of pathological processes in the air spaces manifest in only a limited number of ways: thus, for most airspace diseases, a modular pattern, ground-glass opacification and consolidation represent the range of radiological abnormalities. 1. A nodular pattern as a sole manifestation of airspace disease is relatively uncommon. Historically, the term ‘acinar nodules’ or ‘acinar rosettes’ has been used to describe the appearance of poorly defined infiltrates on chest radiography and HRCT.12,13 The diagnostic value of localising disease to the acinus has been questioned; in pathological studies, the acinar pattern on plain radiographs does not correspond to the filling of acini as defined anatomically.14 This notwithstanding, the so-called acinar pattern is most frequently encountered in the context of bacterial infection or pulmonary haemorrhage (Fig. 18-6).15 2. Ground-glass opacification is a relatively common sign of airspace disease. On plain radiography, ground-glass opacification is seen as hazy increased lung opacity, usually extensive, in which the margins of pulmonary vessels may be indistinct.13 Because of the greater contrast resolution, ground-glass opacification on CT appears as a hazy increase in lung attenuation but without obscuration of bronchial and vascular markings (Fig. 18-7).13 It is important to remember that ground-glass opacification is a non-specific sign that can be a manifestation of airspace and/or interstitial disease (Fig. 18-8).16 On occasion, ground-glass opacification on CT may be barely perceptible. In such cases, a noticeable difference between the density of air in the lumen of an airway and that in the adjacent lung (the ‘black bronchus’ sign) may be the clue needed to confirm suspicion of lung infiltration: normally, the two densities will be roughly equal (Fig. 18-9). 3. Consolidation refers to the increase in lung density on chest radiography or CT in which the margins of vessels and airways are obscured (Fig. 18-10). An air bronchogram may be seen. This radiological pattern occurs when air in the air spaces is replaced by any pathological process (e.g. inflammatory cells, blood or tumour). In some patients, a characteristic perilobular distribution (giving the spurious impression of thickened interlobular septa) may be seen (Fig. 18-11). On thin-section CT, a perilobular pattern manifests as curvilinear opacities (of greater thickness and less well-defined than interlobular septa), producing an arcade-like appearance.13,17 This distribution reflects a pathological process that is ‘smeared’ around the margins of the lobule as is seen in organising pneumonia. Pulmonary oedema—defined as an excess of extravascular lung water—may be due to an increase in hydrostatic pressure (sometimes called cardiogenic oedema) or vascular permeability (termed non-cardiogenic oedema) (Table 18-2). Despite the attraction of simplicity, the clinical utility of this dichotomous classification of pulmonary oedema has been questioned.18,19 This notwithstanding, hydrostatic oedema occurs when there is a shift of fluid out of the vascular compartment caused by an increase in venous/capillary pressure. A common cause of increased hydrostatic pressure is left heart failure but, rarely, a reduction in plasma osmotic pressure (e.g. in hypoalbuminaemic patients) will lead to pulmonary oedema. Non-cardiogenic pulmonary oedema occurs in conditions where the permeability of the alveolar–capillary barrier is increased. The archetypal example of increased permeability oedema is acute respiratory distress syndrome (ARDS). Plain chest radiography is more sensitive than clinical examination for the early detection of pulmonary oedema.20 Because there is a roughly predictable sequence, with fluid first passing into the interstitium and then into the alveoli, the radiographic changes of interstitial oedema generally precede frank airspace opacification.21 In the following sections, the radiographic features of pulmonary oedema are considered; for clarity the vascular, interstitial and intra-alveolar changes are discussed separately. The signs of raised pulmonary venous pressure on chest radiography are well documented, although the mechanisms underlying blood flow redistribution are not entirely clear. Signs of vascular redistribution (from bases to apex), namely balanced flow or inverted flow, often suggest elevation of the pulmonary venous pressure (Fig. 18-12). Both vascular dilation and redistribution are more appreciable in chronic or, at least, subacute left heart dysfunction.19,22 The ratio of the diameter of adjacent pulmonary arteries and bronchi seen end-on, particularly at the level of the upper lobes, aids in determining whether vessels are abnormally enlarged.23 One of the classical radiographic manifestations of interstitial oedema is thickening of the interlobular septa. The characteristic Kerley B lines, which represent fluid in the interlobular septa (typically 1–2 mm wide and 30–60 mm long), are only really seen in the subpleural lung, perpendicular to the pleural surface (Fig. 18-13). By comparison, Kerley A lines are longer (up to 80–100 mm), occasionally angulated and cross the inner two-thirds of the lung in varying directions but tend to point medially towards the hilum. In left heart failure, septal lines become visible as they distend with extravascular fluid. Naturally, the visualisation of oedematous septal lines will be hampered if neighbouring alveoli are also opacified. It should also be remembered that the demonstration of thickened interlobular septa is not diagnostic of pulmonary oedema; fibrosis and malignant infiltration (as in lymphangitis carcinomatosa) will also increase the conspicuity of interlobular septa. Another sign of interstitial oedema on frontal chest radiographs is peribronchial cuffing in which the normally thin and well-defined wall of the airway appears thickened and indistinct. A loss of conspicuity of the central pulmonary vessels (termed a perihilar haze) also occurs and, as with peribronchial cuffing, is assumed to be caused by oedema of the perivascular interstitium. Oedema fluid can also collect in the potential space between the visceral pleura and lung; on chest radiography this may be seen as thickening of the interlobar fissures or as a lamellar ‘effusion’ in the costophrenic recesses. The latter, despite the name, indicates fluid between the lung and visceral pleura.24 Airspace opacification becomes visible on the chest radiographs as oedema fluid passes from the interstitium into the alveoli. The distribution of changes is variable but bilateral opacification is the norm. However, an asymmetric distribution (Fig. 18-14) or oedema apparently confined to one lung on chest radiographs also occurs.25 There may be sparing of the apices and extreme lung bases. On occasion, the central lungs are more affected, producing the so-called ‘bat’s wing’ distribution (Fig. 18-15).26 As oedema progresses, opacities coalesce to produce a general ‘white-out’. An air bronchogram or alveologram may be seen when there is intra-alveolar oedema. The severity of airspace opacification caused by pulmonary oedema can change relatively quickly; indeed, the speed of change (i.e. sometimes over hours as opposed to days or weeks) is a useful pointer to the diagnosis of oedema fluid rather than another airspace pathology. In specific settings, the radiographic appearances of intra-alveolar oedema will be modified. For instance, the distribution of pulmonary oedema can vary with posture so that in patients lying on one side for a prolonged period, the dependent lung becomes more oedematous and there is unilateral airspace opacification.27 Coexisting diseases such as emphysema will also affect the distribution and appearance of oedema fluid. Similarly, in patients with pulmonary fibrosis, there may be more rapid fluid accumulation in the alveolar spaces than within the interstitium.28 Making the distinction between hydrostatic and permeability oedema is of clinical value. In this regard, chest radiography is more reliable than physical examination.29 However, whether chest radiography can consistently differentiate between cardiogenic and non-cardiogenic oedema is doubtful.30,31 In one early study, the distribution of blood flow (i.e. upper zone versus lower zone) and oedema (i.e. peripheral versus central) together with the width of the vascular pedicle were considered to be discriminatory.30 In 50% of patients with hydrostatic oedema there was upper lobe blood diversion. By contrast, in patients with non-cardiogenic oedema caused by ARDS, only 10% showed this inverted pattern: normal or ‘balanced’ flow was the more common finding.30 A peripheral distribution of oedema was strikingly absent in patients with hydrostatic oedema but was the most common pattern in patients with ARDS. Based on these findings and some ancillary features, the authors claimed an overall accuracy for chest radiography of 86–89%.30 Over time, this conclusion has been questioned:31,32 although there is high specificity for the finding of patchy or peripherally distributed oedema in increased permeability oedema, Aberle et al. concluded that the sensitivity was below 50%.31 Similarly, the discriminatory value of signs of interstitial fluid accumulation and pleural effusions has been questioned.31,33 In summary, analysis of the radiographic pattern will sometimes allow a distinction to be made but the inconsistency of radiographic signs suggests that radiographic distinction between the various forms of pulmonary oedema is unreliable.
Airspace Diseases
Introduction
An Approach to the Radiological Diagnosis of Airspace Diseases
Anatomical Considerations
Radiological Signs of Airspace Disease
Pulmonary Oedema
Chest Radiography in Pulmonary Oedema
Vascular Changes
Interstitial Oedema
Alveolar Oedema
Radiographic Differentiation of Cardiogenic and Non-Cardiogenic Pulmonary Oedema
CT in Pulmonary Oedema
Related posts:
![]()
Stay updated, free articles. Join our Telegram channel

Full access? Get Clinical Tree


Airspace Diseases
Chapter 18