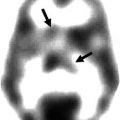
Fig. 6.1
The same contrast analysis, motor task versus control task, resulted in markedly different activation patterns depending on the time interval that was analyzed (indicated by white bars). Small arrows in the glass brains indicate the voxel with the highest t-value. All results are thresholded at p uncorrected < 0.001
6.2.4 Statistical Analysis
Data from all experimental tasks were modeled with a general linear model, with a proportional scaling step. Volunteers and experimental tasks were modeled as factors (multi-subject: conditions and covariates). Contrast images between motor task and control task were calculated for all the different time intervals. Statistical threshold was set to p < .001, uncorrected for multiple comparisons. Glass brains with activated voxels as a function of the selected time interval are presented in Fig. 6.1. The size of reported and displayed clusters is at least eight voxels.
We used the number of activated voxels in the activated clusters and its Z value as a primary outcome (Fig. 6.2).
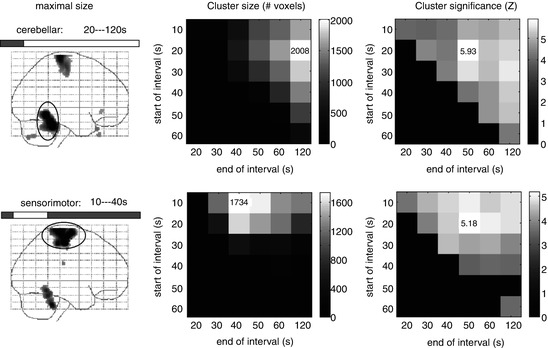

Fig. 6.2
The same contrast analysis, motor task versus control task, resulted in different results, depending on the time interval that was analyzed. Two clusters (first column) had different sizes (middle column) and different statistical significance (last column) depending on the period. The largest activation in sensorimotor cortex was found for the period 10–40 s while for cerebellar it was obtained for 20–120 s. The statistical power for both clusters was maximal for the period 20–50 s
Finally, we constructed time-activity curves (TACs) for the activated clusters in order to verify and illustrate the results from SPM comparison of the different intervals (Fig. 6.3). With the program Amide (http://amide.sourceforge.net/), TACs were constructed as follows. First, ellipsoid ROIs were drawn over the activated foci in the sensorimotor area (22.6 mL) and the cerebellum (19.0 mL) on a subject by subject basis. To correct for injected radioactivity dose per scan, we used an ellipsoid covering the whole brain (3.11 L), calculated the mean radioactivity concentration over the final five frames, and divided all time points in the sensorimotor and cerebellar ROI by this value.
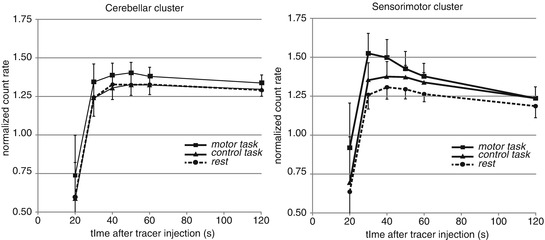

Fig. 6.3
Average time-activity curves (TACs) for the two activated clusters in relation to the tasks: in the motor condition the sensorimotor cluster is more dynamic and reaches a higher radioactivity concentration. Count rates were normalized intrascan to the average whole-brain activity concentration in the last five frames. Error bars indicate standard deviations over subjects
We performed ANOVA repeated measures (SPSS 12.0.2, Chicago, IL, USA) on the TACs with region, task, and time as factors.
6.3 Results
6.3.1 SPM Analysis
Figure 6.1 shows the intervals that were compared (in white) along with the brain activation patterns (t-distribution maps in a lateral glass brain) that resulted from all of these comparisons.
Two robust brain activation loci were present for in the majority of compared intervals: the dorsal sensorimotor cortex and the medial part of the anterior cerebellum. As can be seen in the top rows of this figure, significant rCBF differences were also found with the shortest duration of the time period: 10 s. The 10 s interval that resulted in the largest activation was 30–40 s after injection of the radiotracer. The period compared clearly had a strong influence on the activation maps: both activation clusters were highly variable and the sensorimotor cluster was sometimes completely absent (for periods 50–60 and 50–120 s).
The sizes of the two clusters were very dependent on the time interval compared, and, moreover, the period resulting in maximum cluster size was very different for the two clusters. Figure 6.2 gives a matrix representation of the interval dependency of cluster size (middle column) and cluster significance (far right column).
For the cerebellar cluster, the maximum size was 2,008 voxels, which was reached by comparing 20–120 s after tracer injection between the two conditions (motor and control). However, the cerebellar cluster reached its highest significance (Z = 5.93) for the period 20–50 s (top right in Fig. 6.2).
For the sensorimotor cluster, the maximum size was 1,734 voxels, but this was reached for a completely different interval: 10–40 s rather than 20–120 s. Not only is the optimum period much earlier, it is also much shorter for the sensorimotor cluster.
The highest significance (Z = 5.18) for this cluster is, now identical to that for the cerebellum, found for the period 20–50 s (bottom right in Fig. 6.2).
6.3.2 TAC Analysis
TACs for the two regions are presented in Fig. 6.3. Visual inspection shows clear differences between the two anatomical areas. ANOVA repeated measures of the TACs confirmed this impression, revealing in addition to a strong time effect [F(5) = 49.63, p = 0.02] a strong interaction of time and region [F(5) = 30.49, p = 0.032]. (Interactions time × task and time × task × region could not be investigated due to lack of residual degrees of freedom.)
Stay updated, free articles. Join our Telegram channel

Full access? Get Clinical Tree


