◊ >90% of nipples contain 5–9 ductal orifices
(b) multiple other blind-ending orifices: connected to sebaceous glands of 1–4 cm in length
√ bilateral symmetric enhancement pattern of normal nipple:
√ 1–2 mm superficial layer of intense linear enhancement
√ underlying region of nonenhancement deep to dermis
Ducts
lactiferous ducts coalesce in subareolar region into 5–8 mm wide lactiferous sinuses exiting in the central portion of nipple; organized into
(a) central ducts: extending to chest wall
(b) peripheral ducts: arranged in a radial fashion
Main lactiferous duct → branches dichotomously into segmental duct → subsegmental duct → terminal duct → blunt-ending acinus
Terminal Duct Lobular Unit (TDLU)
(1) Extralobular terminal duct
Histo: lined by columnar cells + prominent coat of elastic fibers + outer layer of myoepithelium
(2) Lobule
(a) intralobular terminal duct
Histo: lined by 2 layers of cuboidal cells + outer layer of myoepithelium (for milk propulsion)
Significance: invasive ductal, papillary, mucinous, medullary adenoid cystic cancers arise from ductal epithelium in TDLU and most commonly appear as spiculated irregular masses ± calcifications / developing asymmetries
(b) ductules / acini
(c) intralobular connective tissue
Size: 1–2 (range, 1–8) mm in diameter
Change:
(a) reproductive age: cyclic proliferation (up to time of ovulation) + cyclic involution (during menstruation)
(b) post menopause: regression with fatty replacement
Significance:
TDLU is the site of fibroadenoma, epithelial cyst, apocrine metaplasia, adenosis (= proliferation of ductules + lobules), epitheliosis (= proliferation of mammary epithelial cells within preexisting ducts + lobules), ductal + lobular carcinoma in situ, infiltrating ductal + lobular carcinoma
Components of Normal Breast Parenchyma
1. Nodular densities surrounded by fat
(a) 1–2 mm = normal lobules
(b) 3–9 mm = adenosis
2. Linear densities
= ducts and their branches + surrounding elastic tissue
3. Structureless ground-glass density
= stroma / fibrosis with concave contours
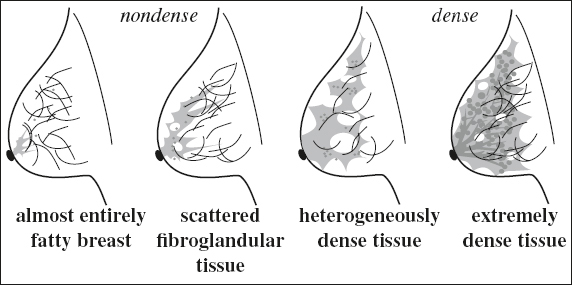
Parenchymal Breast Pattern (László Tabár)
Effect of breast density on sensitivity:
women in their 40s have a 68% higher risk of a FN screening mammogram compared to older women
Recommendation: perform mammography during 1st week of menstrual cycle
Inter- and intraobserver variability on breast density:
› low reliability of interreader density agreement (κ = 0.59)
› imperfect intrareader agreement (κ = 0.72)
Factors affecting breast density between mammograms:
body mass index, weight changes, age, HRT, dietary intake
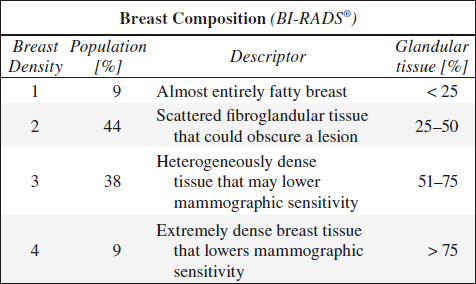
Overall odds ratio of breast cancer for > 75% tissue density:
› compared to 10% density 4.74
› with interval cancer developed in 1 year 17.81
Relative risk of cancer associated with breast density:
› breast tissue density of 50–74% 2.92
› breast tissue density of > 75% 4.64
Pattern I
named QDY = quasi dysplasia (for Wolfe classification)
√ concave contour from Cooper’s ligaments
√ evenly scattered 1–2 mm nodular densities (= normal terminal ductal lobular units)
√ oval-shaped / circular lucent areas (= fatty replacement)
Pattern II
similar to N1 (Wolfe)
√ total fatty replacement
√ NO nodular densities
Pattern III
similar to P1 (Wolfe)
√ normal parenchyma occupying < 25% of breast volume in retroareolar location
Pattern IV = adenosis pattern
similar to P2 (Wolfe)
Cause: hypertrophy + hyperplasia of acini within lobules
Histo: small ovoid proliferating cells with rare mitoses
√ scattered 3–7 mm nodular densities (= enlarged terminal ductal lobular units) = adenosis
√ thick linear densities (= periductal elastic tissue proliferation with fibrosis) = fibroadenosis
√ no change with increasing age (genetically determined)
Pattern V
similar to DY (Wolfe)
√ uniformly dense parenchyma with smooth contour (= extensive fibrosis)
Enhancement of Normal Parenchyma on MR
= Background Parenchymal Enhancement (BPE)
◊ Breast enhancement does NOT correlate with breast density
• varies among women + within same woman over time
Proper enhancement present if:
› veins contrasted on MIP
› both internal mammary arteries depicted
› nipple enhances
Common pattern of enhancement:
√ bilateral symmetric diffuse enhancement:
√ slow minimal / early enhancement
√ persistent delayed enhancement
√ linear patchy enhancement
√ confluent enhancement on late dynamic scan
Distribution of enhancement:
√ bilateral symmetric enhancement with
(a) moderate / marked degree of BPE
(b) diffuse / regional distribution
(c) homogeneous / internally stippled
√ “picture framing” of vascular inflow = enhancement commonly begins in periphery + gradually becomes apparent in more central breast tissue
√ scattered innumerable 9–10 mm foci of enhancement
√ geographic areas of symmetric regional enhancement
√ multiple larger symmetric areas of enhancement (DDx: asymmetry suggest malignancy)
BPE Effect on Interpretation of MR Images:
1. Falsely positive ← focal / regional / asymmetric background parenchymal enhancement
2. Falsely negative ← moderate / marked BPE
Classification of Background Parenchymal Enhancement:
| Minimal | < 25% of glandular tissue |
| Mild | 25–50% |
| Moderate | 50–75% |
| Marked | > 75% |
Hormonal Influence on BPE
1. Menstruation
√ enhancement high during days 21–28 and days 1–6 after menstruation + low during days 7–20
2. Lactation
◊ Breast involution after lactation takes 3 months
Note: NO impairment in cancer detection in lactating patients!
Breast-feeding: safe after contrast-enhanced MRI ← minute amounts of Gd in breast milk
3. Postmenopausal period without HRT
√ decrease in fibroglandular tissue → degree of BPE typically less than that in premenopausal women
4. Hormone replacement therapy (HRT)
√ increase in BPE in amount + degree + distribution with great interindividual variations:
◊ Hormonal effect reverses after 30–60 days
5. Endocrine antihormonal therapy
Antiestrogenic agents: selective estrogen receptor modulators, aromatase inhibitors
√ significant decrease in amount of fibroglandular tissue + cysts + BPE
√ effect on BPE evident early in treatment (< 90 days)
√ tamoxifen rebound after medication discontinued:
√ global / focal increase in BPE
6. Oophorectomy → decrease in BPE
MRI preferably performed during 2nd week of menstrual cycle!
Related posts:


Stay updated, free articles. Join our Telegram channel

Full access? Get Clinical Tree


