Fig. 1
Typical magnetic responses obtained when noxious stimuli were applied and their source localizations (Single subject). Adopted from Nakata et al. (2004). cSI contralateral SI, cSII contralateral SII, iSII ipsilateral SII, L left, R right. This figure has been reproduced with the permission of the International Association for the Study of Pain (IASP). The figure may not be reproduced for any other purpose without permission
SI consists of three cytoarchitectural subdivisions, areas 3, 2, and 1. Anatomical studies have demonstrated that information from the deep body tissues such as muscles and joints reach areas 3a and 2, while areas 3b and 1 receive information from the skin (Hyvärinen and Poranen 1978; Iwamura et al. 1993; Powell and Mountcastle 1959; Kandel 2000). Consistent with these anatomical studies, MEG studies showed that source localizations in SI for tactile stimuli were estimated to be area 3b and 1 (Ploner et al. 2000; Kakigi et al. 2000; Kida et al. 2007). Area 3b responded to innocuous somatosensory stimuli 20–30 ms after the stimulus onset (Wood et al. 1985; Allison et al. 1989a, b; McCarthy et al. 1991) and area 1 responded later than area 3b (Ploner et al. 2000; Inui et al. 2003). In contrast, pain studies using MEG reported that only area 1 responded to noxious stimuli (Ploner et al. 1999; Kanda et al. 2000; Inui et al. 2003). However, single unit recordings in monkeys showed nociceptive SI neurons in areas 3b and 1 (Kenshalo and Isensee 1983). One possibility to explain why the magnetic response in area 3b was not observed in previous MEG studies may be due to the lower number of neurons in area 3b than in area 1 (Chudler et al. 1990). In previous MEG studies that observed area 3b response to tactile stimuli, median nerve stimulation was used as the tactile stimuli. On the other hand, pain studies using MEG used laser stimuli. The area to be stimulated was a tiny spot for laser stimuli, while a much larger skin area was stimulated for the median nerve stimulation. Thus, the total number of neurons in area 3b that responded to the nerve stimulation may have been much higher than that responding to the laser stimuli. This may be another reason for the lack of a clear response in area 3b to noxious stimuli. Unfortunately, there is currently no clear evidence to explain the discrepancy between single unit recordings and pain studies using MEG.
2.2 Peak Latency
The peak latency of painful stimuli-evoked magnetic responses in the contralateral SI, contralateral SII, and ipsilateral SII reported in previous MEG studies were 164–217, 160–212, and 169–213 ms, respectively (Ploner et al. 1999, 2000, 2002; Kanda et al. 2000; Nakata et al. 2004). A human microneurography study demonstrated that the conduction velocity (CV) of Aδ-fibers was about 19 ms (Adriaensen et al. 1983). In a monkey study, the CV of the spinothalamic tract (STT) was found to be 8.0 ms by determining STT neurons with antidromic activation in the contralateral posterior part of the ventral medial nucleus in the thalamus (Dostrovsky and Craig 1996). Similar CVs were reported in a human study in which the CV of the STT using laser-evoked potentials was estimated to be approximately 8–10 ms (Kakigi and Shibasaki 1991). In addition, the CV of thalamocortical fibers was estimated to be 33 ms based on the somatosensory evoked potentials of electric stimulation (Desmedt and Cheron 1980). Based on CVs, it takes over 110 ms for the signals evoked by laser to be transmitted from the hand to the cerebral cortex. On the other hand, the CV of C-fibers and STT associated with C-fibers are 1.2–2.4 ms (Towell et al. 1996; Magerl et al. 1999; Tran et al. 2001) and 2.9 ms (Tran et al. 2002), respectively, based on laser-evoked potential studies. Thus, it takes over 500 ms for signals to be transmitted from the hand to the cerebral cortex. The peak latency of the magnetic responses observed in the previous MEG studies was about 200 ms. Thus, magnetic responses are suggested to be derived from the excitation of Aδ-fibers. Kakigi et al. (1995) compared the peak latency and source location (i.e., dipole) of painful stimuli-evoked magnetic responses when a CO2 laser was applied to the arm compared to when it was applied to the leg. They observed that the peak latency for the stimulation of the leg was 50 ms longer than that of the arm. This difference was attributed to the distance between the leg and brain being longer than that between the arm and brain. In all previous pain studies using MEG, peak latency was shorter for the contralateral SII than for the ipsilateral SII (e.g., Yamasaki et al. 1999; Ploner et al. 2000, 2002; Kanda et al. 2000; Nakata et al. 2004, 2008, 2009). The difference in latency between contralateral and ipsilateral SII was 1–25 ms (mean: 13.8 ms) in these studies. Ploner et al. (2000) reported that differences in peak latency between the contralateral and ipsulateral SII for tactile and laser stimuli were 11 and 15 ms, respectively. Similar values were also observed in other MEG studies (e.g., Mauguière et al. 1997). The difference in peak latency has been interpreted to reflect the time to transmit a neural signal from the contralateral SII to the ipsilateral side.
2.3 Intensity Coding of SI and SII
Pain is a complex sensation composed of sensory-discriminative and motivational-affective components. SI and SII are considered to be the main regions for the sensory-discriminative component. Animal studies have demonstrated that there are neurons responsive to nociceptive stimuli in SI and most of the neurons encode the stimulus intensity of noxious stimuli (Chudler et al. 1990; Kenshalo and Isensee 1983; Kenshalo et al. 1988). Unit recoding studies in monkeys have demonstrated that the intensity coding of neurons responsive to noxious stimuli in SII appeared to be poorer than that in SI (Dong et al. 1989, 1994). Analogous to these animal studies, a MEG study observed that the relationship between SI activity and stimulus intensity closely matched the subjects’ pain ratings, while SII activity exhibited an S-shaped function with a sharp increase in amplitude only at a stimulus intensity well above the pain threshold (Timmermann et al. 2001). Similar results were also reported in human fMRI and intracranial recoding studies (Bornhövd et al. 2002; Frot et al. 2007).
2.4 Parallel or Serial Processing?
Noxious stimuli, as well as innocuous tactile stimuli, activate SI and SII. However, the temporal profiles of SI and SII activations for noxious stimulation clearly differ from those for tactile stimulation. Intracranial and MEG recordings have demonstrated that the activation of SI precedes the activation of SII in innocuous tactile processing (Allison et al. 1989a, b; Hari et al. 1993; Mima et al. 1998; Schnitzler et al. 1999). These temporal patterns of SI and SII activations for tactile stimulation are not inconsistent with anatomical projections from SI to SII (Gardner and Kandel 2000). Thus, SI and SII have been suggested to have serial processing for innocuous tactile stimuli. In pain studies using MEG, the activation of SI was almost the same as that of SII (e.g., Ploner et al. 1999; Kanda et al. 2000; Nakata et al. 2004, 2009). Thus, serial processing cannot explain the activations of SI and SII for noxious stimuli. Ploner et al. (1999) described that the simultaneous activation of SI and SII for noxious stimuli contributed to independent anatomical and functional pathways from the thalamus to SI and SII, such as the pathways from the ventroposterior lateral thalamic nucleus (VPL) to SI and from the ventroposterior inferior thalamic nucleus (VPI) to SII (Gingold et al. 1991; Friedman and Murray 1986; Stevens et al. 1993; Apkarian and Hodge 1989; Apkarian and Shi 1994; Dong et al. 1989; Kenshalo and Willis 1991). Thus, some researchers have proposed that SI and SII have parallel processing for noxious stimuli. However, Inui et al. (2003) reported that the activation of SI for noxious stimuli occurred earlier than that of SII. The peak latency of SI in previous MEG studies reported the simultaneous activations of SI and SII for noxious stimuli were later than 160 ms (Ploner et al. 1999, 2000, 2002; Kanda et al. 2000; Nakata et al. 2004). Inui et al. (2003) observed magnetic responses for noxious stimuli in SI at not only around 160 ms, but also 88–100 ms after the stimulus onset. Source localizations for the earlier (i.e., 88–100 ms) and later (i.e., around 160 ms) responses were estimated to be area 1. In other words, the responses originated from the same area. Interestingly, the peak latency of the first response in SI was earlier than that of the response in the contralateral SII, indicating that serial processing cannot simply be ruled out. Another MEG study suggested that the magnetic response in SI reported in previous pain studies using MEG may be the response in the posterior parietal cortex (PPC) (Nakata et al. 2008). In most previous MEG studies, noxious stimuli were applied to the hand. One of the magnetic responses to noxious stimuli is commonly observed from MEG sensors around the top of the head (Fig. 1). Previous MEG studies estimated the source location of the response to be SI. Anatomically, SI and PPC are located adjacent to each other. Therefore, it is not easy to distinguish the magnetic response in SI from that in PPC. In a MEG study conducted by Nakata et al. (2008), noxious stimuli were applied to the thigh, which is easier to distinguish anatomically from PPC. The distribution of the magnetic responses in the central areas when noxious stimuli were applied to the hand (Fig. 1) was clearly different from when noxious stimuli were applied to the thigh (Fig. 2a). As shown in Fig. 2b, two dipoles were observed in the post central gyrus when the thigh was stimulated. On the other hand, only one dipole was observed when the hand was stimulated. These results indicate that the activation of SI and PPC cannot be distinguished when the hand is stimulated. Interestingly, in the thigh stimulation condition, the peak latency of the magnetic response in SI was 151 ms and significantly shorter than that in SII, while that in PPC was 183 ms, which was almost the same latency as that in SII. Based on this finding, they suggested that there may be serial processing for noxious stimuli and the findings of previous MEG studies may not be SI, but PPC. It has not yet been clarified whether noxious processing is parallel or serial.
Fig. 2
Magnetic responses when noxious stimuli were applied to the thigh. a The grand average of magnetic responses and their source localizations. A anterior, P posterior, L left, R right, iSII ipsilateral secondary somatosensory cortex, cSII contralateral secondary somatosensory cortex. b Source localizations in the post central gyrus. Adopted from Nakata et al. (2008)
2.5 Magnetic Responses to Noxious Stimuli Associated with C-Fibers
The pain sensation induced by the excitations of C-fibers evokes aching, burning, throbbing and dull sensations. They are clearly different perceptions from the pain induced by the excitation of Aδ-fibers, which evokes sharp and pricking sensations. Noxious stimuli using laser stimuli and electrical stimuli activate both Aδ- and C-fibers or selectively activate Aδ-fibers. However, the cerebral responses to noxious stimuli that can be measured are commonly associated with Aδ-fibers. Thus, findings observed in the pain studies discussed in the previous sections were all associated with the pain sensation mediated by Aδ-fibers. It is difficult to measure cerebral responses to noxious stimuli associated with C-fibers by just applying laser and electrical stimuli to the skin because of the suppression of cortical responses associated with C-fibers by those associated with Aδ-fibers. One of the methods used to investigate the cerebral processing of C-fiber pain has been a physical block of the conduction of A-fibers by the compression of nerve fibers. Ploner et al. (2002) used this method and observed the activations associated with C-fiber pain in bilateral SII and ACC. Meanwhile, a novel method using CO2 and YAG lasers to selectively stimulate C-fibers was developed (Tran et al. 2001, 2002; Qiu et al. 2003; Qiu et al. 2006). This method involves placing an aluminum plate with many tiny holes on the skin where laser stimuli are applied (Fig. 3).
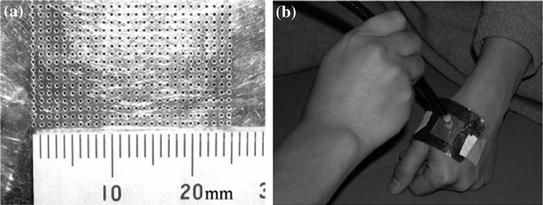
Fig. 3
The aluminum plate used for evoking C-fiber pain using laser. a Thin (0.1 mm in depth) aluminum plate (40 mm in length and 60 mm in width) with many tiny holes. b The plate was attached to the skin and laser stimuli were applied to the skin through the plate. The array of holes allowed the 2 mm laser beam to pass through one to four holes to reach the skin. Adopted from Kakigi et al. (2003)
The peak latencies of the magnetic responses in SI and SII were longer than 700 ms when the stimuli were applied to the hand (Kakigi et al. 2003), which was clearly a different latency from noxious stimuli associated with Aδ-fibers. A microneurographic study confirmed that the novel method selectively excited C-fibers (Qiu et al. 2003). Forss et al. (2005) compared cortical processing between Aδ-fiber-and C-fiber-related pain. They reported that the peak latencies of the magnetic response to laser stimuli were much shorter for Aδ-fiber pain than for C-fiber pain, while the source localizations were not significantly different. Thus, they suggested that nociceptive inputs mediated by Aδ- and C-fibers are processed in a common cortical network in different time windows. A pain study using fMRI reported significant differences in the activities in the anterior cingulate cortex (ACC) and IC between Aδ- and C-fibers (Qiu et al. 2006). These different perceptions between Aδ- and C-fibers may contribute to motivational-affective components such as ACC and IC rather than sensory-discriminative components such as SI and SII.
3 Pain Modulation
The pain sensation can be modulated by psychological factors such as the manipulation of attention to pain, relaxation, and mental stress or physiological factors such as the interference of pain perception by applying noxious and innocuous somatosensory stimuli or movements. Qiu et al. (2004) investigated the underlying mechanism of pain inhibition by distracting attention from pain using MEG and EEG. To distract attention from pain, subjects were asked to perform a mental arithmetic task while noxious laser stimuli were applied to the dorsum of their hands. All subjects reported that the subjective pain sensation decreased during the distraction task. They observed that noxious stimuli-related responses in the contralateral SI, bilateral SII, cingulate cortex, and medial temporal areas were markedly diminished while subjects performed the distraction task. Similar results were also reported in other studies (Yamasaki et al. 1999; Schlereth et al. 2003). It has been demonstrated that attention such as shifting attention between stimuli and sustaining attention to or distracting attention from stimuli, is controlled by several brain regions, such as the prefrontal, cingulate, and parietal cortices, thalamus, and reticular formation (the attention control system) (Coull 1998; Raz 2004). Thus, these regions are considered to play important roles in attention-related neural activity changes in the brain regions associated with pain (Peyron et al. 2000; Lenz and Treede 2002; Villemure and Bushnell 2002). Some researchers reported that the analgesic effect by distraction was associated with the activation of descending inhibitory control (Tracey et al. 2002; Valet et al. 2004). Simply said, descending inhibitory control is accomplished by inhibiting the pain-related ascending neural signal at the spinal level by descending neural signals from the periaqueductal grey and rostral medulla (Millan 2002). However, since the task to distract attention from pain modulates not only attention, but also stress and mood levels, it is still controversial whether high cognitive demanding tasks are an appropriate method to investigate the neural mechanism of pain modulation by attention (e.g., Villemure and Bushnell 2002). Another well-known pain modulation system is the gate control theory, in which excitation of the thin fibers conducting the tactile sensation (e.g., Aβ-fibers) inhibits nociceptive ascending signals conducted by thick fibers (e.g., Aδ- and C-fibers) in the spinal cord through the interneurons of substantia gelatinosa. Following this model, pain sensation is not inhibited if noxious ascending signals pass through the spinal dorsal horn before ascending signals mediating the tactile sensation reach there or noxious stimuli are applied after ascending signals mediating tactile sensation reach the brain. Inui et al. (2006) investigated the issue using MEG. They attached electrodes for noxious electrical stimuli and tactile stimuli to the right side of the back 4 cm lateral to the ninth thoracic vertebral spinous process. The electrical noxious stimulus (i.e., intra-epidermal electrical stimulation (IES)) was current constant double pulses at 100 Hz with a 0.5 ms duration (Inui et al. 2002). The tactile stimulus (TS) was double pulses at 100 Hz with 0.5 ms duration. They randomly changed the timing to apply the conditioning stimulus (i.e., the tactile stimulus) relative to the test stimulus (i.e., IES). The conditioning-test intervals (CTIs) were −500, −300, −100, −60, −40, −20, 0, 50, 100, 300, and 500 ms. Interestingly, the pain sensation was reduced when TS was applied 20–60 ms earlier than IES and even when IES was applied much later (e.g., 500 ms) than TS. The magnetic response supported the behavioural results. As shown in Fig. 4, the magnetic response associated with IES was reduced to less than 60 % of the control (IES 500 s before TS). They suggested that cortical responses to noxious stimuli can also be inhibited by innocuous tactile stimuli at the cortical level. These findings strongly demonstrate that the underlying mechanism of pain inhibition by tactile stimuli is not only the gate control theory.