and since both μ and r lie along the z-axis, this reduces to
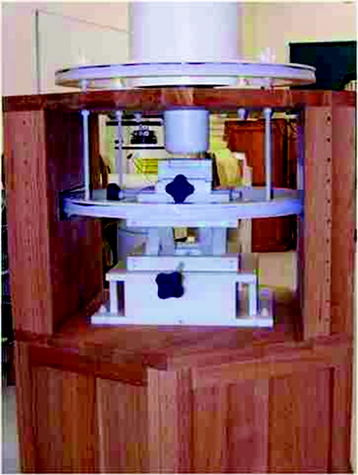
Fig. 1
Photograph of magnetic relaxometry system used at senior scientific for studying disease using cell cultures and small animals. The upper structure is the dewar containing the SQUID sensors with gradiometers in the protruding snout. The Helmholtz coils are shown above and below the measurement stage
To measure the moments using the SPMR method, the sample is placed under the SQUID sensor system and a magnetizing field of approximately 50 gauss is applied for 0.75 s during which time the sensors are turned off. After a short delay, 0.035 s, to allow any induced currents in the system to dissipate, the decaying magnetic moment of the sample is measured by the SQUID sensor array. An example of such a decaying moment is shown in Fig. 2. The initial decay follows an exponential curve as predicted by Néel (1955). The field decay curve is measured for several seconds and the field magnitude calculated at the end of the magnetizing pulse. The field from each sensor position is then used to derive the source positions and magnitudes.
Fig. 2
Magnetic relaxation decay curves for NP bound to cells through antibody interactions and the same NP without cells present
An important attribute of SPMR is that the decay time constants differ substantially between NP that are bound to a cell or some other substance and thus not able to freely rotate, and NP that are unhindered (Adolphi et al. 2009, 2010). This is shown clearly in Fig. 2 where the curve for NP bound to cells decays in seconds whereas effectively no signal is seen for the same NP but not bound to cells. Néel relaxation occurs due to thermal fluctuations of the direction of the magnetic moment relative to the crystal orientation. The rate for Néel is given by
 where K is a characteristic of the magnetic material, V is the volume of the NP, k is the Boltzmann constant and τ0 has a value of 10−9 s. In contrast, if the NP are not bound, they decay by Brownian motion given by the rate
 where η is the viscosity of the medium, Vh is the hydrodynamic volume, k B is Boltzmann’s constant. The desired decay time for bound NP is several seconds which according to the Néel formula requires a NP with a diameter of 25 nm. Unbound NP of this diameter decaying by Brownian motion decay in less than one msec. This very important feature of SPMR means that very high contrast is achieved in imaging cancer cells in vivo that are targeted by the NP that have been conjugated to antibodies specific to the cancer cells as NP circulating in the blood give no signal in the SQUID sensor time window. There are some similarities in this property of SPMR and MEG. PET is often used for both cancer detection and for brain activity through targeting metabolic activity. However, PET isotopes are decaying whether at the targeted site or anywhere in the blood stream. As stated above this is not true of SPMR and also not true in MEG where only active neuronal clusters are producing measurable magnetic fields.
The first important attribute of SPMR is the high sensitivity of the method for detecting minute amounts of NP, less than ng of Fe required, because of the SQUID sensor capabilities. The second important attribute are the characteristics of the superparamagnetic NP that yield high magnetic moments, substantial difference between bound and unbound NP, and are not ferromagnetic so do not cluster. The Néel time dependence on volume severely restricts the size of the NP that can be used in SPMR since a diameter of just a few nm in either direction from the ideal of 25 nm can be many orders-of-magnitude difference in decay time. For this reason, substantial effort has gone into methods of producing NP with minimal dispersity in size. Figure 3 is a recent result obtained at The Center for Integrative Nanotechnology (CINT) (Huber 2012).
Fig. 3
Plot of NP diameter distribution as obtained from analyzing a transmission electron microscope photo of NP placed on a slide
3 Applications of SPMR to Nanomedicine
The methodology of SPMR has been applied to a number of diseases in the area of nanomedicine. T-cells have been labeled with NP conjugated to an antibody for the specific T-cells responsible for rejecting transplanted organs and used to measure transplant rejection in a mouse model (Flynn et al. 2007; Butler et al. 2013). A study of leukemia Minimal Residual Disease (MRD) has been carried out using NP with antibodies (CD-34) specific to a number of leukemia types (Jaetao et al. 2009). SPMR has also been applied to the study of solid tumors in breast cancer (Hathaway et al. 2011; Adolphi et al. 2012a, b), ovarian cancer (Flynn et al. 2014), and prostate cancer. The results have also been compared to MRI imaging in some detail using an animal model (Adolphi et al. 2012b). A further advantage of the SPMR technique over many other biomedical methods is the transparency of tissue and bone to low frequency magnetic fields. This implies, just as in the case of MEG, that source localization is not affected by intervening tissue. For animal studies this is quite important and is unlike the scattering that occurs in the use of fluorescent markers resulting in loss of localization of source accuracy with depth.
3.1 Linearity of Response
Because the strength of the magnetic field is completely linear in relationship to the source magnetic moment, the SPMR results are directly proportional to the number of bound NP in the source. Again, a similarity to MEG where the magnetic field strength observed can be directly related to the number of neurons involved. This linearity is demonstrated in Fig. 4 for the case of ovarian cancer cells (Flynn et al. 2014). Here the number of live ovarian cells in an in vitro sample was varied with the strength of the magnetic moment measured. The inset to this figure shows that the sensitivity with the present SPMR system shown in (Fig. 1


Related posts:

Stay updated, free articles. Join our Telegram channel
Full access? Get Clinical Tree
