Fig. 1
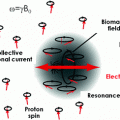
Schematic diagram of stages involved in the construction of functional brain images. Biophysical modeling can be used to relate the physical and physiological neural processes associated with brain activation to the underlying sources of the brain imaging signals. Forward modeling describes the signal patterns generated by a given source distribution. Inverse modeling involves the estimation of the source distribution on the basis of the recorded signals. MEG and EEG record “complementary” (yellow circle) information about the same sources, i.e., primary currents. Functional MRI can be used in a “supportive” role (blue) in MEG source analysis. MEG/EEG and fMRI can also be considered complementary (green) since the sources of both signals originate from common neural processes
2 MEG and EEG
Since the physiological sources underlying both MEG and EEG are of the same type, the benefits of combining MEG and EEG are based on the different sensitivity properties of these modalities. The spatial sensitivity patterns of MEG and EEG sensors are called lead fields. The set of lead fields is one way to express the forward model, which incorporates the available physical and structural information about the head and the instrumentation to establish the signal patterns that primary currents generate in a sensor array. The structure of the lead fields forms the basis on which source estimates (inverse solution) are constructed. The lead fields of MEG and EEG sensors differ in a non-trivial way from each other, thereby providing complementary information about the underlying primary current distribution in the brain (Cuffin and Cohen 1979; Cohen and Cuffin 1983; Malmivuo and Plonsey 1995; Mosher et al. 1999; Riera et al. 2006). The complementary properties of MEG and EEG can enhance the detection, dissociation, and localization of the neural sources of interest (Wood et al. 1985).
Two major differences between MEG and EEG lead fields are related to the orientation and the depth of the sources (Cuffin and Cohen 1979). Regarding the source orientation, MEG sensors are insensitive to radial source currents, whereas EEG sensors are sensitive to both radial and tangential sources. In the spherical head model, the sensitivity of MEG to radially oriented sources is zero (Baule and McFee 1965; Grynszpan and Geselowitz 1973). The insensitivity of MEG to one source orientation occurs also for realistic, non-spherical head models (Melcher and Cohen 1988; Haueisen et al. 1995; Ahlfors et al. 2010a). In a simulation study using a boundary element model for the head, the median value over cortical locations for the relative signal magnitude for the source orientation with the lowest versus the highest sensitivity was found to be 0.06 for MEG and 0.6 for EEG (Ahlfors et al. 2010a). The selective sensitivity of MEG to tangential source components can be helpful for the dissociation of multiple time-varying sources.
Regarding the source depth, both MEG and EEG are generally more sensitive to superficially located sources than to deep sources. However, the relative sensitivity of MEG diminishes faster as a function of depth than that of EEG (Cuffin and Cohen 1979; Hillebrand and Barnes 2002). In the spherical head model, the sensitivity of MEG is zero at the center of the sphere, whereas EEG signal can be generated by sources at any location. Assuming the primary currents are oriented perpendicular to the cortical surface, only very narrow strips at the crest of gyri are expected to have the radial orientation that the MEG cannot detect; therefore, the depth-dependency appears more important in the comparison of sensitivity patterns of MEG and EEG than the orientation dependence (Hillebrand and Barnes 2002). Selective cancellation of signals from tangential source components on opposite walls of a sulcus or a gyrus tends to make extended source patches look radial (Eulitz et al. 1997; Freeman et al. 2009; Ahlfors et al. 2010b), with potentially important implications to the relative signal-to-noise ratio (SNR) of MEG and EEG and the detectability of e.g., epileptic activity (Goldenholz et al. 2009; Ebersole and Ebersole 2010).
Several studies have demonstrated complementary properties of EEG and MEG in detecting epileptic discharges, such that some are detectable in EEG only or in MEG only, but not necessarily in both (Sutherling et al. 1991; Yoshinaga et al. 2002; Zijlmans et al. 2002; Lin et al. 2003; Rodin et al. 2004; Knake et al. 2006; Ramantani et al. 2006; Ossenblok et al. 2007). Differences in source detectability can be understood in terms of the expected SNR for different sources, which depends on the sensor lead fields, signal noise, the source magnitude, and the background brain activity (de Jongh et al. 2005; Goldenholz et al. 2009; Huiskamp et al. 2010). Prominent differences between MEG and EEG have also been demonstrated, for example, in sleep data (Dehghani et al. 2010).
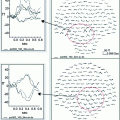
Combining MEG and EEG data can sometimes be useful for resolving source configurations that are ambiguous on the basis of the signal topography in a single modality. Figure 2 shows simulated MEG data from a bilateral pair of occipital current dipoles. In this case, the quadrupolar MEG topography (Fig. 2a) is consistent in the presence of uncertainty due to measurement noise with two very different two-dipole models, either laterally located horizontal dipoles or medially located vertical dipoles (Fig. 2b). The EEG topography, however, would be very different for these two scenarios: the EEG map shown in Fig. 2c suggests horizontally oriented dipoles. Bilateral activation of auditory cortices is a well-know example of topographies that can be potentially ambiguous in terms of source areas: two tangential supra-temporal lobe dipoles typically generate a large mid-frontal maximum in EEG that could be mis-interpreted as being due to a radial frontal source (Vaughan 1982), whereas in MEG the two auditory cortex sources are typically readily dissociable (Mäkelä et al. 1993); however, these sources may also generate a dipolar looking MEG signal pattern over the parietal lobe (Hämäläinen et al. 1995).
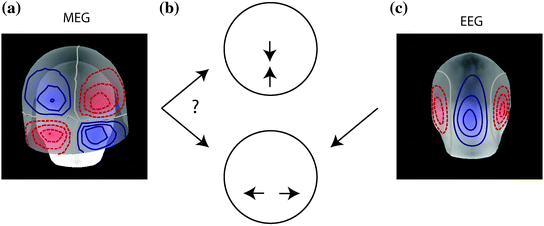

Fig. 2
An example of complementary properties of MEG and EEG signals that can, in combination, help disambiguate the source distribution. The quadrupolar pattern of the extracranial magnetic fields (MEG) (a) could be generated either by two near-midline dipoles in the parietal and occipital regions (b, top) or by two bilaterally located occipital dipoles (b, bottom). However, the corresponding topography of scalp potentials (EEG) would be quite different for these two configurations; here the EEG pattern for the two occipital bilateral dipoles is illustrated (c). Thus, the combination of MEG and EEG can resolve source configurations that can be ambiguous in one of the modalities. Analogous examples can be easily constructed in which MEG resolves source patterns that are ambiguous on the basis of EEG topography only. Adapted from (Ahlfors et al. 2010b)
Combined MEG and EEG inverse modeling is facilitated by the common source model. Indeed, incorporating signals from both EEG and MEG sensors is not different, in principle, from incorporating different types of MEG sensors, such as gradiometers and magnetometers. An important practical issue is how to adjust the relative weighting of the different sensors in the source estimation procedures to take into account the expected SNR for each sensor (Fuchs et al. 1998; Baillet et al. 1999). Determining the SNR is challenging, however, because of the various types of uncertainties that should be incorporated, such as those related to co-registration, head model, sensor calibration, and background physiological noise. Enhanced source estimation results obtained by combining EEG and MEG data have been demonstrated in several studies of experimental and simulated data (Stok et al. 1990; Mosher et al. 1993; Phillips et al. 1997; Fuchs et al. 1998; Muravchik et al. 2000; Pflieger et al. 2000; Babiloni et al. 2001; Liu et al. 2002; Sharon et al. 2007; Molins et al. 2008).
3 MEG and Structural MRI
MEG source estimates are commonly visualized by superimposing them on high-resolution structural MRI, thereby relating the MEG results to brain anatomy. Structural MRI also provides essential supportive information for the inverse modeling of MEG signals. Anatomical information from MRI can be used to determine the permissible MEG source locations (often called the source space) to be within the cranial volume or the cortical gray matter (George et al. 1991; Dale and Sereno 1993). In addition, the source orientation can be constrained to be strictly or nearly perpendicular to the cortical surface (Dale and Sereno 1993; Lin et al. 2006; Chang et al. 2013). Typically, anatomical constraints are imposed on the individual subject level, but atlas-based approaches are possible as well (Hillebrand et al. 2012).
4 MEG and Functional MRI
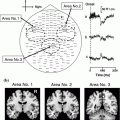
Functional MRI and other hemodynamic imaging data can be used in a supportive role in MEG (and EEG) data analysis to suggest a likely spatial distribution for the sources of MEG signals (George et al. 1995; Simpson et al. 1995; Dale and Halgren 2001). One possibility is to place equivalent dipoles at the locations of foci of fMRI activation (Heinze et al. 1994; Ahlfors et al. 1999; Korvenoja et al. 1999; Torquati et al. 2005). A powerful application of fMRI-guided MEG source estimation is to use information from fMRI-based mapping of the retinotopic representation of the visual field to constrain the locations of equivalent dipoles in multiple visual areas (Hagler et al. 2009). For distributed MEG source models, such as the minimum-norm estimate (MNE) (Hämäläinen and Ilmoniemi 1994), fMRI can be used as an a priori weighting for the inverse solution (Liu et al. 1998; Dale et al. 2000). This is implemented by adjusting the diagonal elements of the source covariance matrix (Liu et al. 1998).
Because of the different physiological nature of the origin of fMRI and MEG signals, it is important to minimize potential adverse effects from a mismatch between the locations of activity seen in fMRI and the actual source locations of the MEG signals (Dale and Halgren 2001). “False positive” fMRI locations refer to cases in which activation in fMRI does not correspond to an MEG source, whereas “false negative” fMRI refers to the lack of fMRI activity at the location of a true MEG source (Liu et al. 1998; Ahlfors and Simpson 2004; Im et al. 2005; Im and Lee 2006; Liu et al. 2006). In general, both of these types of mismatches can be due to the differing physiological properties of the signal generation in the two modalities. There is encouraging experimental evidence of the BOLD contrast typically observed in fMRI being closely correlated with post-synaptic currents (Logothetis et al. 2001). However, it is likely that details of the local neural circuitry and the neural and vascular morphology can result in differences in the properties of the signals in the different imaging modalities. Mismatches may also be caused by differences in the experimental design in fMRI and MEG data acquisition and analysis. Event-related fMRI paradigms make it possible to use similar cognitive task designs that are commonly used in MEG (Rosen et al. 1998). However, it is important to critically evaluate the similarity of the baseline conditions and design contrasts used in each modality. In addition, false negative fMRI locations can result from susceptibility artifacts or partial-only coverage of the head in the fMRI data. False positive fMRI can occur when MEG is insensitive to some activity, e.g., when the corresponding primary currents are radially oriented or located deep in the brain. Furthermore, false positive fMRI is bound to happen in the analysis of individual time points of the MEG data: because of the slow time course of the hemodynamic response, a single fMRI map usually shows areas whose activity in the millisecond time scale may only partially overlap in time, and therefore only a subset of the activated areas in fMRI is expected to contribute to the MEG signal at any given time instant.
Ideally, an approach for incorporating a priori constraints from a supportive modality would give improved source estimates when the a priori information is compatible with the actual source distribution, while also being insensitive to incompatible priors (Liu et al. 1998; Vauhkonen et al. 1998; Ahlfors and Simpson 2004). False positive fMRI constraints in MEG source modeling are typically well-behaving, i.e., the contribution to the MEG inverse estimates is usually small for the false positive fMRI locations, especially if the true and false locations are far apart from each other (Liu et al. 1998; Fujimaki et al. 2002). False negative fMRI constraints are expected to be more problematic than false positive ones (Liu et al. 1998; Ahlfors and Simpson 2004; Im et al. 2005), although simple false negative fMRI may actually have only little effect (Babiloni et al. 2003). In particular, if the assumed MEG sources are strictly restricted at the locations of fMRI activation only, MEG signals originating from other locations may be erroneously assigned to the assumed source locations (Liu et al. 1998; Ahlfors and Simpson 2004). Therefore, it is important that the source estimation algorithm allows the MEG sources to be also at non-fMRI locations.
Stay updated, free articles. Join our Telegram channel

Full access? Get Clinical Tree


