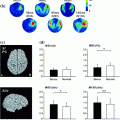
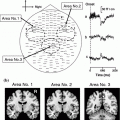
Fig. 1
MEG signal versus power time-scales. Example of time courses of MEG activity (black) and power envelope (red)
Interestingly, all three methods showed important similarities regarding the Default Network interactions’ properties. In (Hipp et al. 2012) it is assumed that signal components of the same source measured from different sensors will be characterized by an identical phase while in many cases, different neuron populations have a variable phase relation. This difference can be exploited to remove spurious correlation patterns due to the MEG limited spatial resolution. In particular, every considered pair of signals is orthogonalized before the computation of their power envelopes. This allows one to remove the spurious common correlation leaving a residual ‘cleaned’ spatial correlation. The activity orthogonalization is performed in the frequency domain on the estimated band limited activity but this can similarly be done in the time domain where it generalizes to broadband signals. Of practical importance is the selection of the time interval to derive the regression coefficient. This can range from the entire dataset to just a single time window during which the signals’ relation should be constant. If such stationarity is fulfilled, longer time intervals provide more robust estimates and may lead to a superior sensitivity of the method. However, it is important to stress that without stationarity, the orthogonalization step may be incomplete. Eventually, the interaction between orthogonalized signals is quantified by means of correlation of the power envelopes obtained by squaring the absolute values of the complex spectral estimates after a logarithmic transform (this makes the power more normally distributed). The correlation with a given seed is considered as significant when it is higher than a baseline value computed as the average correlation with the rest of the brain.
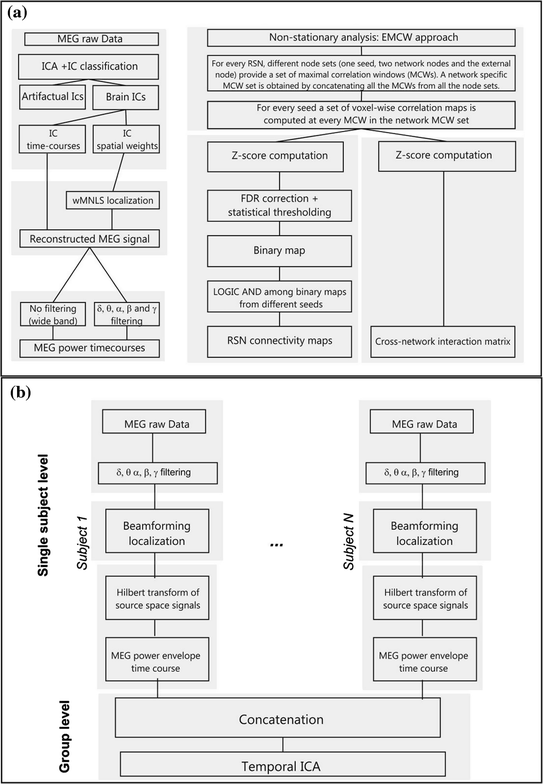
In Brookes et al. (2011a, b) an approach based on Beamforming and the computation of the Hilbert Envelope is presented. MEG data are frequency filtered in the typical physiological bands and covariance matrices are generated independently for each frequency band, using the whole recording session at the subject level. It is important to stress that this corresponds to assuming that sources of interest are stationary throughout the experiment. Following beamformer projection, source-space signals are normalized and Hilbert transformed. The absolute value of the analytic signal, called the “Hilbert envelope”, is computed to obtain an amplitude envelope of oscillatory power. Then, data from all subjects are concatenated in the time dimension and temporal Independent Component Analysis (ICA) is applied using the fastICA (http:www.research.ics.tkk.fi/ica/fastica) algorithm. The spatial signature of each IC is measured by Pearson correlation between the temporal IC (tIC) and the time course of each voxel in the concatenated dataset. This process is implemented independently for each frequency band of interest. In addition to the ICA-based approach, the authors also present a seed-based approach for DMN characterization to show that independent temporal signals arise from spatially orthogonal networks. Seed locations in the motor, fronto-parietal, and visual networks are extracted from fMRI data. Down-sampled Hilbert envelopes are extracted for each of these seed locations and in order to generate seed-based correlation maps, data are concatenated across subjects. The Pearson correlation between seed time course and down-sampled Hilbert envelopes for all other brain voxels is computed. In (Brookes et al. 2011b), the validity of correlation measurements are tested using a simulation approach in which two dipolar sources (at the seed and test locations) are repeatedly simulated. To obtain noise data to be added to these simulated data, one empty-room session is recorded (no subject in the scanner). The simulation step is repeated to assess the statistical significance of measured functional connectivity values. Simulated MEG data are projected into the brain using the same beamformer weights derived from and applied to the real MEG data. This interesting approach allows one to check whether the adopted beamformer projection generates spurious correlation due to the volume conduction and signal leakage.
Another interesting aspect of the work of Brookes and colleagues is the different metrics the authors propose to assess the functional connectivity: two are based on envelope correlation—termed Average Envelope Correlation (AEC) and Correlation of Averaged Envelopes (CAE); while two others are based on coherence—termed coherence (Coh) and Imaginary coherence (ICoh). In all cases, connectivity is measured between the projected signal at the seed voxel, and that from all other (test) voxels in the brain.
The approach presented in (de Pasquale et al. 2010, 2012a) is based on the BLP but is different from the previous ones; it is developed to take into account the non-stationarity of brain connections. This temporal non-stationarity represents an important aspect of the DMN internal and across-network interactions. In fact, based on the observation that the coupling among different RSN nodes oscillate over time, de Pasquale et al. propose an approach to estimate time epochs in which the internal connectivity of a network is optimized. In what follows, we describe the basic ingredients of this methodology.
The MEG data are pre-processed by applying a pipeline based on ICA described in (de Pasquale et al. 2010; Mantini et al. 2011), which extends an approach described in (Hironaga and Ioannides 2007). Basically, different from what was described above where each IC was related to a given resting state network, a subset of ICs is classified as artifactual and removed. Importantly, the authors do not assume that a network can be assigned single ICs but rather a combination of them. For this reason, once non-artifactual ICs are identified these are linearly combined to generate the ‘cleaned’ MEG signal. To this aim, source-space IC maps are reconstructed from the remaining ICs on a Cartesian 3D grid with 4 mm voxel side using a weighted minimum-norm least squares (WMNLS) procedure. For each voxel and each time sample, source-space signals are obtained by linear combination of IC time-courses, each weighted by its source-space map. Then, source-space signals are filtered in the typical physiological frequency bands. From these filtered signals, MEG power time series are obtained by averaging the square of source-space MEG signals.
In order to determine the time scale to adopt for the non-stationary analysis, the total interdependence function, a coherence-based measure of the functional connectivity, is examined from nodes of known network affiliation. The authors report initially for the Default Mode Network and the Dorsal Attention network (de Pasquale et al. 2010), an increase in the vicinity of 0.1 Hz. This result was then extended to the Ventral Attention, Motor and Language networks. Based on this observation the length of 10 seconds, the reciprocal of 0.1 Hz, is selected as the window duration to be used for the evaluation of time-varying node-pair correlation.
Eventually, to identify epochs of high within-RSN correlation or maximal correlation windows (MCWs), de Pasquale and colleagues developed the ‘extended maximal correlation window’ (EMCW) algorithm. This algorithm accepts as input power time-series spanning an entire MEG run from one seed and two other nodes of known network affiliation. The objective of this algorithm is to identify epochs in which the contrast between within-network, i.e. between the seed and other network input nodes, versus external node-to-network correlation, i.e. between the seed and an external node, is maximal. Specifically, the algorithm seeks epochs in which the least within-network correlation is above a threshold while the external node-to-network is minimal. This is accomplished using an iterative strategy based on the Old Bachelor Acceptance thresholding technique (Hu et al. 1995). The algorithm is run starting with different groups of input nodes to obtain a specific set of MCWs for each network by concatenating the MCWs for each input node group. Additional details on the selection of the threshold and criteria for epoch selection can be found in (de Pasquale et al. 2010, 2012a, b; Mantini et al. 2011).
The network connectivity maps and cross-network interaction matrices are based on the definition of a Z-score obtained from correlation maps computed in all the sessions of all the subjects in all the estimated MCW epochs. To obtain the final RSN connectivity maps, the strengths of the correlations in every voxel of the brain with the seed, compared to the mean correlation in the whole brain, is tested. Then, each connectivity map is corrected for false discovery rate—FDR (p < 0.05) and thresholded at a significant level to obtain a binary map. All the binary maps from the different seeds are combined together through a logic AND. This step insures that only regions of significant correlation across all nodes of a network are maintained.
Analogously, the cross-network interaction matrices are also based on Z-scores to is the strengths of the correlations between a pair of RSN nodes compared to the mean correlation of these nodes, with the rest of the brain. It must be stressed that, based on the above definitions, Z-scores are defined on specific temporal epochs including all the MCWs obtained for each specific RSN. This quantity represents the average interaction between one ‘fully engaged’ network and another network.
In (de Pasquale et al. 2012a) MEG-RSNs interactions are not only characterized on average throughout the recording period by computing matrices of node-to-node or RSN-to-RSN power correlation, but also by characterizing the dynamics of this interaction. This is achieved by computing the degree of temporal overlap between two networks, when each one is respectively in a state of high internal correlation (or MCW). Given two sets of RSN MCWs, we computed the MCW overlap as the average ratio of overlap of all the possible pairs of MCWs from the two networks. It must be noted that differently from the power correlation matrix, this matrix is symmetric by definition. To summarize, in Fig. 2 we report the flowcharts of the described ICA and seed-based approaches.
2.1 Methodological Considerations
The methodologies adopted in the MEG community, due to the intrinsic nature of the MEG signal and the acquisition setup, differ at several levels. The first level is related to the solution of the inverse problem for which different kinds of spatial filters, adaptive or non adaptive, with or without noise normalization, in time or in frequency domain, have been developed and employed. The different strategies provide results with different properties (e.g., in terms of field spread) that are related to the different assumptions of the method. Specific metrics have been defined to measure the performance of the inverse strategy used with regard to localization error, presence of ghost sources, point spread function, cross talk function or their combinations (Hauk et al. 2011). Despite the exact choice, all the considerations on the obtained results have to be made without discarding the information on the above characteristics since they basically define the method limitations. This is particularly relevant for connectivity mapping since spurious connectivity can be induced by e.g., mislocalized sources, ghost sources, field spread.
A second level is represented by the particular parameter, i.e. signal vs power or linear vs nonlinear association measures adopted to study the functional connectivity. In fact, a full understanding of brain function requires the investigation of brain interactions at different temporal scales: the slow power fluctuation scale (several seconds) and the faster neuronal communication scale (several milliseconds) see Fig. 1. The first approach has been traditionally pursued with fMRI and more recently also with MEG as extensively discussed above. The second is unique to MEG since it measures the activity of neuronal populations in which communication has been shown to be accomplished in large part via synchronized oscillatory activity (Buzsaki 2009; Fries 2009; Singer 1993). This level of investigation of RSNs offers MEG the privilege and the challenge to provide a unified framework for the relationship between fast oscillatory brain activity and slow temporal dynamics. The exploitation of different connectivity metrics based on signal properties or on power modulation properties represents a first step towards this integration. Also within one temporal scale, the choice of a particular connectivity metric plays a final fundamental role for the characterization of the results. Temporal correlation of BLP is a robust strategy but many other approaches, e.g., non linear measures of interaction or probabilistic ones will provide information on different aspects of the connectivity.
Moreover, seed based approaches are different from ICA based approaches. The main limitation of seed based approaches is that it is assumed that the seed, usually obtained from previous independent experiments, is reproducible across subjects. With ICA this limitation is somehow overcome, but on the other hand, it is assumed that different nodes of the same network are characterized by an identical signal time course. In this way, the hierarchical structure of the network and the different roles played by different nodes cannot be investigated. In addition, the cross-network interaction is somehow limited by the IC independence assumption, i.e. ICs are by definition either spatially or temporally independent. In (Brookes et al. 2011b), since the ICA is run separately on the different frequency bands, the cross-frequency network interaction is presented, i.e. the interaction is computed between ICs extracted from different frequency bands. Seed-based and ICA based approaches also share some similarities: in a seed based approach a seed is considered reproducible across subjects, while in the temporal ICA approach, a similar assumption is made when data from a set of subjects are concatenated together. This assumes that the different subjects are just replications of one subject.
Once a given parameter is chosen to quantify the strength of coupling, a critical question is how to define its statistical significance. A common feature of the different strategies described so far is that they all assume the temporal correlation as a linear measure of coupling among brain areas (Brookes et al. 2011a, b; de Pasquale et al. 2010; Mantini et al. 2011). Then, correlation values are compared to a ‘baseline’. In (de Pasquale et al. 2012a; Hipp et al. 2012) this baseline is defined as the average correlation of the seed with the rest of the brain. Such a baseline is subject specific and scales the coupling with a given specific level of ‘general’ connectivity in the brain during the recording session. In this way, in a group analysis consistent deviations from the average connectivity in the brain are tested. In other studies, however (Brookes et al. 2011b) the baseline value of connectivity is not estimated from the real acquired data but from simulated data obtained by adding synthetic noise to real empty-room data. This threshold is not subject specific and it allows spurious connectivity to be induced by the different pre-processing steps. This approach has the advantage that the coupling is not scaled, i.e. all subjects are tested against the same reference value.
Another common aspect of these approaches is the adoption of ICA based methods. ICs are always used as a classification methodology but the meaning of the estimated ICs is opposite. In one case, the identified temporal ICs are linked to RSNs so that a subset of the estimated ICs are mapped one to one to a subset of resting state networks and the remaining ones are discarded. In the another case, a subset of the identified ICs are linked to artifactual components of the signal and are discarded while the remaining ones are recombined to build a ‘cleaned’ MEG signal. Thus, the real signal is assumed to be a linear combination of the estimated ICs.
Based on these considerations, it must be stressed that a complete scenario can only be gathered by integrating the properties highlighted by ICA and seed based results. The former will provide important information on the segregation properties of RSNs without any prior information and the latter will provide information on the integration among different RSNs. Interestingly the spatial maps and frequency content obtained by these different approaches are in good agreement.
3 Stationary Connections of the Default Mode Network
There is growing evidence of DMN internal coupling observed with MEG. Typically, a first step in these analyses is to compare the DMN topography with that from fMRI which has been playing the role of golden standard in the identification of RSNs so far. In fact, in Brookes et al. (2011a, b; de Pasquale et al. 2010, 2012a, b) great care is shown in developing techniques to quantify the MEG-fMRI agreement. In Fig. 3 we report the comparison between the nodes of the RSNs usually reported in the fMRI and MEG literature.
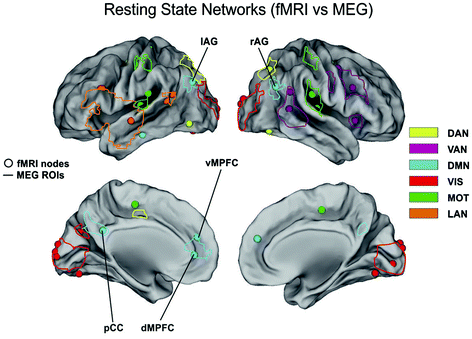

Fig. 3
fMRI versus MEG resting state networks. Location of the consistent nodes of the dorsal attention (yellow), ventral attention (Pink), default mode (cyan), visual (red), motor (green) and language networks (brown) reported in the fMRI literature (round marks) as compared to the corresponding regions observed by MEG (solid lines)
This comparison is a very complex and delicate topic since these techniques highlight different properties of the networks under investigation. Apart from the obvious difference between fMRI and MEG spatial and temporal resolution, it must be reminded that these techniques are intrinsically different given the different nature of the collected signals. Thus, the observed differences will not claim a superiority of one technique compared to the other but it will simply enrich a multivariate scenario of the considered network. In (Brookes et al. 2011b) good agreement is found between the DMN observed with fcMRI and MEG which corresponds to one of the 25 temporal ICs extracted in the alpha band. In particular, nodes are observed in medial frontal cortex and left/right inferior parietal lobules. The main important difference with fMRI is the absence of the Posterior Cingulate Cortex (PCC), an important node of the DMN which has been consistently reported from other studies and it is hypothesized to play a fundamental role in connectivity at rest (see Fig. 4 panel A). This point is further discussed in the Conclusions section. Of most interest in (Brookes et al. 2011b) is the difference between amplitude and correlation spectra. In the left/right fronto-parietal and the default mode networks clear θ-band components are observed in the amplitude spectra, but not the correlation spectra, indicating that despite the prevalence of θ-oscillations, they are not involved in fronto-parietal or default mode connectivity.
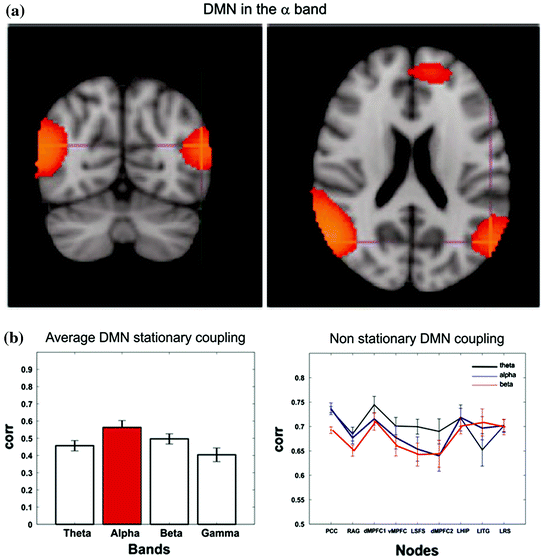

Fig. 4
The internal coupling of the Default Mode Network is consistently observed mainly in the alpha band under the temporal stationarity assumption both from an ICA based approach (Panel A modified from Brookes et al. 2011b) and a seed based a one (Panel B left—modified from de Pasquale et al. 2010). When the non-stationarity is accounted for a mixed contribution of alpha and theta bands is revealed (Panel B right)
Analogously, also in the motor network, a similar property is observed: despite the prevalence of 8 to 13 Hz oscillatory activity in both primary sensorimotor regions, no significant correlation is observed between the Hilbert envelopes in this frequency band.
Regarding the DMN cross-network interactions, since temporal ICA forces orthoghonality among the networks, this approach cannot be used to study network cross-coupling within the same frequency band. However, since ICA is adopted independently to each frequency band, cross-network interactions can only be addressed between different frequency bands, in a cross-frequency fashion. In this case, good agreement is reported between fMRI and MEG patterns of interaction between the DMN (for the MEG in the α-band) and the other considered networks (for the MEG in the β-band) such as the left/right frontoparietal, medio-frontal, parietal, visual, motor and cerebellum. These results show some frequency dependence; correlation between nodes of the fonto-parietal, DMN, and motor networks is observed across the 10–30 Hz range, but is strongest in the β-band. This finding agrees with the work by Mantini et al. (Mantini et al. 2007) who used concurrent EEG/fMRI to show that the envelope of band-limited EEG signals correlates with BOLD signals from separate network nodes. Moreover, these results are in line with (de Pasquale et al. 2012a) in which a strong cross-network interaction of the DMN in the alpha and beta band was found.
By means of BLP seed based connectivity, the picture of the MEG internal coupling of the DMN looks different from the one described so far. As a matter of fact, under the assumption of temporal stationarity, only intra-hemispheric connections, ipsilateral to the seed, are observed in the DMN (when the Left or Right Angular Gyrus are selected as seeds). These connections relate to specific known fMRI DMN nodes such as the Superior Frontal Sulcus, Posterior Cingulate and retrosplenial cortex. This result cannot be attributed to differences between fMRI and MEG in signal temporal frequency content, as shown in (de Pasquale et al. 2010) in which the convolution of the MEG power time series with a canonical hemodynamic response function generated only a spatially blurred version of the original results. However, the identified DMN connections were strongest in the alpha band (see Fig. 4 panel B—left).
4 Dynamic Connections of the Default Mode Network
In (de Pasquale et al. 2010) the comparison of the fMRI and MEG DMN topography revealed a discrepancy showing only ipsilateral connections in the MEG case when a stationary interaction among DMN nodes is assumed. Now, if the same interactions are examined during smaller temporal epochs, a non-stationarity property is revealed, i.e. same nodes alternate periods of high and low synchronization. In this scenario, it seems that a static spatial topography is not sufficient to fully describe the network coupling: the temporal axis must be considered, i.e. the coupling must be considered dynamic over time. Thus, to investigate this dynamic interaction the following properties must be addressed: the temporal scale of interaction, the frequency content of both internal and external network coupling, the degree of non stationarity of the DMN compared to other RSNs and its meaning. In (de Pasquale et al. 2012a), in order to estimate the temporal scale of dynamic interactions the spectral properties of interregional correlations are investigated. Autospectra and total interdependence, a measure of the internodal coherence, are computed for each subject on the principal nodes of DMN (L/R AG;LPCC; LMPFC), and then averaged across subjects. This analysis showed a peak around 0.1 Hz suggesting appropriate time epochs to be as large as 10 s. Of note, in a different study (Luckhoo et al. 2012


Stay updated, free articles. Join our Telegram channel

Full access? Get Clinical Tree


