Highlights
- •
Non-invasive subtyping of HCA remains challenging for several subtypes, thus carrying different levels of risks and management; to date, ß-HCA and sh-HCA are not detected and no discrimination between I-HCA and ß-I-HCA is achieved in daily practice.
- •
Multiple HCA subtyping can be improved using clinical features, i.e., age and sex, combined with MRI-radiomics features.
- •
Machine-learning algorithms including basic clinical features and MRI-radiomics could help discrimination between I-HCA and ß-I-HCA.
Abstract
Objectives
Non-invasive subtyping of hepatocellular adenomas (HCA) remains challenging for several subtypes, thus carrying different levels of risks and management. The goal of this study is to devise a multivariable diagnostic model based on basic clinical features (age and sex) combined with MRI-radiomics and to evaluate its diagnostic performance.
Methods
This single-center retrospective case-control study included all consecutive patients with HCA identified within the pathological database from our institution from January 2003 to April 2018 with MRI examination (T2, T1-no injection/injection-arterial-portal); volumes of interest were manually delineated in adenomas and 38 textural features were extracted (LIFEx, v5.10). Qualitative (i.e., visual on MRI) and automatic (computer-assisted) analysis were compared. The prognostic scores of a multivariable diagnostic model based on basic clinical features (age and sex) combined with MRI-radiomics (tumor volume and texture features) were assessed using a cross-validated Random Forest algorithm.
Results
Via visual MR-analysis, HCA subgroups could be classified with balanced accuracies of 80.8 % (I-HCA or ß-I-HCA, the two being indistinguishable), 81.8 % (H-HCA) and 74.4 % (sh-HCA or ß-HCA also indistinguishable). Using a model including age, sex, volume and texture variables, HCA subgroups were predicted (multivariate classification) with an averaged balanced accuracy of 58.6 %, best=73.8 % (sh-HCA) and 71.9 % (ß-HCA). I-HCA and ß-I-HCA could be also distinguished (binary classification) with a balanced accuracy of 73 %.
Conclusion
Multiple HCA subtyping could be improved using machine-learning algorithms including two clinical features, i.e., age and sex, combined with MRI-radiomics. Future HCA studies enrolling more patients will further test the validity of the model.
1
Introduction
Hepatocellular adenomas (HCA) are rare, benign liver tumors, with an incidence reported between 1/100,000 and 4/100,000 . Frequently diagnosed in women in their reproductive age and with a women:men ratio of 10:1, these hormone-driven tumors typically develop in the setting of a hormonal or metabolic abnormality, such as long-term use of oral contraceptive pills, androgen exposure or obesity . Complications, such as hemorrhage (15–20 %) or malignant transformation (5 %), were observed to increase with tumor size, leading to the recommendation to resect all HCA larger than 5 cm and all HCA detected in male patients [ , ]. In other cases, the identification of the adenoma subtype is a key step in the management of adenoma. HCA encompass various monoclonal hepatocellular proliferations that can be classified into subtypes strongly associated with risk factors, clinical features and complications, but also their histological, immunohistochemical and radiologic hallmarks . These subtypes are HNF1α adenomas (H-HCA), inflammatory adenomas (I-HCA), ß-catenin adenomas (ß-HCA), ß-catenin-inflammatory adenomas (ß-I-HCA) and Sonic-Hedgehog adenomas (sh-HCA). From the radiologic hallmarks, only 11.6 % of H-HCA and 12 % of I-HCA remain undiagnosed in the best series . Recently, the hepatospecific contrast uptake in the hepatobiliary phase was discovered to be strongly associated with marked activation of the β-catenin pathway .
Despite the accuracy of these criteria, MRI fails to classify subtypes in other situations, in particular for the identification of ß-HCA and sh-HCA, but also the discrimination between ß-I-HCA and I-HCA ; anatomopathology including immunohistochemistry, molecular analysis, and more recently, proteomic analysis, allows this identification. This method requires a liver biopsy with a risk of bleeding recently reported to be 7 % in a large cohort .
The identification of adenoma subtypes in a non-invasive fashion remains a challenge because it is a key step in their management, either surgical, surveillance, or abstention; this holds especially true for adenomas displaying inflammatory phenotypes, sometimes ß-catenin mutated. Because of the rarity of adenomas, MRI series have small numbers of patients, so the chosen method must be adapted to small numbers. Hence, the diagnostic model devised in this study integrates two basic clinical features, namely age and sex, combined with MRI-based radiomic features (including tumor volume and texture features) and its performance to distinguish hepatocellular subtypes is tested. The purpose was to compare, as a preliminary study, the original concept of computer-assisted method with the usual qualitative (visual) analysis for the diagnosis of adenomas. To the best of our knowledge, no study has yet assessed the potential usefulness of MRI-radiomics features to aid adenoma classification.
2
Materials and methods
2.1
Study design and population
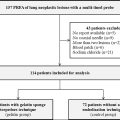
From January 2003 to April 2018, all consecutive patients with at least one confirmed HCA on liver specimen were retrospectively identified within our pathological database from our institution and affiliated hospitals ( Fig. 1 ). Patients with the HCA subtypes H-HCA, I-HCA, ß-HCA, ß-I-HCA and sh-HCA were included. This single-center observational study was approved by the Institutional Review Board (IRB number CRM-2103-143). Informed consent was waived due to its retrospective nature.

2.2
Histological analysis
To classify HCA, the histological analysis on all tissue specimens was performed by two experienced readers who were blinded to clinical and radiological data. Subtyping of the surgical parts was performed by immunohistochemistry and molecular analysis, and only immunohistochemistry for the biopsy samples. When molecular analysis could not be performed due to a sample alteration, proteome analysis was performed . Any adenoma without its own histological evidence was excluded from the analysis.
2.3
Clinical features
Clinical features of patients were retrospectively collected from our institution records when available: while age and sex were included in our study, BMIs, which were not known in all patients, were not included.
2.4
MRI protocols
From 2003 to 2018, each patient underwent a liver-MRI, either in our center or outside. For each patient, four MR-images were collected: one T2 weighted image without fat-signal suppression and three T1-weighted gradient echo images (T1w GRE) with in phase and out phase chemicals shift (one image) and after (two images) intravenous injection of gadolinium-based contrast medium (pre-contrast phase/arterial phase at 30–40 s/portal phase at 90–120 s). MRI models are summarized in supplementary material.
2.5
MRI visual analysis
All MRI data were assessed retrospectively and independently in consensus by two abdominal radiologists NF, HT (more than 15 years experience), blinded to pathologic, clinical, and biological data. Each lesion was classified using pre-defined criteria. The sign associated with the subgroup of H-HCAs is a signal dropout on chemical shift sequences, assessing the presence of fatty hepatocytes. This signal dropout is diffuse and homogeneous . The sign associated with the subgroup of I-HCA is related to sinusoidal dilatation with marked hyperintensity on T2W and persistent delayed enhancement translating global sinusoidal dilatation [ , ] or complete hyperintense peripheral rim on T2W, typically enhanced in the late vascular phase, with isointense and homogenous center similar to surrounding liver, known as the atoll sign. Lesions without these signs were HCA without visual identification of the subtype, grouping ß-HCA and sh-HCA. Visual discrimination between I-HCA and ß-I-HCA could not be achieved in our daily practice unless resorting to hepatospecific contrast medium. Hence, I-HCA and ß-I-HCA were here merged into a new subgroup referred to as “(ß-)I-HCA”.
2.6
MRI data processing
Slice-by-slice delineation of a volume of interest (VOI) was performed manually (freehand) for each tumor by a resident in Radiology using LIFEx freeware (version 5.10, Inserm, Orsay, France, www.lifexsoft.org ) .
Prior to feature extraction, additional image spatial harmonization and standardization was conducted to avoid inhomogeneity, as indicated by Masson et al. . For each image, the intensity range was normalized by means of Z-scoring [mean +/- 3 SD]. Image intensities were discretized into 128 fixed bins.
2.7
MRI-radiomics feature extraction
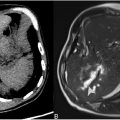
The entire tumor volume was used during image manual delineation and texture analysis ( Fig. 2 ). The presence of hemorrhagic remodeling masking the tumor tissue resulted in dataset exclusion; in case of hemorrhagic changes not masking the tumor, the tumor tissue was segmented, but not the hematoma.

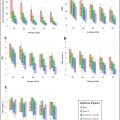
Using each of the four above-mentioned MRI protocols, the tumor volume and a total of 38 textural radiomics features (TF) were calculated from each VOI using the above-mentioned LIFEx freeware including: 6 histogram-based features and 32 s-order texture features from gray-level co-occurrence matrix (GLCM, N = 7, with a 1-voxel distance to neighbors), gray-level run length matrix (GLRLM, N = 11), neighborhood gray-level different matrix (NGLDM, N = 3), and gray-level zone length matrix (GLZLM, N = 11). TFs were individually centered (by removing the training mean) and scaled (to unit variance) beforehand. As underlined by Jolliffe et al. , sufficiently large patient cohorts are required to avoid under powering and “noise discovery”; ten patients per individual predictor investigated may be advised. TF with P-value < 0.05 with Bonferroni correction were selected (analysis of variance (ANOVA) for multi-variate classification/Mann Whitney for binary classification/all TFs selected in default). A Principal component analysis (PCA) was then applied to create a single combined TF variable in order to reduce dimensionality of selected TF-features while preserving its information, as suggested by Halligan et al. .
2.8
MRI automatic analysis
The diagnostic performances of a multivariable model including four categorical variables (2 clinical features: Age, Sex; and 2 radiomics features: tumor Volume and Texture) as inputs (this model is denoted by “ASVT model”). The diagnostic performances are compared to the following two classification models:
- 1.
A univariable model (denoted by “VF model”) including the volume feature as an input.
- 2.
A multivariable model (denoted by “ASV model”) including three categorical variables – Age, Sex and Volume – as inputs.
The automatic classifiers were evaluated for multi-variate (5 classes: H-HCA, I-HCA, ß-HCA, ß-I-HCA and sh-HCA) and binary (2 classes: I-HCA and ß-I-HCA) classifications.
2.9
Statistical analysis
The analysis was conducted with the commercial software MATLAB (©1994–2022 The MathWorks, Inc./Statistics and Machine Learning toolbox). The classifier was the Random Forest machine-learning algorithm (default hyperparameters in the MATLAB implementation). The diagnostic performance of the automatic classifiers was evaluated through cross-validation [ , ] (90 % patients training/10 % testing, ensuring that all HCA subtypes to classify are present in both training and testing datasets, 1000 trials with random shuffling). The balanced accuracies, sensitivity, specificity, positive predictive values (PPVs) and negative predictive values (NPVs) of qualitative (visual) and automatic (computer-assisted) analyses were recorded. For automatic analyses, area under the ROC curve (AUROC) was also computed.
3
Results
3.1
Demographic characteristics
The study included 174 patients based on pathological results; 107 patients without preoperative MRI or without adequate MRI data (102 had no MRI, 5 had MRIs without the required sequences) were excluded. Four patients were further excluded because of lesion hemorrhage masking the tumor tissue for two and with hepatic vascular disease for two. Seventeen patients presented multiple adenomas: only one patient exhibited two different subtypes (i.e., ß-I-HCA and I-HCA), while the remaining 16 patients had the same subtype ( Fig. 1 and Table 1 ).
| Total | Sonic-Hedgehog HCA (sh-HCA) | Inflammatory HCA (I-HCA) | ß-catenin-inflammatory HCA (ß-I-HCA) | ß-catenin- HCA (ß-HCA) | HNF1α HCA (H-HCA) | P-value (ANOVA) | |
|---|---|---|---|---|---|---|---|
| # of patients | 63 | 13 | 17 | 14 | 6 | 13 | NA |
| Age [year] median (min-max) | 38 (21–61) | 40.5 | 38 | 36.5 | 31 | 36 | 0.032 |
| # of women:men | 53:10 | 13:0 | 15:2 | 10:4 | 6:0 | 9:4 | 0.252 |
| Women: children? | NA | ||||||
| Yes [# (mean)] | 19 (2.1) | 5 (1.6) | 6 (2.3) | 3 (3) | 3 (1.7) | / | |
| No | 14 | 5 | 5 | 3 | 1 | / | |
| Not available | 13 | 3 | 4 | 4 | 2 | 9 | |
| Women: OCP intake history? | NA | ||||||
| Yes | 35 | 11 | 13 | 8 | 3 | / | |
| No | 2 | 0 | 1 | 1 | 0 | / | |
| Not available | 7 | 2 | 1 | 1 | 3 | 9 | |
| BMI [kg/m²] mean (range) * | 28.9 (19–45) | 32.6 | 28.1 | 25.1 | 29 | / | NA |
| Diabetes | 5 | 4 | 1 | 0 | 0 | / | NA |
| Revelation mode | 56 | 12 | 14 | 13 | 5 | 12 | NA |
| Chance | 17 | 2 | 7 | 3 | 0 | 5 | NA |
| Liver biology abnormalities | 7 | 0 | 4 | 1 | 1 | 1 | NA |
| Pain | 23 | 6 | 3 | 9 | 0 | 5 | NA |
| Bleeding | 8 | 4 | 0 | 0 | 3 | 1 | NA |
| Inflammatory syndrome | 0 | 0 | 0 | 0 | 0 | 0 | NA |
| Other: eclampsia | 1 | 0 | 0 | 0 | 1 | 0 | NA |
| # of HCA on MRI | 0.023 | ||||||
| 1 | 46 | 9 | 10 | 10 | 6 | 11 | |
| [2–4] | 12 | 3 | 5 | 3 | 0 | 1 | |
| [5–10] | 3 | 1 | 1 | 1 | 0 | 0 | |
| >10 | 2 | 0 | 1 | 0 | 0 | 1 | |
| Size of lesion [mm] median (range) ⁎⁎ | 47 (12–162) | 60,5 (28–138) | 38 (12–144) | 50 (13–100) | 108 (43–162) | 56 (23–133) | 0.001 |
Related posts:
 Dose optimization in newborn abdominal radiography: Assessing the added value of additional filtration on radiation dose and image quality using an anthropomorphic phantom
 Chest tube placement incidence when using gelatin sponge torpedoes after pulmonary radiofrequency ablation
 Evaluation of a new beads reflux control microcatheter in drug-eluting bead transarterial chemoembolization
 Clinical Perspective: Uterine Fibroid Embolization (Gynecology)
 Imaging of Benign Prostatic Conditions
 Stellate Ganglion Blockade
Stay updated, free articles. Join our Telegram channel

Full access? Get Clinical Tree


