Cardiac MR (CMR) imaging contributes uniquely to the comprehensive assessment and management of aortic stenosis (AS), beyond the information provided by transthoracic echocardiography. The severity of AS and subsequent ventricular remodeling response can be assessed using cine images and phase-contrast mapping. CMR imaging also identifies myocardial tissue characteristics, which are valuable markers of left ventricular decompensation and adverse outcomes in AS. CMR imaging may be used as an alternative modality for transcatheter aortic valve replacement (TAVR) planning and post-TAVR management. This article explores the clinical utility of CMR imaging evaluation.
Key points
- •
The severity of aortic stenosis (AS) and subsequent ventricular remodeling can be assessed using cardiac MR (CMR) cine images and phase-contrast mapping.
- •
CMR can identify myocardial deformation and fibrosis, cornerstones of left ventricular decompensation in AS, using global longitudinal strain analysis, late gadolinium enhancement, and T1 mapping.
- •
CMR imaging can be a valuable alternative modality in the comprehensive assessment of transcatheter aortic valve replacement (TAVR) planning and post-TAVR management of paravalvular leak.
Introduction
With an aging population, acquired valvular disease, aortic stenosis (AS) in particular, has become among the most common clinical entities seen in daily practice. Noninvasive cardiac imaging is essential to evaluate the severity of AS and to determine the optimal timing of intervention. Although transthoracic echocardiography (TTE) is the most commonly used and studied imaging modality in this field, advances in cardiovascular magnetic resonance (CMR) imaging provide important contributions to the comprehensive assessment and management of these patients. Currently, CMR imaging techniques are considered the reference standard for left ventricular (LV) anatomic and functional assessment. Importantly, CMR imaging can detect and quantify myocardial deformation, as well as myocardial fibrosis, which is a cornerstone of LV decompensation in AS.
Thus, interest has grown in using CMR imaging in patients with AS, which is recognized as a disease of both the valve and the myocardium. This article summarizes the current CMR imaging techniques used for the comprehensive assessment of patients with AS and describes the clinical utility of CMR imaging in such patients.
Aortic stenosis severity: cine images and phase-contrast mapping
The standard measures of aortic valve (AV) severity include AV peak velocity, peak and mean gradients, and anatomic or physiologic AV area (AVA). Although TTE remains the primary imaging technique used to assess these parameters, CMR imaging can also provide the measurements of AS severity, in addition to more accurate quantification of LV volumes, myocardial mass, and function.
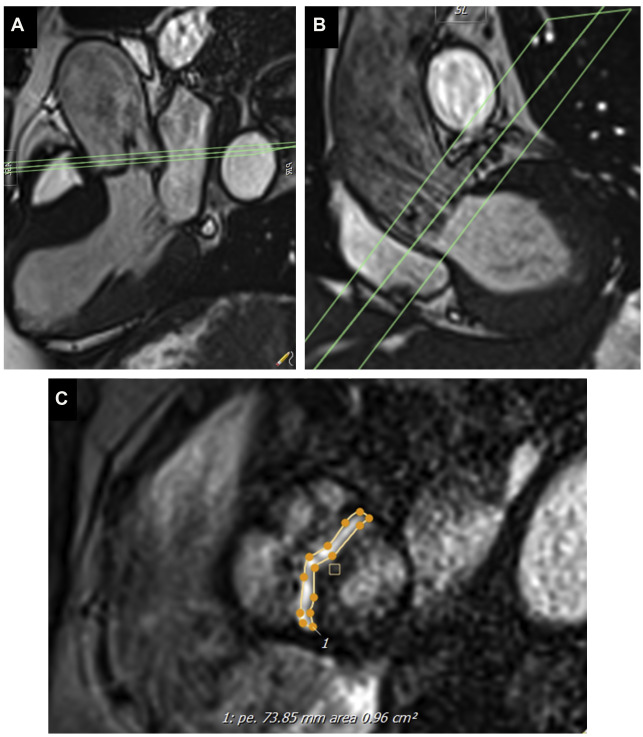
Cine imaging allows measurement of the anatomic valve area, using the scout line method to determine the exact leaflet position using orthogonal views (ie, 3-chamber and/or coronal LV outflow tract) ( Fig. 1 ). The average of 3 anatomic AVA planimetry measurements at the peak systolic phase (largest orifice area) should be used owing to potential limitations in spatial and temporal resolution. This technique has demonstrated good correlation with echocardiography (TTE or transesophageal echocardiography) as the reference standard. Direct planimetry measured by CMR imaging and/or transesophageal echocardiogram measures the anatomic stenosis (anatomic orifice area), whereas TTE and cardiac catheterization measure the physiologic functional stenosis at the vena contracta (effective orifice area), which tends to be slightly smaller.
Measurement of peak AV velocity and mean AV gradient with CMR imaging is possible using phase-contrast velocity mapping techniques, which are reproducible and do not require intravenous gadolinium contrast. To obtain the most accurate phase-contrast velocity, the angle of intercept should be oriented as perpendicular as possible to the orientation of the aortic jet flow through the stenotic AV. Additionally, the encoding velocity should be adjusted carefully to avoid aliasing. The phase-contrast imaging techniques, however, tends to underestimate the peak AV velocity and gradient compared with TTE. This can be explained by several factors: local signal loss (from flow turbulence), background correction, partial volume effects (large intravoxel size), phase shift errors due to fast acceleration, intravoxel dephasing (particularly with velocities >3.5–4 m/s), and relatively low temporal resolution (20–25 ms) that may not be able to capture high jet velocities of short duration.
Myocardial tissue characterization
Severe AS causes pressure overload of the LV, resulting in progressive maladaptive ventricular remodeling as a means to counterbalance the increased wall-stress (Laplace’s law). This may lead to increased myocyte volume (LV hypertrophy), as well as expansion of the extracellular matrix and development of myocardial fibrosis. Histopathology in patients with severe AS demonstrate both diffuse reactive fibrosis and focal replacement fibrosis. Crucially, CMR imaging is currently the only imaging modality able to accurately assess and quantify myocardial fibrosis. Diffuse interstitial fibrosis consists of increased deposition of collagen in interstitial spaces, which can be assessed by T1 mapping techniques. Focal replacement fibrosis consists of replacement of myocytes by fibrotic tissue, which can be detected by late gadolinium enhancement (LGE) imaging.
Late Gadolinium Enhancement
LGE imaging is the gold-standard method for noninvasive detection of focal myocardial fibrosis in a broad range of cardiovascular conditions, such as ischemic cardiomyopathy, nonischemic dilated cardiomyopathy, cardiac amyloidosis, hypertrophic cardiomyopathy, and AS. Focal myocardial fibrosis detected by LGE has proven to be a powerful independent predictor of mortality and adverse cardiovascular events in many conditions.
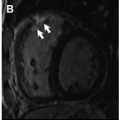
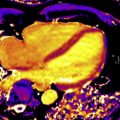
In patients with severe AS, nonischemic patterns of LGE are twice as common as ischemic patterns, including punctate or focal, subendocardial (resembling myocardial infarction), midwall, and extensive diffuse fibrosis ( Fig. 2 ). A single-center prospective study, including 143 consecutive patients with moderate or severe AS, has shown that focal midwall fibrosis pattern can be observed in the myocardium of up to 38% of patients and is associated with a more advanced hypertrophic response and worse prognosis even after surgical AV replacement (AVR). Barone-Rochette and colleagues also showed that the extent of myocardial fibrosis detected by LGE imaging before AVR predicted increased perioperative risk and worse all-cause and cardiovascular-related mortality in 154 patients with severe AS but without prior myocardial infarction.

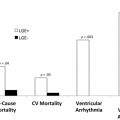
Additionally, the poor prognosis associated with nonischemic LGE persists long after AVR. The largest multicenter study of CMR imaging in AS to date included 674 subjects with severe AS and demonstrated that LGE on CMR imaging was observed in 51% of these subjects. Importantly, its presence doubled all-cause mortality and tripled cardiovascular mortality despite AVR. Furthermore, quantification of LGE demonstrated a strong dose-response association with outcomes. Whether AV intervention should take place before its development deserves further prospective evaluation, which is ongoing.
These adverse associations with the both the presence and amount of LGE are critical because replacement fibrosis in AS progresses quickly and does not regress following AV intervention. Interestingly, even in asymptomatic subjects with moderately severe AS, the presence of LGE was associated with LV decompensation. Taken together, these results suggest that early AVR could potentially halt further myocardial fibrosis progression in AS patients presenting with LGE, thereby improving patient outcomes ( Fig. 3 ).

T1 Mapping
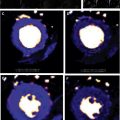
LGE is the most validated CMR imaging marker of replacement myocardial fibrosis in patients with AS. However, progressive pressure overload and compensatory LV hypertrophy also produce myocyte hypertrophy and interstitial expansion. Focal and diffuse myocardial fibrosis often coexist in patients with AS. Therefore, although LGE excels at identifying focal fibrosis, it is unable to accurately identify or quantify diffuse interstitial fibrosis, for which the gold standard assessment remains histologic collagen volume fraction. To address this, T1 mapping has emerged as a novel noninvasive imaging modality to detect diffuse fibrosis ( Fig. 4 ). The 3 main parameters are native T1, extracellular volume (ECV) fraction (ECV%), and indexed ECV (iECV). All 3 have been shown to correlate with collagen volume fraction on histology. Importantly, ECV reflects fibrosis and potential interstitial water limited to the extracellular matrix, whereas native T1 also includes the cardiomyocyte compartment.

Native T1
As fibrosis increases, native T1 values typically increase in patients with AS. Native T1 can detect focal and diffuse fibrosis without the use of contrast agent. Lee and colleagues recently demonstrated that, in a cohort of 127 subjects with moderate or severe AS and 33 healthy volunteers, native T1 was significantly higher in subjects with AS compared with healthy volunteers. Furthermore, native T1 was independently associated with all-cause mortality and heart failure hospitalization, albeit with low numbers of events.
Extracellular volume fraction
ECV can be obtained using postcontrast myocardial T1 mapping values for blood pool, precontrast native T1 and hematocrit: ECV% = (Δ[1/T1 myo ]/Δ[1/T1 blood ]) × (1 – hematocrit), where Δ(1/T1) is the difference in myocardial or blood pool T1 precontrast and postcontrast. Chin and colleagues showed that ECV% is higher in subjects with AS than in healthy controls. However, there are limited on data assessing the prognostic value of ECV% in subjects with AS.
Indexed extracellular volume
iECV quantifies the total LV ECV (indexed to body surface area): iECV = ECV% × indexed LV myocardial volume. Chin and colleagues demonstrated that iECV is increased in subjects with AS compared with healthy volunteers and higher iECV identifies subjects with early evidence of LV decompensation and adverse long-term outcome.
iECV and ECV% can be used together to assess the composition of the intracellular and extracellular compartments before and after relief of LV loading conditions, such as in AS patients before and after AVR. As a result of chronic progressive valve obstruction in AS, iECV and LV mass seem to increase relatively proportionally, such that ECV% remains unchanged. After AVR, LV mass (comprising cellular and extracellular mass) and iECV (representing total ECV or mass) decrease, in keeping with the potential for reversal of diffuse fibrosis. However, there is a corresponding increase in ECV% due to a more rapid regression in cellular mass compared with extracellular mass.
Importantly, it seems that gender differences exist not only for LV remodeling patterns but also for the magnitude of myocardial fibrosis with men having higher iECV and cell (1-iECV) volumes but the same ECV% as women.
Although the values of T1 mapping are relatively reproducible when using the same sequence and scanner on the same patient, they are influenced by some factors such as age and gender, acquisition sequence, scanner field strength, and postprocessing. Accurate quality control and standardized approaches for T1 mapping are in development, and groups such as the International T1 Multicenter Consortium have now demonstrated reproducible multicenter, multivendor sequences in other conditions. Use of T1 mapping specifically in AS is highly promising and offers the only method of quantifying diffuse fibrosis but does require further research to allow broader clinical application.
Feature-Tracking Global Longitudinal Strain
CMR feature-tracking (FT) allows assessment of global longitudinal strain (GLS) from routine cine images in the clinical setting, thus avoiding the need for dedicated pulse sequences and complex postprocessing analysis ( Fig. 5 ). Although CMR-FT–derived GLS has been shown to be a reproducible and independent predictor for mortality in patients with DCM and myocardial infarction over and above LV ejection fraction (LVEF), little has been reported on the prognostic value of CMR-FT–derived GLS in patients with AS. In a small cohort of 63 subjects with severe AS and normal LVEF, baseline CMR-FT–derived GLS was associated with LV mass index regression after AVR. However, the study did not evaluate the association of CMR-FT–derived GLS and hard outcomes such as death and/or hospitalization in AS subjects. Further studies are required to confirm the clinical utility and prognostic value of CMR-FT–derived GLS for subjects with AS.

Related posts:
 Applications of Cardiac MR Imaging in Electrophysiology
 The Role of Contrast-Enhanced Cardiac Magnetic Resonance in the Assessment of Patients with Malignant Ventricular Arrhythmias
 State-of-the-Art Quantitative Assessment of Myocardial Ischemia by Stress Perfusion Cardiac Magnetic Resonance
 Automated Quantitative Stress Perfusion in a Clinical Routine
 The Prognostic Value of Late Gadolinium Enhancement in Nonischemic Heart Disease
 The Value of T1 Mapping Techniques in the Assessment of Myocardial Interstitial Fibrosis
Stay updated, free articles. Join our Telegram channel

Full access? Get Clinical Tree


