Ischemic heart disease remains the foremost determinant of death and disability across the world. Quantification of the ischemia burden is currently the preferred approach to predict event risk and to trigger adequate treatment. Cardiac magnetic resonance (CMR) can be a prime protagonist in this scenario due to its synergistic features. It allows assessment of wall motility, myocardial perfusion, and tissue scar by means of late gadolinium enhancement imaging. We discuss the clinical and preclinical aspects of gadolinium-based, perfusion CMR imaging, including the relevance of high spatial resolution and 3-dimensional whole-heart coverage, among important features of this auspicious method.
Key points
- •
Cardiac magnetic resonance (CMR) provides excellent temporal and spatial resolution without the limitations associated with unfavorable echocardiographic windows, and low temporal and spatial resolution in nuclear medicine studies, nor does it involve ionizing radiation.
- •
Myocardial perfusion by CMR can be integrated with a spatially registered interrogation of regional function (wall thickening, segmental contractility, and myocardial deformation image), edema, fibrosis, and viability.
- •
These simultaneous faculties are not present in other imaging modalities.
Introduction
Cardiac magnetic resonance (CMR) has arisen as a method of choice for myocardial ischemia assessment. CMR is endowed with a series of advantageous characteristics, which are only in part present with other modalities. Although arguably still not the gold-standard method, stress perfusion CMR permits excellent spatial and temporal resolution, evaluation of contractile function (wall motility and thickening) and myocardial perfusion quantification, in addition to assessment of myocardial viability and scar with late gadolinium enhancement (LGE) technique. Moreover, multicenter studies have demonstrated outstanding sensitivity and specificity in the detection of significant coronary artery disease (CAD) in patients submitted to perfusion imaging during pharmacologic stress by CMR. A compilation of 26 studies, comprising more than 11,000 patients, predicted sensitivity of 89% and specificity of 80% in the detection of CAD by the stress perfusion of CMR ( Fig. 1 ).

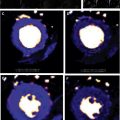
Compared with single photon emission computed tomography (SPECT), multivendor studies demonstrated noninferior performance of stress perfusion CMR in the presence of at least one-vessel disease and a better performance in multivessel disease. More recently, the CE-MARC study reported superiority of CMR, even in patients with single-vessel coronary disease. Compared with SPECT, PET offers a better spatial resolution (5–7 mm vs 12–15 mm of SPECT) and the promise not to misdiagnose microvascular or balanced multivessel disease. Also, PET provides absolute quantitative measures of radiotracer concentration, thus facilitating estimation of absolute myocardial perfusion in mL/min per g of myocardial tissue. However, radioisotopes have very a short half-life, requiring on-site production of tracers, which impedes more widespread use. Some other important limitations of nuclear perfusion imaging are the presence of attenuation artifacts, in the anterior wall for female patients with large breasts, and the inferior wall in male patients with large abdominal circumference, use of radiation, and relatively long examination duration.
In this scenario, CMR imaging could have growing importance because it has widespread availability, allows imaging with high temporal and spatial resolution, and does not involve ionizing radiation. However, some shortcomings still prevent CMR from reaching its full potential. The most important of them is the lack of a dependable quantitative analysis because signal intensities on CMR images do not provide a direct measure of contrast concentration and require careful “calibration” of the contrast concentration estimation in the arterial input. Quantitative analyses are not routinely endorsed by current guidelines, despite their potential clinical utility, because of the lack of clinical studies demonstrating a positive difference in outcomes or even studies confirming a better accuracy compared with nonquantitative visual analysis. In the present review, we aim to gather and appraise pivotal studies related to stress perfusion CMR and present the current state-of-the-art myocardial ischemia assessment by this promising method. The review has a special focus on quantitative analysis of ischemic myocardium.
Normal coronary flow during rest and hyperemia
The established physiologic rationale for stress perfusion imaging is based on the concept of coronary flow reserve. The myocardium extracts virtually all oxygen delivered. Because of the high energy costs for the cardiac cycle, myocardial perfusion depends almost exclusively on coronary blood flow. Coronary flow reserve ( Fig. 2 ) refers to the capacity of the coronary circulation to increase the blood flow through the coronary tree until its microcirculation, when in maximum dilation. As for perfusion, it is expressed as the volume of blood flow (eg, in milliliters) through the microcirculation in a unit of myocardial mass (eg, gram), per unit of time (eg, minute). During CMR, coronary artery vasodilation is typically obtained with a pharmacologic vasodilator agent, such as adenosine or dipyridamole, and more recently with regadenoson, an A2A adenosine receptor agonist with fewer side effects than adenosine. In healthy young adults, these drugs increase coronary flow up to 4 times and are particularly effective in minimizing resistance within distal coronary artery bed.

At rest, a coronary epicardial lesion will limit flow only when luminal narrowing reaches 85% or more, whereas with vasodilation this threshold is reduced to approximately 50%. The response of coronary flow to vigorous exercise has the same magnitude as the increase observed during the vasodilation with an adenosine receptor agonist agent. Presuming that myocardial perfusion can be independently quantified at rest and during maximal vasodilatation, the perfusion reserve can be calculated as the flow rate during hyperemia (maximal vasodilatation) divided by the resting flow. (Sometimes the resting flow in the denominator is normalized by the rate-pressure product to achieve greater independence from the baseline cardiac workload, which can be elevated in hypertension and other pathologies.) In the healthy coronary circulation, the coronary flow reserve and myocardial perfusion reserve agree in magnitude, but the presence of a coronary epicardial obstruction can result in an epicardial reserve inferior to the myocardial perfusion reserve measured downstream of the lesion due to the presence of coronary collaterals. The poststenosis vasodilatory response occurs at the prearteriolar level and depends on individual microvascular function, which, in turn, is determined by clinical factors, such as smoking status, diabetes, hypertension, and other conditions, known to impair microvascular function and induce endothelial dysfunction. Therefore, perfusion of the microcirculation may vary across individuals for a similar epicardial stenosis.
A compromised myocardial perfusion reserve is considered a useful substitute marker for ischemia, although the threshold below which myocardial perfusion reserve should fall to cause clinically relevant ischemia is not well defined. A coronary flow reserve of 2.5:1.0 has frequently been used as a cutoff point, as it results in a significant association with risk factors, presence of CAD, and with clinical outcomes after revascularization. For CMR perfusion imaging with absolute myocardial blood flow (MBF) quantification a similar threshold may be appropriate.
Diagnosis of coronary artery disease
Myocardial Perfusion Imaging
Myocardial perfusion images are acquired for approximately 60 beats to cover a precontrast phase, the first pass of contrast in myocardium after injection, and recirculation of the contrast agent. Total time of acquisition is too long for a single breath-hold, although patients are usually asked to hold their breath for the initial phase of the study and resume breathing when necessary, but without having to take a deep breath, which would result in slice position misregistration. Breathing movement is sufficiently slow to not cause motion artifacts in individual images (acquisition time per image ∼120–200 ms), but during postprocessing it is necessary to adjust for respiration-related cardiac motion. However, total correction for cardiac motion can probably only be solved with 3-dimensional (3D) acquisitions rather than 2D multislice imaging.
A substantial number of single-center and multicenter studies demonstrated favorable sensitivity and specificity of myocardial perfusion imaging with coronary vasodilation for the detection of CAD versus coronary angiography. Stress testing with adenosine yielded better sensitivity for diagnosis of CAD than dipyridamole (0.90, 95% confidence interval [CI]: 0.88–0.92 vs 0.86; 95% CI: 0.80–0.90; P = .022) and a trend toward a better specificity (0.81, 95% CI: 0.78–0.84 vs 0.77, 95% CI: 0.71–0.82, P = .065). In one multicenter study, Schwitter and colleagues compared the diagnostic accuracy of myocardial perfusion stress by CMR with SPECT for the detection of significant CAD, defined as luminal narrowing ≥50% in at least 1 vessel. The investigators demonstrated noninferiority of myocardial perfusion stress CMR (area under the receiver operating characteristic curve [AUC], 0.86 + 0.06 vs 0.75 + 0.09; P = .12). Recent meta-analyses confirmed this diagnostic accuracy.
The MR IMPACT II trial (n = 533) showed that CMR is a safe alternative to SPECT, revealing greater sensitivity (0.67 vs 0.59, P = .024), although lower specificity (0.61 vs 0.72, P = .038). However, in another prospective study (n = 752), CE-MARC, Greenwood and colleagues demonstrated greater sensitivity (86.5% vs 66.5%, P <.0001) and negative predictive value (90.5% vs 79.1%, P <.0001) of CMR compared with SPECT, whereas specificity (83.4% vs 82.6%, P = .916; respectively) and positive predictive value (77.2% vs 71.4%, P = .061, respectively) were similar. In addition, stress CMR was superior to SPECT flow limiting CAD across all CAD definitions ( Fig. 3 ). Comparisons with invasive physiologic measures as fractional flow reserve (FFR) also yielded favorable results. Rieber and colleagues demonstrated that the calculation of myocardial perfusion reserve index, with a cutoff value of 1.5:1.0 for a semiquantitative perfusion reserve index, allowed the detection of stenosis hemodynamically important, as determined by FFR less than 0.75.

Myocardial perfusion quantification
Semiquantitative Analysis
Semiquantitative techniques assess the signal intensity versus time curves across myocardial segments by determining simple curve properties, rather than estimating MBF. Briefly, a segmentation model of 17 segments, as recommend by the American Heart Association, divides the left ventricle (LV) in regions to be analyzed in parallel with wall motion and LGE. Myocardial segments are defined on short-axis views of the heart (and possibly 1 long-axis view for apical cap) by contouring the LV along the endocardial and epicardial borders, defining a reference point like the anterior LV–right ventricle junction, and subdividing the LV wall into 6 segments at the basal and mid-level, and 4 segments at the apical level. This form of segmentation of the LV allows tracking of the same portions of the LV wall, compensates for respiratory movements, and excludes epicardial fat and signal from the blood pool as potential sources of error. Images acquired during ectopic heartbeats are excluded. The rate of increase of the signal intensity during the first pass (“upslope” of signal-intensity curve) has been identified as useful parameter for a semiquantitative analyses and shown to yield good diagnostic accuracy. Frequently evaluated parameters by postprocessing packages include maximal upslope of the myocardial signal intensity, AUC from start of contrast enhancement to first-pass peak in the blood pool, and time to peak signal intensity (from start of contrast enhancement).
Estimating the spatial extent of ischemia provides important diagnostic and prognostic information. A recent prospective study with 1024 consecutive patients in referred to stress perfusion CMR suggests that simple quantification of the number of ischemic segments has a prognostic value and helps identify patients at risk. Based on the 16-segment model (17-segment model excluding the apical cap), the investigators demonstrated that patients with ≥1.5 ischemic segments presented a worse prognosis, owing to more frequent cardiac death, nonfatal myocardial infarction, and myocardial revascularization within 90 days of the examination. The mean follow-up time of the study was 2.5 years. In the 17-segment model, ischemia in 2 or more segments corresponds to approximately a 12.0% ischemic burden mirroring nuclear medicine studies in which an ischemic load greater than 10.0% to 12.5% should be used to indicate coronary revascularization because myocardium would be at risk.
Full Quantification of Myocardial Perfusion
Fully automated quantitative analyses are still not established in clinical practice but have evolved and may help discriminate diagnosis in particular cases such as multivessel coronary disease, microvascular dysfunction, or suspicion of inadequate vasodilator response. Quantitative CMR has been validated against microspheres in experimental models, coronary sinus flow, and PET in healthy volunteers.
In patients undergoing coronary angiography, Morton and colleagues applied a double bolus injection and Fermi deconvolution analysis to fully quantitative stress perfusion by CMR and compare it with 13 N-ammonia PET, the current noninvasive reference standard. They demonstrated that myocardial perfusion reserve is highly correlated between the 2 methods (r = 0.75, P <.0001). When analyzing coronary territories with the lowest reserve scores, correlation remained significant (r = 0.79, P <.0001). However, absolute perfusion values, at rest and during stress, had only a modest association (r = 0.32, P <.002 and r = 0.37, P <.0001, respectively). These data may be explained by different properties of the tracers and model assumptions, but the relative stress/rest ratios are less affected by absolute disparities. The same study established cutoff values for MBF reserve that predicted significant coronary disease determined by angiography: ≤1.44 for PET and ≤1.45 for CMR (with 82% sensitivity and 87% specificity; and 82% sensitivity and 81% specificity, respectively). Different approaches have been proposed for MBF quantification, are frequently applied and appear to have similar diagnostic performance. They are Fermi model, uptake model, 1-compartment model, model-independent deconvolution methods, and 2 model-independent methods.
Gadolinium Enhancement and Myocardial Blood Flow
These fully quantitative methods derive estimates of MBF from signal intensity versus time curves of myocardial contrast enhancement. Yet, signal intensity is only approximately proportional to gadolinium concentration in T1-weighted images and at higher concentrations this relation becomes nonlinear, giving rise to what is often referred to as signal saturation. Signal saturation in particular affects the signal intensity in the blood pool, where contrast concentrations are highest during the first pass compared with myocardium. Several options are available to avoid or minimize this problem: the contrast dose and delivery must be chosen to minimize saturation effects and doses are often lower than those applied in routine practice for visual interpretation of studies. A dual bolus of contrast with a dosage (or dilution) ratio of approximately 1:10 may help minimize saturation effects in the arterial input during the first pass of the lower-dosage bolus. The second larger bolus is used for measuring myocardial contrast enhancement, although it should be pointed out that saturation may still affect the vascular component of the signal in the myocardium, but there are no visual cues of saturation like in the case of the arterial input. For a quantitative analysis, the arterial input measured with the small bolus is scaled up to the dosage used for the measurement of the myocardial enhancement, and aligned with the start of blood pool enhancement from the second bolus. As can be surmised from the signal intensity curves measured with a dual-bolus technique, postprocessing requires selecting portions of signal-intensity curves for arterial input and myocardial enhancement, respectively, matching them up along the time axis, all requiring user input ( Fig. 4 ). A so-called dual-sequence approach may be an alternative to the dual bolus because it is based on the combined measurement of the blood pool input function and myocardial signals with different T1 weighting. For the arterial input images, one acquires low-resolution images within less than ∼40 ms with a T1 weighting that is less sensitive to T1 changes but offers a wider linear range (for the relationship between signal intensity and R1 = 1/T1), followed by myocardial images with a stronger T1 weighting of the signal intensity, but smaller linear range. The dual-sequence approach avoids variation between bolus injections, and ensures almost perfect temporal alignment for the signal intensity curves depicting contrast enhancement in the arterial input and myocardial segments.

Two approaches have been applied for the quantification of MBF from regional signal intensity curves: one is based on a tracer-kinetic model for the blood-tissue exchange (BTEX) of contrast, representing the vascular and interstitial compartments as functional spaces between which contrast is exchanged via a (capillary) barrier, after contrast enters the tissue through its arterial input. This BTEX type of model was first applied for quantification of myocardial perfusion with an intravascular contrast agent by Kroll and colleagues and later used also for studies with extravascular agents. It required careful adjustment of some fixed parameters of the model, as one can generally only leave blood flow and 1 volume parameter as variable fitting parameters to ensure reproducible results. (Alternatively, one can use an intravascular contrast agent, which allows simplification of the model.) A second approach for quantification is based on the central volume theorem of Meier and Zierler, which states that the amplitude of the myocardial impulse response equals blood flow. It is illustrated in Fig. 5 . Furthermore, the myocardial impulse response, when convolved with a measured arterial input, predicts the myocardial contrast enhancement. To be of practical value, this relationship between the myocardial impulse response and myocardial enhancement has to be inverted to estimate blood flow: the impulse response is estimated by deconvolving the measured myocardial contrast enhancement curve, with the measured arterial contrast enhancement curve. Deconvolution falls into a category of mathematical problems that are termed “ill-posed,” as there is no mathematically unique solution, and one has to effectively apply constraints based on physiologic or empirical insights to recover a solution that represents a good “physiologic” approximation. One approach is to constrain the impulse response to a certain class of shapes, based on observations from simulations with tracer-kinetic problems. A Fermi function has proven to be a reasonable approximation for the tissue impulse response, at least during first pass of the contrast agent, and used as a parametrized representation of the impulse response for deconvolution of the measured myocardial contrast enhancement. An advantage of the “deconvolution” approach is that it obviates the need a model of the BTEX, that may include parameters with poor sensitivity to the measurement conditions, and therefore may require some user adjustment. For further details the reader is referred to earlier reviews on blood flow quantification by CMR.

High Spatial Resolution
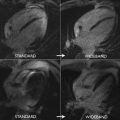
A variety of recent techniques have provided a more than 10-fold reduction in image acquisition time from undersampling of the image data by taking advantage of spatial, temporal, or spatio-temporal redundancy in the image data. Spatial redundancy follows from use of parallel receive coils/channels, and gave rise to parallel-imaging acceleration techniques. Temporal redundancy is due to the serial acquisition of images for a single time point in cardiac cycle, and because contrast enhancement proceeds at a slower rate than the image acquisition rate. These forms of data-redundancy in a “conventional” perfusion scan (ie, without use of undersampling) imply that undersampling in both the spatial and time domains ( k-t ) can be performed to reduce the image acquisition time within bounds deemed acceptable for signal-to-noise, image quality, artifact absence, and so forth. Various k-t undersampling/acceleration techniques have been used for myocardial perfusion CMR, such as TSENSE, k-t BLAST, and more recently k-t principal component analysis (PCA). Other, arguably more esoteric methods relate to the highly constrained back-projection reconstruction (HYPR), in which k -space data are obtained by undersampled radial projections, possibly combined with an overall rotation of the sampling pattern during the course of dynamic imaging. Missing data due to undersampling is restored from neighboring time frames. This technique also presents a greater signal-to-noise ratio adjusted for pixel size. The gains from imaging acceleration have been put to use to allow an in-plane spatial resolution of below 1.5 to 2.0 mm and still acquire 3 to 4 images per heartbeat, whereas traditional studies achieved an in-plane resolution of 2.5 to 3.0 mm for a similar number of slices per heartbeat.
In CMR perfusion imaging, higher spatial resolution significantly reduces dark-rim artifacts because they are proportional to voxel size. Application of k-t techniques in 3.0 T may reach up to eightfold acceleration and a resolution of 1.1 mm. This combination improved diagnostic performance of the method in CAD-suspected patients undergoing angiography (AUC, 0.93 vs 0.83; P <.001), which can be attributed to a better detection of subendocardial ischemia. Quantitative analyses based on high-resolution perfusion stress imaging seems to be feasible and may even allow assessment of transmural gradients. However, temporal filtering effects inherent to k-t acceleration techniques may introduce a bias of underestimating blood flows and further optimization may still be needed to define the clinically acceptable limits for imaging acceleration.
Three-Dimensional Whole-Heart Coverage
Faster image acquisition also paved the way for the development of whole-heart 3D myocardial perfusion CMR imaging. Three-dimensional perfusion CMR conceivably addresses an important limitation of the multislice 2D imaging, which is the lack of complete myocardial coverage (in 2D, only 3–4 noncontiguous slices are obtained). Also, in 2D CMR sequences, slices correspond to different phases of the cardiac, whereas in 3D, acquisition is made in a diastolic phase and can be matched with other data obtained, for instance, of LGE. A drawback of 3D perfusion imaging is that one can use only a relatively short fraction of the cardiac cycle for the acquisition of image data in order to minimize artifacts from cardiac motion. With 2D perfusion imaging, the acquisition of image data for each slice is self-contained, and avoidance of motion-induced artifacts or blurring involves minimizing this acquisition time per slice rather than the total acquisition time during each cardiac cycle.
Visually interpreted 3D-CMR perfusion examinations have achieved promising results, although superiority of 3D compared with 2D perfusion imaging remains to be shown in head-to-head comparisons. Manka and colleagues assessed 146 patients at suspicion for CAD with a k-t imaging acceleration technique achieving 2.3-mm spatial resolution, and found sensitivity of 92%, specificity of 74%, and accuracy of 83% compared with quantitative coronary angiography ≥50%. At 3.0 T, diagnosis accuracy reaches 91% (sensitivity of 90% and specificity of 90%) when the standard comparison is a physiology method such as FFR by angiography.
As for quantitative analyses, multicenter data demonstrate accuracy of 3D CMR perfusion imaging and accurate quantification of the ischemic volume relative to the entire myocardium. Newly developed protocols have been released and promising results published. Fully 3D quantitative evaluations of MBF would eliminate the necessity to identify a “normally” perfused region of myocardium as reference, and could match up with the standard quantitative method PET but with the advantage of widespread availability, better spatial resolution, and absence of harmful radiation. Notwithstanding, some of the drawbacks related to the method must be addressed, such as the requirement for accurate arterial input sampling. A dual-sequence/dual-contrast using k-t PCA for spatially and temporally undersampled data yielded 3D perfusion images with higher signal-to-noise ratio (at contrast doses of 0.1 mmol/kg, and compared with 2D perfusion imaging), and addressed the issue of nonlinear (in relation to contrast concentration) contrast enhancement. Acquisition of data for k-t PCA 3D perfusion imaging may take place either in diastole or systole, but with a possible preference for systole because the LV wall is thicker, thereby facilitating an analysis of subendocardial perfusion. Also, during systole, dark-rim artifacts, which tend to have a constant width independent of cardiac phase, tend to be less of a nuisance than for diastolic images with a thinner LV wall. Other shortcomings of 3D fully quantitative analyses still need further research, such as a lack of standardized contrast-dosing, imaging acquisition and postprocessing protocols. More importantly, large clinical trials need to validate the current findings.
Microvascular Perfusion
Microvascular disease may appear as a subendocardial concentric perfusion defect. As it may not respect coronary territories its diagnosis may be difficult. It frequently coincides with the presence of LV hypertrophy and in individuals with diseases that lead to capillary rarefaction or dysfunction of the microcirculation, such as diabetes and hypertension. The appearance of a diffuse subendocardial perfusion defect may also take place in the presence of balanced multivessel coronary disease and a differential diagnosis may be challenging. In addition, although coronary angiography may differentiate microvascular disease and multivessel epicardial (macrovascular) disease, it may lead to inappropriate exclusion of microvascular disease when it is in fact present if accurate tools to rule out the diagnosis are not applied during angiography.
Assessment of Wall Motion Segmental Contractility
Exercise has already been used in CMR to induce ischemia, but the logistics to reach a sufficient level of exercise is difficult to impossible within the confines of a magnet bore and pharmacologic stress remains the method of choice for clinical CMR studies. As the heterogeneity of the flow does not lead directly to ischemic abnormalities of wall motion except in cases of more severe perfusion reduction, it is not surprising that the assessment of wall motion during vasodilator stress results in a lower sensitivity and higher specificity for the detection of coronary disease than the use of inotropic drugs. Therefore, stress-related contractility assessment should be preferably carried out with inotropes.
Nagel and colleagues compared the segmental abnormalities of the LV wall induced by ischemia during dobutamine infusion by CMR with stress echocardiography in 208 consecutive patients with suspected CAD before cardiac catheterization. In this study, dobutamine CMR provided better sensitivity (89% vs 74%) and specificity (86% vs 70%) than stress echocardiography with dobutamine to detect coronary artery stenosis greater than 50%. Likewise, Hundley and colleagues, using dobutamine in 163 patients with unfavorable echocardiographic windows, demonstrated sensitivity and specificity of 83% in the detection of coronary stenosis greater than 50% per coronary angiography. Various studies of CMR using dobutamine to induce of ischemia suggest that the presence of segmental contractile dysfunction in only 1 segment (6% of ischemic load) is already a predictor of worse outcome. Any difference between the number of segments with reduced perfusion and the number of segments with wall motion abnormalities could be explained by the sequence of events in the ischemic cascade. As hypoperfusion precedes contraction abnormalities, it is possible that the extent of hypoperfusion exceeds the hypokinetic segments.
Myocardial Viability
Assessment of contractile reserve, as in stress echocardiography, was the first approach to assessing myocardial viability by CMR, but the technique has evolved considerably with the introduction of LGE images. Viability can be estimated by wall thickness ratio (rest/stress), contractile reserve, and LGE currently considered gold-standard method for viability.
Myocardial Contractile Reserve and Relative Wall Thickness
In line with echocardiographic data, the presence of thinned myocardium can indicate lack of viability. Baer and colleagues demonstrated that a diastolic wall thickness of 5.5 mm could be used to delimit myocardial segments with preserved metabolic function from those without, as evaluated by FDG PET. In a later study, the same group demonstrated that was almost never a recovery of regional function when the thickness of diastolic wall was less than 5.5 mm ; however, the reverse was not always true, that is, functional recovery did not occur universally in regions with wall thickness greater than 5.5 mm. Thus, the evaluation of diastolic wall thickness, although sensitive, offers poor specificity for predicting functional recovery.
Thickening of the ventricular wall of 2 mm during low-dose dobutamine greatly improves the specificity of technique. In the study by Baer and colleagues, dobutamine increased specificity to 92% with sensitivity remaining at 86% to predict post-revascularization functional recovery. A consistent finding in dobutamine stress, however, is the high specificity of the technique, similar to the stress echocardiogram. To achieve higher observer-independence techniques, such as tissue “tagging” and feature tracking for the analysis of myocardial deformation (“strain”) offer the potential to further improve on the reported results, although the additional postprocessing required by these techniques has been a persistent deterrent to their clinical application.
Late Gadolinium Enhancement
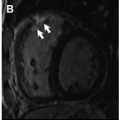
Excellent tissue characterization is one of the main advantages of CMR and the exploitation of this through the use of T1-weighted contrast images to define infarcted and irreversibly damaged myocardium has been one of the most significant advances in CMR. Although the exact reasons for the hypersignal in replacement (or interstitial) fibrosis continue to be a subject of intense scrutiny, the likely mechanism is a combination of arrival and output kinetics of the gadolinium within the myocardium and different volumes of distribution of gadolinium in viable cells and nonviable regions. The injected extracellular gadolinium contrast agent distributes within the entire tissue volume after myocardial infarction, whereas in normal myocardium, gadolinium is excluded from the intracellular space, that is, from approximately two-thirds of the tissue volume.
In acute myocardial ischemia the integrity of the membrane of the sarcolemma is lost, effectively a marker of cell death, allowing gadolinium to get into cardiomyocytes and resulting in signal hyperintensity. In chronic disease, the tissue transforms into a dense collagen matrix with a greatly expanded interstitial space accessible to gadolinium contrast. Although some animal studies have demonstrated that the size and transmural depth of the infarction may be slightly overestimated (9%–12%) in the immediate postinfarction phase, these indicators are stable and reflect the actual extension of the scar after 1 week.
Late Gadolinium Enhancement in Clinical Practice
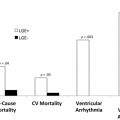
Experimental and clinical studies indicate that the extent of LGE is reproducible and closely correlates with the size of the myocardial necrosis or scar of infarction as determined by in vitro and in vivo methods established. Subendocardial LGE is highly specific for the detection of myocardial infarction. In addition, the detection of myocardial infarction is associated with a significantly increased risk of death subsequent to adverse cardiac events, adding incremental prognostic information to the evaluation of ventricular function. Finally, the extent of myocardial LGE is emerging as a tool to determine the response to new medical and interventional therapies. The probability of functional recovery by segment is inversely related to the transmural extension of the infarct. Zero percent to 25% transmural extension is associated with 82% probability of contractile function recovery, a 26% to 50% transmural extension, with 45% probability of recovery, and among segments with 51% to 75% transmural extension only 7% recovered. None of the segments presented recovery when the transmural extent of LGE was 75% or larger. Subsequent studies by other groups corroborated these results. In addition to the response to revascularization, the extent of viable myocardium in ischemic cardiomyopathy also appears be a predictor of response to beta-blockade and myocardial scar may be useful in the selection of patients who will benefit from resynchronization therapy.
Clinical Prognosis Assessment
Coelho-Filho and colleagues demonstrated in a relatively large number of women and men, that there were no significant differences between men and women regarding the diagnosis of CAD or for risk stratification of major adverse cardiovascular events using CMR stress perfusion imaging. But the method can shed light on the pathophysiology of chest pain with normal epicardial coronary arteries (“syndrome X”), a clinically not uncommon distressing condition in postmenopausal women. Quantitative myocardial perfusion CMR has been validated against invasive measurements of coronary flow reserve in patients with microvascular dysfunction; it was found to provide excellent correlation with the catheter-based measurements. Panting and colleagues identified myocardial subendocardial hypoperfusion during adenosine infusion in this set of patients (X syndrome), and Doyle and colleagues reported reduction in coronary flow reserve in similar patients. Coronary flow reserve is also reduced in hypertension, myocardial hypertrophy, and in some cardiomyopathies.
Acute Chest Pain
Stress perfusion CMR can provide prognostic information in various clinical settings. In the acute chest pain scenario, Ingkanisorn and colleagues have shown that adenosine stress CMR may determine the prognosis in patients with inconclusive electrocardiogram for CAD and negative biomarkers for acute coronary syndrome. In such patients, a negative perfusion stress CMR virtually excluded CAD or unfavorable clinical outcomes: no patient with normal examination had an adverse cardiac event. In a population with chest pain presenting to the emergency department, perfusion stress CMR was shown to have a sensitivity of 100% and a 93% specificity in the prediction of subsequent myocardial infarction or detection of coronary stenosis during 1 year of follow-up.
Chronic Chest Pain
Results are similar for patients with suspected CAD. In a cohort of 513 patients, Jahnke and colleagues examined the value of adenosine stress CMR perfusion and dobutamine stress CMR to help predict cardiac death and nonfatal myocardial infarction. At 3 years of follow-up, event-free survival reached 99.2% for patients with normal CMR and 83.5% for those with an abnormal perfusion. Abnormal CMR yielded a probability of death or nonfatal infarction beyond estimated risk from the presence of clinical risk factors (likelihood ratio, χ 2 = 16.0–34.3, P = .001). In this study, stress CMR, either by perfusion or by wall motility, contributed with incremental value regarding traditional factors such as age, sex, smoking and diabetes, although the combination of both techniques did not increase stratification power. A normal perfusion was associated with an event rate extremely low, 0.7% at 2 years, 2.3% at 3 years, and an abnormal perfusion study with corresponding rates of 6.2%, 12.2%, and 16.3%. In the multivariate analysis, adjusting for other risks, the detection of an abnormality of perfusion was associated with a 10-fold increase in risk of cardiovascular events (death or myocardial infarction). In another study of 218 patients with negative perfusion studies followed for more than 2 years, there were no deaths or infarction, percutaneous coronary intervention or coronary revascularization surgery.
Related posts:
 The Role of Cardiac MR Imaging in the Assessment of Patients with Cardiac Amyloidosis
 Applications of Cardiac MR Imaging in Electrophysiology
 The Role of Contrast-Enhanced Cardiac Magnetic Resonance in the Assessment of Patients with Malignant Ventricular Arrhythmias
 Automated Quantitative Stress Perfusion in a Clinical Routine
 The Prognostic Value of Late Gadolinium Enhancement in Nonischemic Heart Disease
 The Value of T1 Mapping Techniques in the Assessment of Myocardial Interstitial Fibrosis
Stay updated, free articles. Join our Telegram channel

Full access? Get Clinical Tree


