Dynamic contrast-enhanced (DCE) MR imaging is used increasingly often to evaluate tumor angiogenesis and the efficacy of antiangiogenic drugs. In clinical practice DCE-MR imaging applications are largely centered on lesion detection, characterization, and localization. In research, DCE-MR imaging helps inform decision making in early-phase clinical trials by showing efficacy and by selecting dose and schedule. However, the role of these techniques in patient selection is uncertain. Future research is required to optimize existing DCE-MR imaging methods and to fully validate these biomarkers for wider use in patient care and in drug development.
Key points
- •
Dynamic contrast-enhanced (DCE) MR imaging methods track the passage of a contrast agent bolus through tumor microvessels, thus enabling estimation of blood flow, blood volume, and permeability.
- •
DCE-MR imaging has some limited practical applications in clinical medicine that include screening for disease, lesion localization and characterization, and monitoring response to therapy.
- •
DCE-MR imaging has a well-established role in go/no-go decision-making tools in early-phase trials of angiogenesis inhibitors.
- •
Further prospective studies with adequate power are required to determine whether DCE-MR imaging and other imaging techniques have a role as prognostic biomarkers or predictive indicators to specific antiangiogenic therapies.
- •
Imaging techniques such as DCE-MR imaging have been hampered by a lack of validation and addressing this shortfall is an area of intense current research.
Introduction
Over the last 30 years there has been much interest in using imaging to identify, quantify, and monitor change in the vascular architecture and function of tumors, particularly in tracking response to antiangiogenic therapy. Although the term angiogenesis dates back to 1971 with the seminal publication by Folkman, initial computed tomography (CT), MR imaging, or PET studies evaluating angiogenesis in preclinical models of cancer and in patients were not published until the late 1980s. Following a steady increase in publications to around 200 per year, interest in imaging angiogenesis pathways and therapeutic inhibition was further fueled in the early 2000s, when the modest survival advantage of vascular endothelial growth factor (VEGF) inhibition became clear in renal, colorectal, non–small cell lung, hepatocellular, ovarian, and other cancers. From 2004 until the present date, more than 400 journal articles covering imaging and angiogenesis in cancer have been published yearly and this trend continues to increase.
Imaging studies can probe tumor angiogenesis in various different ways. PET tracers can show proof of mechanism by mapping and quantifying the in vivo distribution of drug targets, including VEGF receptors and α v integrins. Clinical studies have mapped and quantified drug-target interaction for VEGF inhibitors and α v integrin–targeted agents. This research not only shows proof of mechanism but also helps to map the variation in drug target expression. For example, the uptake of 18 F-galacto-RGD peptide (α v β 3 -selective PET tracer) showed substantial spatial variation between individual patients with breast cancer and also between primary and metastatic lesions in the same individuals. These molecular imaging studies are expensive and limited to specialist centers, but provide clear mechanistic data to facilitate drug development.
In contrast, most studies that image angiogenesis quantify and map aspects of the microenvironment at the phenotypic level, rather than the molecular level. These methods are also expensive and require investment of time from both patients and scientists. This article focuses on the role of T 1 -weighted dynamic contrast-enhanced (DCE) MR imaging as a method of evaluating tumor angiogenic signatures and response to therapy in the clinic and in research applications. It summarizes the major strengths and limitations and provides examples, with particular focus on how DCE-MR imaging has altered decision making. The benefits of DCE-MR imaging are then contextualized with other competitor methods (imaging and nonimaging) and the unmet needs and future directions of angiogenesis imaging are discussed.
Key methodological decisions
The term DCE-MR imaging represents a family of related methods, all of which image the passage of low-molecular-weight gadolinium-based contrast agents as they traverse the tumor vasculature. All methods require a T 1 -weighted sequence to be performed and serial images are collected so that the differences in contrast agent concentration within the tumor can be visually interpreted (qualitative assessment by radiologist) or measured (semiquantitative or truly quantitative assessment by imaging scientists) ( Fig. 1 ). In general, scan quality (determined by spatial resolution) is sacrificed for speed of repeated acquisitions (to enable high temporal resolution, to track passage of the contrast agent bolus), markedly so in the case of quantitative DCE-MR imaging.
DCE-MR imaging data analysis requires several key decision-making steps, which in turn impose requirements on data acquisition strategies. These steps are outlined in detail elsewhere (references are cited later), but key questions are:
- 1.
Will data analysis be based on signal intensity changes only, or will an attempt be made to turn measured signal changes into dynamic alteration in contrast agent concentration? The former approach is used widely in clinical decision making where the overall shape of the enhancement curve may distinguish benign and malignant disease (eg, breast cancer ) or where the presence of a hot spot may indicate tumor location (eg, prostate cancer ). However, this approach is not useful in therapeutic trials.
- 2.
How will T 1 be mapped? If semiquantitative or quantitative data are required, then signal intensity changes must be converted to dynamic flux in contrast agent concentration. Consensus recommendations require mapping of the T 1 values in a tumor to achieve this. However, several different approaches exist to produce a T 1 map, with differences in their time constraints and accuracy.
- 3.
Will an input function be measured? Some parameters are derived from DCE-MR imaging by applying a tracer kinetic model to describe the relationship between the feeding vessel (usually a large artery, such as aorta, femoral, or carotid, but occasionally a cerebral vein) and the tumor. However, measuring the input function is difficult and so many investigators use either a mathematical approximation or an averaged function derived from patient data collected previously.
- 4.
Will a tracer kinetic model be applied to the data? Semiquantitative data may be analyzed by defining a parameter such as uptake slope, or by measuring the area under the enhancement curve at a given time, such as 60 or 90 seconds after contrast agent injection. Alternatively, the data may be modeled to attempt to derive physiologic parameters of varying sophistication. If modeling is used, then there are several different models of increasing complexity that may be applied. Modeling sounds attractive, but requires specialist image analysis software or reliance on vendor packages that may not describe the data appropriately. As models become increasingly complex they generate more parameters that seem, superficially, to better describe pathophysiologic processes such as flow and permeability, but are increasingly unstable and prone to fit errors.
- 5.
Will the tumor be analyzed on a voxel-by-voxel basis? Tumors are biologically heterogeneous and this can be quantified by imaging. There is some evidence that measuring the overall degree of heterogeneity (eg, the histogram distribution of DCE-MR imaging values in glioma ) or identifying specific tumor subregions (eg, viable vs necrotic regions in preclinical data ) may detect important biological features of tumors that are masked by simple average-value analyses. However, some DCE-MR imaging analyses only measure the median or mean parameter value for a tumor.
Thus, acquisition and analysis approaches vary considerably, not only between clinical and research applications but also between individual hospital institutions and laboratories. This variation has important consequences. Studies may seem to derive equivalent biomarkers, such as the bulk volume transfer coefficient ( K trans ), but the meaning and numerical value of this parameter varies between studies depending on T 1 mapping, use of input function (or not), model choice, and other factors. This variation has some effect on comparing data from studies in which reductions in parameter are measured (eg, percentage change in K trans ). However, lack of method standardization prevents multicentre comparison of raw values of K trans (eg, as a prognostic or predictive test) because a 5-fold difference in parameter value could be caused by methodology differences rather than disease characteristic; this is a stark difference from well-established tests such as systolic blood pressure, full blood count, cancer antigen 125 (CA 125), or echo-derived left ventricular ejection fraction, in which biologically relevant small differences in measurement can be detected between different clinics or laboratories. This issue has limited application of DCE-MR imaging in some aspects of clinical medicine and so standardization and harmonization of parameters such as K trans have become major priorities for imagers, seen within groups such as the Radiological Society of North America sponsored Quantitative Imaging Biomarkers Alliance initiative.
Clinical applications
In most clinical applications, DCE-MR imaging is performed in nonspecialist centers and analysis is tailored to describing simple qualitative metrics such as curve shape or rapidity of enhancement and washout. It is rare to perform tracer kinetic modeling in the clinic. Most often, DCE-MR imaging is used to characterize lesions as malignant or not and is used as part of a wider MR imaging examination, including anatomic and other advanced techniques, such as diffusion-weighted imaging (DWI). DCE-MR imaging data interpretation is qualitative and subjective in the clinical setting and reliant on an expert opinion by a highly trained radiologist on a per-patient basis. Two important clinical applications (breast cancer and prostate cancer) are discussed later, but qualitative DCE-MR imaging is also used to solve other clinical questions; for example, in distinguishing benign liver lesions from metastases and in targeting primary brain tumor biopsy sites in some centers.
Imaging Primary Breast Tumors
Breast cancer is the most frequently diagnosed cancer worldwide and is the leading cause of cancer death in women. It accounts for nearly one-quarter of all new cancer cases and accounted for 14% of all cancer deaths in 2008. Most patients with breast cancer undergo triple assessment (clinical, x-ray mammography, and ultrasonography with option of a biopsy) without the need for MR imaging. However, indications for using MR imaging in general and DCE-MR imaging in particular have increased over the last decade.
Technical issues surrounding image acquisition at 1.5 and 3 T are reviewed elsewhere. In brief, breast MR imaging is performed with a dedicated coil, with the patient prone and the breasts lying centrally within the receiver apparatus. This setup is designed to control patient motion, optimize patient comfort, and provide breast support. Typically, three-dimensional DCE-MR imaging sequences are acquired with a temporal resolution of around 20 to 30 seconds, near-isotropic resolution, and excellent uniform fat/water suppression throughout the volume of interest. At 1.5 T some compromise must be made between requirements for acceptable temporal resolution, high spatial resolution, and high signal/noise ratio, but at 3 T these difficulties are largely overcome and it is now routine to acquire high-quality volumetric images through both breasts simultaneously at around 1 volume every 15 seconds.
Many radiologists use simple visual inspection of signal intensity (SI) curves to define enhancement rate and SI curve shape. This work (eg, as reported by Kuhl and colleagues ) is simple to perform with a region of interest drawn on a series of images with or without correction for motion. This method has proved extremely useful in distinguishing benign from malignant lesions ( Fig. 2 ) and is still used daily by experienced radiologists in evaluation of breast lesions. Vendor packages offer the option of performing advanced analysis (pharmacokinetic modeling) as well as routine curve analysis.
Malignant breast lesion detection with dynamic contrast-enhanced MR imaging
Since the 1990s, DCE-MR imaging has been used to characterize malignant breast lesions. In general terms, malignant lesions were found to have washout of contrast agent after initial rapid enhancement, reflecting greater microvessel density and greater microvascular permeability. Over time, the relative values of various features, such as rim enhancement and lesion spiculation, have been realized and incorporated into scoring systems. The American College of Radiology BI-RADS-MRI Lexicon classification system provides a simple method of reporting likelihood of malignancy in a breast lesion. Multiple studies suggest that the area under the curve for receiver operator characteristic (ROC) curve analysis to distinguish benign from malignant disease is typically 0.8 to 0.9 depending on each study analysis. In practice, most patients still undergo ultrasonography or x-ray mammographic assessment and DCE-MR imaging is reserved for problem solving of cases that remain equivocal. Therefore, the true positive predictive value for this technique as used in clinical practice may be lower than the data discussed earlier imply.
Screening in high-risk populations with dynamic contrast-enhanced MR imaging
Several gene mutations have been identified that predispose women to higher risk of developing breast cancer. Mutations in the BRCA1 and BRCA2 genes result in a cumulative risk of breast cancer by the age of 70 years of 39% to 87% and 26% to 91%, respectively, and in many cases these women develop cancer at an early age. Some rarer gene mutations, such as TP53, also confer high risks, and evidence is growing of further mutations in a range of genes that singly cause a small increase in risk, but may increase breast cancer risk in some women by acting together. These women with increased risk of breast cancer can be identified by performing genetic testing for breast cancer predisposition mutations typically triggered following evaluation of family history. Because many of these patients are young, there is a need for appropriate screening methods for these subpopulations at high risk of developing breast cancer.
X-ray mammography is an effective screening method in the normal population in women in their late 40s and older. It is less effective in younger high-risk women, in whom the higher proportion of breast parenchyma to fat can result in dense mammograms that are hard to interpret. Several large multicentre studies have evaluated the role of DCE-MR imaging in screening for cancers in women with a high genetic risk of breast cancer. Results are consistent: DCE-MR imaging is the most sensitive method for detecting cancer in women with strong familial risk of breast cancer, despite the differences in the age range of patients and in the percentage risk for developing breast cancer relative to the normal population required for entry into each study. For example, in the MR Imaging in Breast Cancer Screening (MARIBS) study, a standardized acquisition and analysis approach was used in 22 centers, following training to ensure compliance. Prescriptive analyses were followed, using both morphology (well or poorly defined, spiculation), enhancement pattern (homogeneous, heterogeneous, rimlike), simple quantification of enhancement upslope, and washout pattern (based on the grading system of Kuhl and colleagues ). This system allowed lesions to be graded as malignant, suspicious, or benign. This study and other similar studies have shown the sensitivity of DCE-MR imaging to be approximately twice that of x-ray mammography (75%–90% vs 40%). Combined with mammography, DCE-MR imaging has a sensitivity of more than 90%, with a recall rate of around 10%. The additional benefit was largely from detection of small, node-negative tumors. The strength of these results has enabled guidelines to be issued regarding the high-risk groups who may benefit from annual breast screening using DCE-MR imaging.
Dynamic contrast-enhanced MR imaging–based early assessment of response to chemotherapy
Around 5% of patients with breast cancer receive cytotoxic neoadjuvant chemotherapy (NAC). Because approximately one-third respond poorly to this therapy, there is interest in using advanced imaging techniques to identify those patients who are responding to NAC as soon as possible. Several independent studies have reported a statistically significant reduction in K trans or similar parameters in breast cancer at or around 2 completed cycles of therapy in patients treated with a variety of different cytotoxic regimens. These small studies suggest that larger reductions in K trans indicate subsequent favorable response. This finding is consistent with preliminary evidence from 62 patients (120 evaluable DCE-MR imaging scans) that suggested that those with persistent higher K trans values after around 2 cycles of treatment with NAC have a significantly worse overall survival compared with those with a lower/reduced K trans value, using multivariate analysis that included other imaging and nonimaging indicators of prognosis. Further studies are required to test whether these findings are repeatable, robust, and can be translated into altered treatment selection and improving outcomes for those patients who show early indicators of poor response to NAC.
Imaging Tumor Foci Within the Prostate Gland
Prostate cancer is a major health concern because there is around 8% cumulative risk of men developing the disease by 75 years of age, making it the second most frequently diagnosed cancer worldwide and accounting for 14% of all cancer deaths. Diagnosis is made by ultrasonography-guided random biopsies, following prostate-specific antigen measurement and digital rectal examination. Nearly all patients then undergo MR imaging for staging assessment. There is considerable variation in MR imaging technique in examining the prostate, particularly in field strength and in the use of body or endorectal coil. Few studies have examined these issues in detail and at present the value of high field strength and use of an endorectal coil have not been proved.
The marked variation seen in prostate DCE-MR imaging, diffusion-weighted, and spectroscopy protocols and their adoption in multiparametric imaging has prompted attempts to define consensus recommendations for use in imaging in prostate cancer. However, these guidelines are not universally accepted. Thus, the value of DCE-MR imaging in assessment of prostate cancer is yet to be fully determined despite the considerable promise shown to date.
Lesion detection and localization with dynamic contrast-enhanced MR imaging
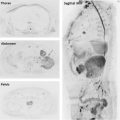
Primary tumors are difficult to identify accurately within the prostate gland using conventional T 1 -weighted and T 2 -weighted MR imaging. DCE-MR imaging parameters such as flow are increased in prostate cancer relative to the normal glandular tissue, which has prompted interest in how DCE-MR imaging, DWI, and other techniques might be used to aid prostate cancer diagnosis and monitoring. At present, DCE-MR imaging, along with DWI and MR spectroscopy, are used widely but inconsistently across specialist cancer centers ( Fig. 3 ).
Related posts:
 Body Diffusion-weighted MR Imaging in Oncology
 Clinical Imaging of Tumor Metabolism with 1H Magnetic Resonance Spectroscopy
Multiparametric MR Imaging in the Assessment of Brain Tumors
Multiparametric MR Imaging of Breast Cancer
Role of Multiparametric MR Imaging in Malignancies of the Urogenital Tract
Functional MR Imaging in Gynecologic Cancer
Clinical Imaging of Tumor Metabolism with 1H Magnetic Resonance Spectroscopy
Multiparametric MR Imaging in the Assessment of Brain Tumors
Multiparametric MR Imaging of Breast Cancer
Role of Multiparametric MR Imaging in Malignancies of the Urogenital Tract
Functional MR Imaging in Gynecologic Cancer
Stay updated, free articles. Join our Telegram channel

Full access? Get Clinical Tree


