Basic Rules of Reading CT Examinations
Anatomic Orientation
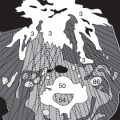
An image on the display is not only a 2D representation of anatomy, it contains information about the mean attenuation of tissue in a matrix consisting of about 1024 x 1024 elements (pixels). A section ( Fig. 14.1 ) has a defined thickness (dS) and is composed of a matrix of cubic or cuboid units (voxels) of identical size. This technical aspect is the reason for the partial volume effects explained below. An image is usually displayed as if the body were viewed from caudal. Thus the right side of the patient is on the left side of the image and vice versa ( Fig. 14.1 ). For example, the liver (122) is located in the right half of the body, but appears in the left half of the image. Organs of the left side such as the stomach (129) and the spleen (133) appear on the right half of an image. Anterior aspects of the body, for example the abdominal wall, are represented in the upper parts of an image, posterior aspects such as the spine (50) are lower. With this system CT images are more easily compared with conventional x-ray-images.

Partial Volume Effects
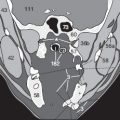
The radiologist determines the thickness of the image (dS). 4–6 mm are usually chosen for thoracic or abdominal examinations, and 2–5 mm for the skull, spine, orbits, or petrosal bones. A structure may therefore be included in the entire thickness of a slice ( Fig. 14.2a ) or in only a part of it ( Fig. 14.3a ). The gray scale value of a voxel depends on the mean attenuation of all structures within it. If a structure has a regular shape within a section, it will appear well defined. This is the case for the abdominal aorta (89) and the inferior vena cava (80) shown in Figures 14.2a, b .
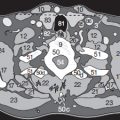
Partial volume effects occur when structures do not occupy the entire thickness of a slice, for example when a section includes part of a vertebral body (50) and part of a disk (50e) the anatomy will be poorly defined ( Figs. 14.3a, b ). This is also true if an organ tapers within a section as seen in Figures 14.4a, b . This is the reason for the poor definition of the renal poles or the borders of the gallbladder (126) or urinary bladder. Artifacts caused by breathing during image acquisition are discussed on page 19.


Distinguishing Between Nodular and Tubular Structures
It is essential to differentiate between possibly enlarged or affected LNs and vessels or muscles which have been cut in transverse section. This may be extremely difficult in a single image because these structures have similar density values (gray tones). One should therefore always analyze adjacent cranial and caudal images and compare the structures in question to determine whether they are nodular swellings or continue as more or less tubular structures ( Fig. 15.1 ): A lymph node (6) will appear in only one or two slices and cannot be traced in adjacent images (compare Figs. 15.1a, b, and c ). The aorta (89) or the inferior cava (80), or a muscle, for example the iliopsoas (31), can be traced through a cranio-caudal series of images.
If there is a suspicious nodular swelling in one image, it should become an automatic reaction to compare adjacent levels to clarify whether it is simply a vessel or muscle in cross-section. This procedure will also enable quick identification of the partial volume effects described on the previous page.

Related posts:


Stay updated, free articles. Join our Telegram channel

Full access? Get Clinical Tree


