Fig. 1.1
a Sound waves transmitted propagating through a medium, alternating between high and low pressures, transmitted over time. Compression occurs during high pressure waves, pushing molecules mechanically closer together. Rarefaction occurs during low pressure waves, causing molecules to be farther part. Period refers to the time required for one sound wave to pass. Wavelength refers to the distance travelled by one complete sound wave. Amplitude refers to the height of the wave. b Transmission of a series of pulses of sound waves by a transducer
Frequency, Period, Wavelength, Amplitude, and Power
A number of parameters are used to describe sound waves, and some of these have direct clinical relevance to the user. These parameters include frequency, period, wavelength, amplitude, and power.
Frequency is the number of waves passing per second, measured in hertz (Hz). Two closely related concepts are the period (p), which is the time required for one complete wave to pass, measured in microseconds (μs) and wavelength (λ), which is the distance travelled by one complete wave, measured in millimeters (mm) (see Fig. 1.1a). Frequency is inversely related to period and wavelength. That is, the shorter the period, the higher the frequency; the shorter the wavelength, the higher the frequency. Ultrasound equipment typically operates within the range of 1 megahertz (MHz) to 20 MHz, which is well above the range of human hearing, generally considered to be between 20 to 20,000 Hz (0.00002 to 0.02 MHz). An understanding of frequency is clinically relevant to the operator and users of ultrasound. Specifically, choosing an appropriate frequency range will affect both the resolution of the image as well as the ability to penetrate tissues and image structures at the desired depth.
Frequency is one of the factors determining spatial resolution. Spatial resolution refers to the ability of ultrasound to distinguish between two objects in close proximity to one another as being distinct objects. Higher frequency sound waves yield better resolution than lower frequency waves. However, this improved resolution for higher frequency sound waves is at the expense of lower penetration [15]. That is, higher frequency sound waves are less able to image structures that lie further away from the transducer than lower frequency sound waves. Therefore, for typical applications in the intensive care unit , higher frequencies are more useful for imaging superficial structures while lower frequencies are more useful for imaging deeper structures. Thus, transducers with frequency ranges of 5 to 15 MHz are used for imaging superficial structures such as superficial vascular anatomy while ranges of 2 to 5 MHz are used for imaging deeper structures such as intra-abdominal organs.
Amplitude refers to the strength of the sound wave, as represented by the height of the wave (see Fig. 1.1a). Amplitude is measured in units of pressure, Mega Pascals (MPa). Power of the sound wave, refers to the total amount of energy in the ultrasound beam, and is measured in watts [16]. Power and amplitude are closely related, with power being proportional to the square of the amplitude [17]. In using ultrasound, one must keep in mind that for instance, by only doubling the amplitude, four times the energy is being delivered to the patient.
Understanding concepts regarding amplitude and power is critical to appreciate in facilitating the safe use of ultrasound. In general, the performance of ultrasound scans should comply with the ALARA (as low as reasonably achievable) principle by keeping total ultrasound exposure as low as reasonably achievable [18]. All ultrasound machines capable of exceeding a pre-specified output are required to display two output indices on the output display: Mechanical Index (MI), which provides an indication of risk of harm from mechanical mechanisms, and Thermal Index (TI), which provides an indication of risk of harm from thermal effects [18, 19]. The higher the indices, the greater the potential for harm. The Food and Drug Administration (FDA) regulations allow a global maximum MI of ≤ 1.9, except for ophthalmic applications, where the maximum allowed TI should be ≤ 1.0 and MI ≤ 0.23 [20]. For obstetrical applications, the current recommendations are for MI and TI to be ≤ 1.0 and the exposure time to be as short as possible: generally 5 to 10 min and not exceeding 60 min [21, 22].
Generation of Sound Waves
The generation of sound waves was made possible by the discovery of the piezoelectric effect in 1880: certain crystals vibrate when a voltage is applied to it, and conversely, subjecting the crystal to mechanical stress will result in an electrical charge [23]. Utilizing this principle, the transducer of an ultrasound machine houses crystal elements (Fig. 1.2), such that by applying electrical energy through the cable to these piezoelectric crystals, they change shape, vibrate, and in so doing, convert electrical energy into mechanical energy. Conversely, the piezoelectric crystals can also convert mechanical energy back into electrical energy, thereby allowing it to act as both a transmitter and a receiver. Within the transducer, the piezoelectric crystal is supported by the backing material (see Fig. 1.2), which serves to dampen any backward-directed vibrations, while the lens in front of the crystal serves to assist with focus . Finally, the impedance matching layer in front of both the piezoelectric elements and the lens assists with the transmission of sound waves into the patient [24]. Together, these components allow the transmission and receiving of sound waves. Irrespective of the characteristics of the transmitted sound waves, all ultrasound imaging relies on users interpreting the display of sounds waves reflected back to the receiver. Thus, an understanding of how sound waves travel and reflect from tissue is critical knowledge for any sonographer.
Fig. 1.2
A schematic representation of components of an ultrasound transducer. Illustration courtesy of Mary E. Brindle, MD, MPH
Interactions of Sound Waves with Tissue
In order to understand how an ultrasound image is generated, it is important to understand the many ways in which sound waves propagate through and interact with tissue. Tissue characteristics such as density, stiffness, and smoothness, and surface size of the object being interrogated, all play critical roles in determining the amount of signal reflected back to the transducer. As only sound waves reflected back can assist in generating an image, it is critically important for the users to recognize how sound waves return to the transducer as well as how they fail to do so.
Propagation Velocity
The speed at which sound waves propagate within tissue is measured in meters per second (m/s). This velocity is determined by the density and stiffness of the tissue, rather than by characteristics of the sound waves themselves. Propagation velocity is inversely proportional to tissue density and directly proportional to stiffness of the tissue [17]. In other words, the denser the tissue, the slower the propagation velocity through that tissue, while the stiffer the tissue, the higher the velocity. In general, propagation speed is slowest through air (330 m/s) and fat (1450 m/s) and fastest through muscle (1580 m/s) and bone (4080 m/s) (Table 1.1) [25]. The average velocity through soft tissue is 1540 m/s, and it is this velocity that the ultrasound machine assumes its sound waves are travelling, irrespective of whether or not that is the case.
Medium | Propagation velocity (meters/second) | Acoustic impedance (kg/(m2s)) | Attenuation coefficient (dB/cm/MHz) |
|---|---|---|---|
Air | 330 | 430 | 10.00 |
Fat | 1450 | 1.33 × 10⁶ | 0.63 |
Water | 1480 | 1.48 × 10⁶ | 0.00 |
Average soft tissue | 1540 | 0.70 | |
Liver | 1550 | 1.66 × 10⁶ | 0.94 |
Kidney | 1560 | 1.64 × 10⁶ | 1.00 |
Blood | 1570 | 1.67 × 10⁶ | 0.18 |
Muscle | 1580 | 1.71 × 10⁶ | 1.30 (parallel)—3.30 (transverse) |
Bone | 4080 | 6.47 × 10⁶ | 5.00 |
Understanding propagation velocities of different tissues is important for three reasons. First, propagation velocities through different tissue interfaces determine the amount of sound wave reflections, which in turn, determines the brightness of the signal display. Second, differences in propagation velocities are an important source of artifacts (see the section “Speed Propagation Error”). If the sound waves travel through tissue at a slower velocity than is assumed by the machine (e.g., through air or fat), any wave reflections from the object of interest will be placed at a farther distance on the display from the transducer than the true distance. Finally, as all diagnostic ultrasound uses the above mentioned approximation of ideal tissue characteristics, ultrasound will never yield the same fidelity of imaging as computer tomography (CT) or magnetic resonance imaging (MRI).
When sound waves interact with tissue, any or all the following processes may occur: reflection, scattering, refraction, absorption, and attenuation [15].
Reflection
When ultrasound waves propagate through tissue and encounter interfaces between two types of tissue, some of the sound waves will be reflected back. This reflected sound wave is called an echo. As previously mentioned, ultrasound imaging hinges upon the production and detection of these reflected echoes. Production of an echo is critically dependent upon the presence of an acoustic impedance difference between the two tissue types. Acoustic impedance is a property of the tissue, and is defined as the product of its tissue density and the propagation velocity of sound waves through that tissue. If two tissue types have identical acoustic impedance, then no echo will be produced, as no sound waves will be reflected back.
The brightness of the signal is directly related to the amount of reflection, and that the amount of reflection is proportional to the absolute difference in acoustic impedance between the two media. It therefore follows that a large acoustic impedance mismatch between two tissue types will result in a bright echogenic signal, while a small acoustic impedance mismatch between another two tissue types will result in an echo-poor signal. For example, at the interface between the liver and kidney, because of a minimal acoustic impedance difference between the two tissues, only about 1 % of the sound is reflected (see Table 1.1). Thus the interface between the kidney and the liver is somewhat harder to distinguish from one another (Fig. 1.3a) and less echogenic than the interface between muscle and bone, which has a large acoustic impedance mismatch, resulting a bright echogenic line (see Fig. 1.3b). Finally, because of the very large acoustic impedance difference between tissue and air, upon encountering air, > 99.9 % of the sound waves are reflected. This results in minimal further propagation of sound waves. Therefore, beyond that interface, there is limited to no ability to further directly image structures [24]. This large acoustic impedance difference between air and skin is also the reason why coupling gel must be used for imaging purposes. Application of gel eliminates any air present between the transducer and the skin, assisting in the transmission of sound waves, rather than having most of them reflected back.
Fig. 1.3
a A longitudinal, oblique ultrasound view of liver and right kidney. Small acoustic impedance difference between liver and kidney results in a minimally echogenic interface between the two organs. b A transverse ultrasound view of the quadriceps muscle. Large acoustic impedance difference muscle and femur results in a bright echogenic interface between the two structures
A second factor that determines the amount of reflection is the smoothness of the surface. For smooth surfaces that are large, compared with the size of the ultrasound’s wavelength, specular reflection occurs (Fig. 1.4), resulting in a robust amount of reflection. However, for surfaces that are rough, where the undulations of the surfaces are of a similar size to the size of the ultrasound’s wavelength, sound waves are reflected in multiple directions. This results in diffuse reflection (Fig. 1.5) [26]. Because the returning echoes are in multiple directions, only a few of them are received back on the transducer. As a result, diffuse reflection results in a less echogenic signal.
Fig. 1.4
Specular reflection occurs when sound waves are reflected off a smooth surface that is large compared with the size of the wavelength
Fig. 1.5
Diffuse reflection occurs when sound waves are reflected off a rough surface of a similar size to the size of the wavelength
Scattering and Refraction
Additional ways in which emitted ultrasound waves do not reflect fully back to the transducer, resulting in attenuation of sound waves include scattering and refraction. Scattering occurs when ultrasound waves encounter objects that are small compared to the size of the ultrasound’s wavelength, [15] which serves to diminish the intensity of the returned signal (Fig. 1.6).
Fig. 1.6
Scattering occurs when sound waves are reflected off objects that are small compared with the size of the wavelength
Refraction occurs when sound waves pass from one medium to another with differing propagation velocities. These differing velocities result in refraction, or change in the direction of the original (or incident) sound wave [25]. The refracted angle, or magnitude of the change in direction of the ultrasound wave, is determined by Snell’s law using the following equation:
where θ1 is the angle of incidence in the first medium, V1 is the propagation velocity of sound in the first medium, θ2 is the angle of refraction, and V2 is the propagation velocity of sound in the second medium (Fig. 1.7). As can be seen from the equation, the higher the difference between the propagation velocities in the two media, the larger the magnitude of angle change of the refracted beam. Because the ultrasound machine assumes that the sound wave travels in a straight line and does not know that the sound path has been altered by refraction, [24] this results in artifacts such as the double-image artifact (see the section “Refraction Artifacts”). Thus, to minimize refraction, except for Doppler applications (see the section “The Doppler Effect”) , an ultrasound image should be obtained at an angle as perpendicular as possible to structure of interest, in order to minimize the angle of incidence (Fig. 1.8a, b).
Fig. 1.7
Refraction occurs when sound waves pass from one medium with a propagation velocity to another medium with a differing propagation velocity
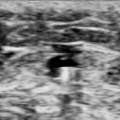
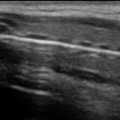
Fig. 1.8
a A transverse ultrasound view of the right carotid and internal jugular vein with the transducer angulated. b The same transverse ultrasound view of the right carotid and internal jugular vein with the transducer held at 90° to the structures. Without the need to modify any controls, the image resolution of the vascular structures is improved
Absorption and Attenuation
As sound waves propagate through tissue, part of the acoustic energy is absorbed and converted into heat. The amount of absorption that occurs is a function of the (1) sound wave frequency, (2) scanning depth, and (3) the nature of the tissue itself.
Higher frequency sound waves are absorbed more than lower frequency sound waves. As stated earlier in this chapter, although higher frequency sound waves yield better resolution than lower frequency sound waves, this improved resolution is gained at the expense of lower penetration [15]. The inability of high frequency sound waves to penetrate deeply into tissue is a direct result of high absorption and conversion of acoustic energy into heat. Thus, a shallower depth, provided it captures sufficiently the structure of interest in the field of view, will result in a better image than one at a deeper depth, as it results in less absorption.
The amount of absorption that occurs is also a function of the medium itself, with certain media resulting in higher attenuation than others. Overall attenuation through a particular medium is described by the attenuation coefficient, which is measured in decibel per cm per MHz (see Table 1.1). As can be seen in Table 1.1, very little absorption occurs in water while high attenuation occurs in bone and air.
All these described processes, such as diffuse reflection, scattering, refraction, and absorption, all serve to attenuate the strength of the returned echo signal, because they all ultimately in one way or another divert energy away from the main ultrasound beam [24].
Summary
Increasing frequency results in less penetration and more detail: Use high-frequency probe for vascular access, soft tissue, and pleura. Use low-frequency probes for the chest and abdomen.
Body habitus matters: Sound waves get absorbed and attenuated. With increasing soft tissue from skin to target organ, the quality of the image obtained decreases.
Watch out for air and bone: Bone will result in almost complete reflecton, making it impossible to image structures under it. Air is a poor conductor of sound, and it will result in artifacts and failure to obtain a quality image.
The Machine
An ever increasing number and variety of commercially available ultrasound machines are available from multiple manufacturers, [27] and which unit to purchase depends on a variety of factors such as price, durability, ease of use, image quality, ergonomic design, boot-up time, lifespan of the battery, and portability [27, 28]. The size of point-of-care devices is becoming smaller and with this trend, portability has correspondingly becoming better, with some of these point-of-care devices being no bigger or even smaller than the size of a laptop machine (Fig. 1.9a, b, c, d). While each machine has its unique instrumentation , some of the basic components are universal, and many devices offer similar functionalities.
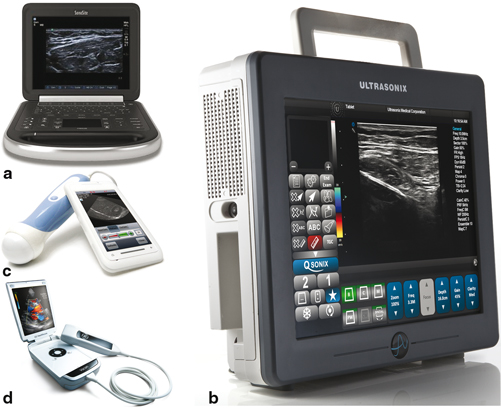
Fig. 1.9
a Portable ultrasound machine The Edge®. Image courtesy of FUJIFILM SonoSite, Inc., with permission. b Portable ultrasound machine SonixTablet. Image courtesy of Analogic Ultrasound/Ultrasonix, with permission. c Portable ultrasound machine MobiUS SP1 smartphone system. Image courtesy of Mobisante, with permission. d Portable ultrasound machine Vscan. Courtesy of GE Healthcare
The critical components of all ultrasound machines include a transducer, a pulser, a beam former, a processor, a display, and a user interface [26, 28].
Transducer, Pulser, and Beam Former
The function of the transducer, which is to emit and receive sound waves, has already been described (see the section “Generation of Sound Waves”). The piezoelectric elements which generate the ultrasound waves are typically arranged within the transducer either sequentially in a linear fashion offering a rectangular field of view (linear array), in an arch which offers a wider trapezoid field of view (convex or curved array), or steered electronically from a transducer with a small footprint (phased array) (Fig. 1.10), or less commonly, arranged in concentric circles (annular array).
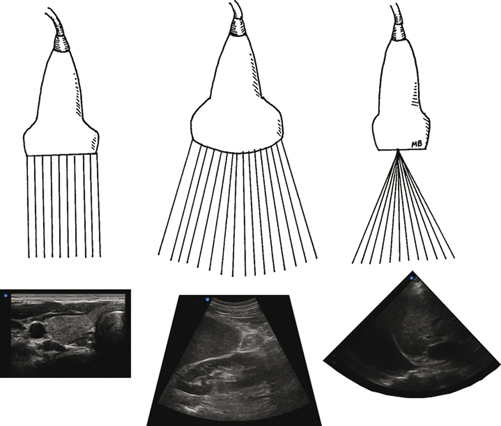
Fig. 1.10
A linear array transducer (left) where piezeoelectric elements are arranged in a linear fashion resulting in a rectangular field of view. A curved array transducer (middle) where transducer elements are arranged in an arch, resulting in a trapezoid field of view. A phased array transducer (right) where transducer elements are electronically steered, resulting in a sector or pie-shaped field of view. Illustration courtesy of Mary E. Brindle, MD, MPH and Irene W. Y. Ma, MD, MSc
Sound waves are transmitted in pulses (see Fig. 1.1b), by the pulser, also known as the transmitter. The pulser has two functions. First, it transmits sound waves as its electrical pulses are converted by the transducer’s piezoelectric elements into sound waves. Applying higher voltages will increase the overall brightness of the image. Practically however, the maximum resultant brightness is limited because the maximum voltage that can be applied and maximum acoustic output of ultrasound devices are restricted based on regulations by The FDA [29]. Second, the pulser controls the frequency of pulses emitted (number of pulses per second), known as the pulse repetition frequency (PRF). It is necessary that pulses of sound waves are delivered, instead of continuous emission of sound waves, so that in between the pulses, there is time for the reflected sound waves to travel back to the transducer [30, 31]. Thus, the time between pulses is essential to allow the transducer to listen, or receive echoes. The higher the PRF, the shorter is the “listening” time. Thus, to interrogate deeper structures, a lower PRF should be used, compared with imaging more superficial structures. Medical ultrasonography imaging typically uses PRFs between 1 to 10 kHz.
Once sounds waves are generated by the pulser, the beam former then controls both the shape and the direction of the ultrasound beam. The ultrasound beam has two regions: a near field (or Fresnel zone), and a far field (or Fraunhofer zone), where the beam begins to diverge (Fig. 1.11). Because sound waves are emitted from an array of elements along the transducer, these waves are subject to constructive and destructive interferences, especially in close proximity to the transducer, resulting in variable wave amplitudes in the near field. Resolution is optimal at the near field/far field interface, known as the focal zone [31, 32]. The beam former allows the ultrasound user to manipulate the focal zone at the desired spatial location either mechanically by the use of physical lenses or electronically by beam forming. In general, the focus level is represented by an arrow or arrowheads, displayed at either the left or right side of the image. To optimize resolution, the focus should be set at or just below the level of the area of interest (Fig. 1.12a, b, and c).
Fig. 1.11
Ultrasound beam shape
Fig. 1.12
a Transverse view of right carotid artery with focal zone set too low. b Transverse view of right carotid artery with focal zone set too high. c Transverse view of right carotid artery with focal zone set at the correct level
Processor, Display and User Interface
Once the returning echoes return, the transducer acts as a receiver for these signals that are then processed by the processor. Two primary characteristics of the echoes determine the image ultimately placed on the display: (1) strength of the echo, and (2) the time taken for the echo to return. First, the strength of the echo is displayed by its brightness, such that a stronger returning signal is more echogenic than a weaker returning signal. This is readily evident in structures where spectral reflection occurs, such as the diaphragm. However, ultrasound waves are not directed at perpendicular angles throughout the diaphragm. Thus, the portion of the diaphragm that is not at perpendicular angles with the transducer results in refraction of the sound waves. This refraction causes a weaker returning echo and a hypoechoic signal (Fig. 1.13). Second, the time taken for the echo to return is used by the processor to determine the distance of the object from the transducer, using the range equation (distance = velocity × time/2). As ultrasound assumes that all signals travel at a propagation velocity of 1540 m/s, the time taken for the echo to return will determine the location of the reflector. Information regarding brightness and distance is then collected from each scan line by an array of piezoelectric elements within the transducer and collated to form a 2-D B mode image (Fig. 1.14). This image is then shown on the display. As the user sweeps through a section of tissue with the transducer, real-time imaging is made possible by the rapid processing of multiple scan line data.
Fig. 1.13
Transverse image of the liver. Portions of the diaphragm at perpendicular angles with the transducer results in specular reflection and echogenic signals. Portion of the diaphragm at an oblique angle to the transducer (turquoise line) results in refraction (blue arrow) and hypoechoic signals
Fig. 1.14
 Other Important Issues: Training Challenges, Certification, Credentialing and Billing and Coding for Services
 Clinical Applications of Ultrasound Skills
 Basic Abdominal Ultrasound in the ICU
 Vascular Ultrasound in the Critically Ill
 Evaluation of Soft Tissue Under Ultrasound
 Cardiac Ultrasound in the Intensive Care Unit: Point-of-Care Transthoracic and Transesophageal Echocardiography


Related posts:
Other Important Issues: Training Challenges, Certification, Credentialing and Billing and Coding for Services
Clinical Applications of Ultrasound Skills
Basic Abdominal Ultrasound in the ICU
Vascular Ultrasound in the Critically Ill
Evaluation of Soft Tissue Under Ultrasound
Cardiac Ultrasound in the Intensive Care Unit: Point-of-Care Transthoracic and Transesophageal Echocardiography
Stay updated, free articles. Join our Telegram channel
Full access? Get Clinical Tree
