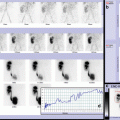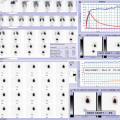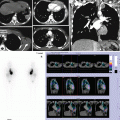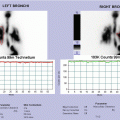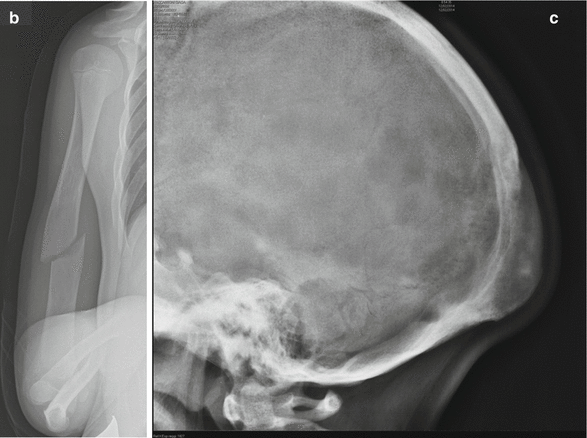
Fig. 26.1
(a) Bone scan shows multiple areas of intense uptake in the skull, bilateral humeral shafts, and proximal radii. (b–c) The right humerus plain film shows an oblique diaphyseal pathological fracture: the medullary channel is enlarged and the cortical is thinned with reduced bone density (b); lateral skull radiograph (c): enlargement of the occipital diploe with inhomogeneous reduced bone density
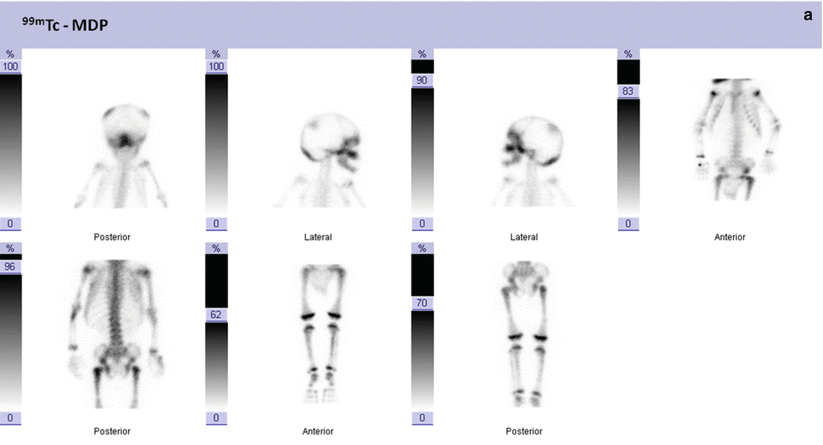
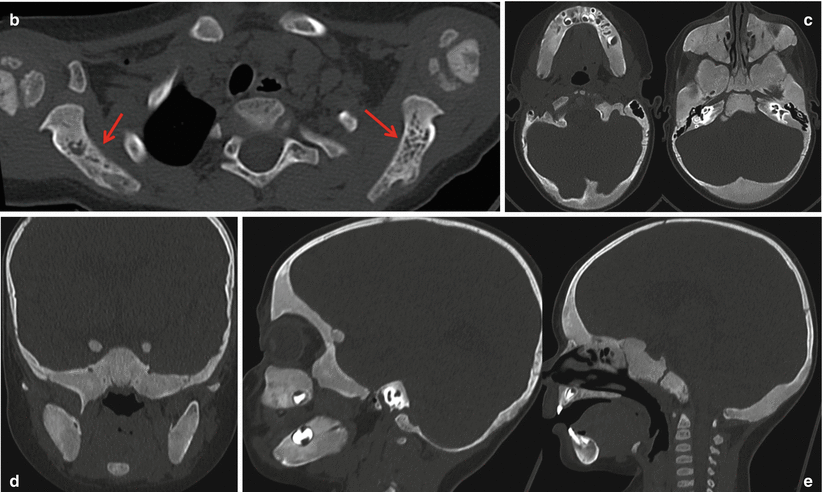
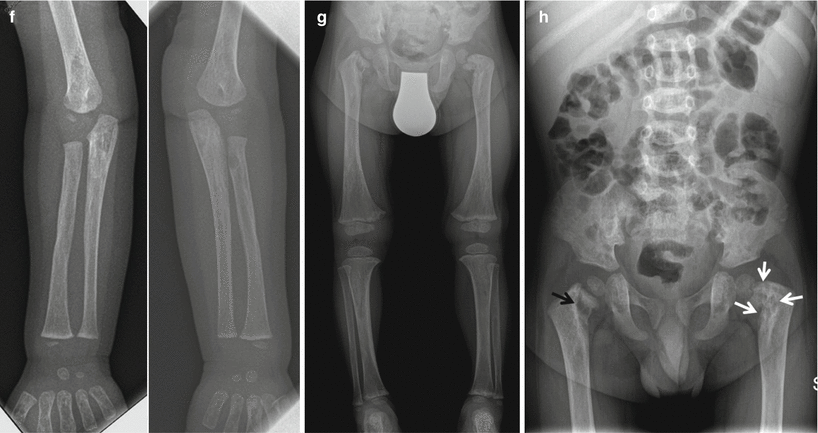
Fig. 26.2
(a) Bone scan shows multiple areas of intense uptake in the skull, facial bones, left humerus, proximal radii, pelvis, femurs, tibiae. (b–e): CT (b) shows a widening of both shoulder blades with diffuse moth eating of cancellous bone (red arrows). Axial cranial CT (c) widening of the bones of the skull base, of the mandible, and maxilla with a “ground glass” density. Cranial CT (d) in coronal and sagittal (e) plane: thickening of the frontal bones, of the lower part of the occiput, of the bones of the skull base, of the mandible, and maxilla with ground glass density. Normal appearance of the bones of the vault. (f–h) X-rays of the upper limbs (f): osteoporosis, flaring of the bone marrow channel and thinning of corticals. X-ray of the lower limbs (g): osteoporosis, flaring of the bone marrow channel and thinning of corticals. Plain film of the pelvis (h) shows left coxa vara with multiple radiolucent areas (white arrows). In the internal part of the right femoral neck, radiolucent areas are seen with associated vertical rhyme of pathological fracture of the femoral neck without displacement (black arrow)
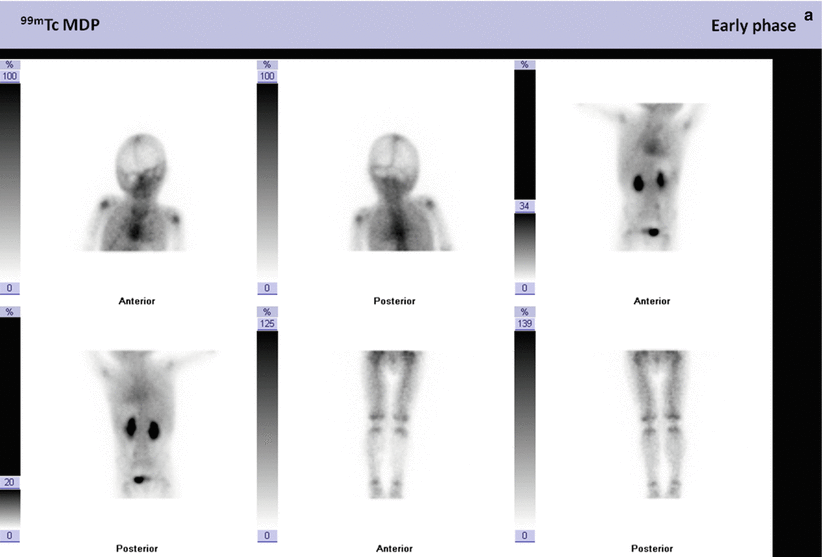
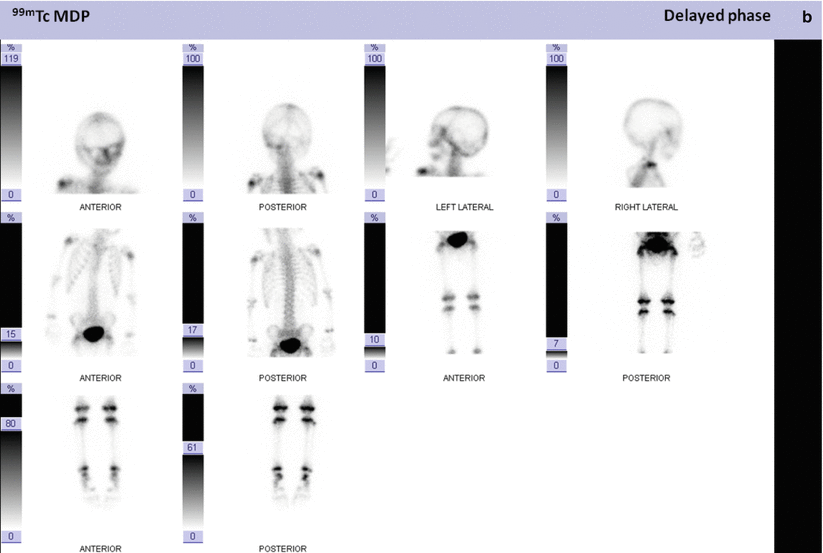
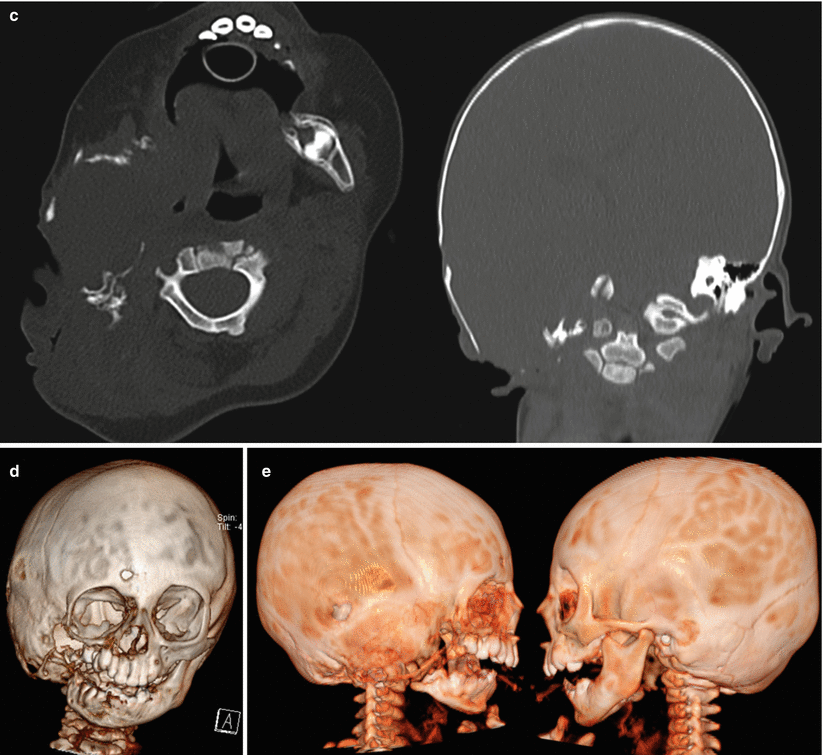
Fig. 26.3
(a–b) Three-phase bone scan shows normal blood-pool images (a) and diffuse reduced radiotracer uptake into the right skull and of the right skull base (b). (c–e) Axial and coronal CT (c) show right extensive osteolysis of the temporal bone, of the zygomatic arch, of the ramus, and condyloid process of the mandible; three-dimensional CT (d) in frontal view confirms the above findings with marked facial asymmetry; (e) The three-dimensional CT in the right side view shows the above alterations in comparison with the normal appearance of the left side
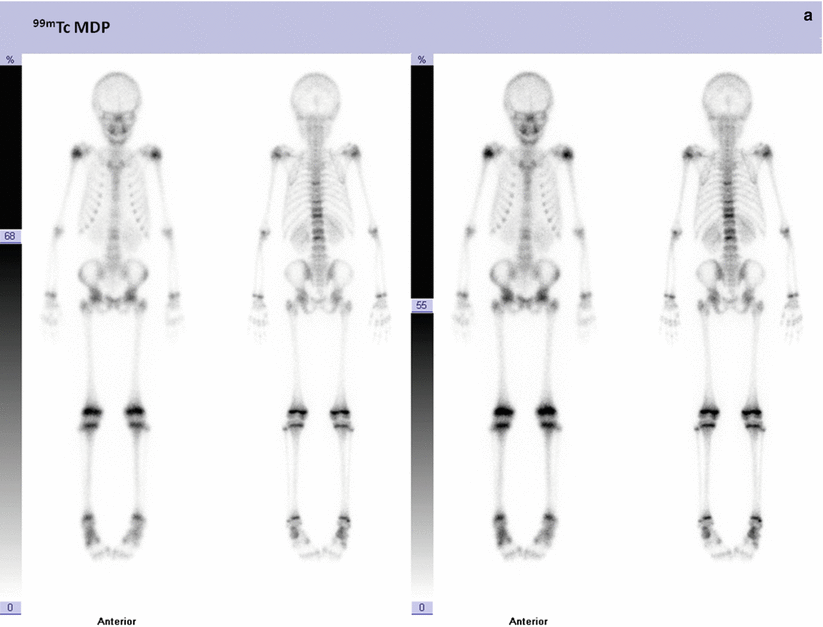
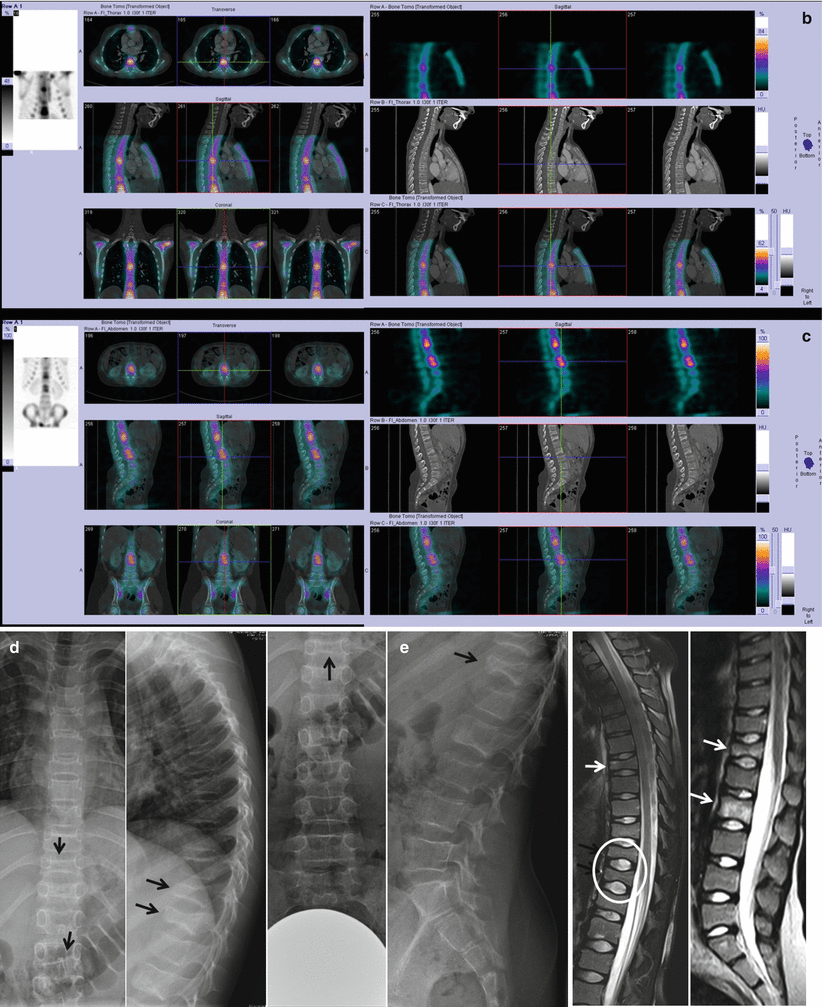
Fig. 26.4
(a–c) Bone scan (WBS and SPECT fused images) shows multiple areas of linear intense uptake in the dorsal (T6–T9–T10–T11) and in the lumbar spine (L1–L2–L3). (d–e) Frontal and lateral plain film (d) of the thoracic and lumbar spine shows rarefaction of cancellous bone design with “spider web” appearance and multiple vertebral collapses (black arrows). Sagittal T2-weighted MRI of the spine (e) confirms multiple somatic collapses (black arrows), some with increased signal due to edema of the bone marrow (white arrows). The intervertebral disks have a regular signal, and they are slightly expanded near somatic major collapses seats (white oval). The posterior somatic walls are intact, and spinal cord is normal
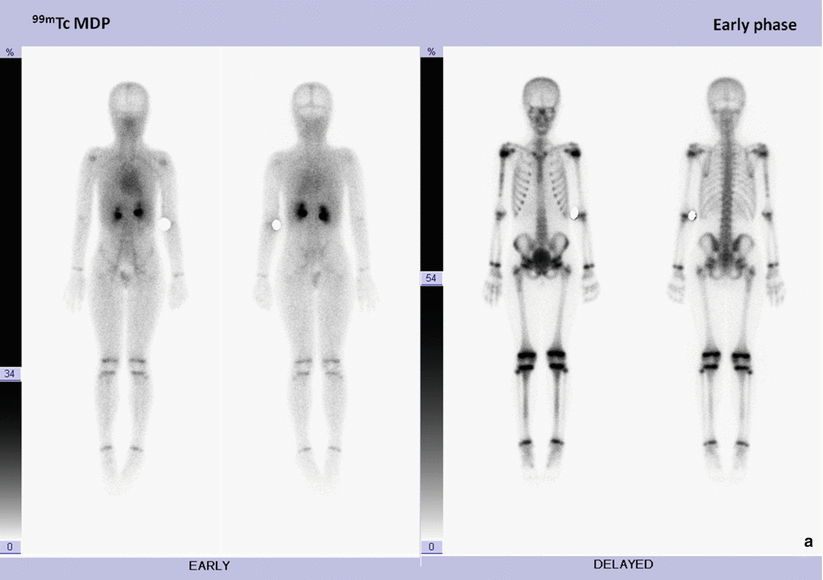
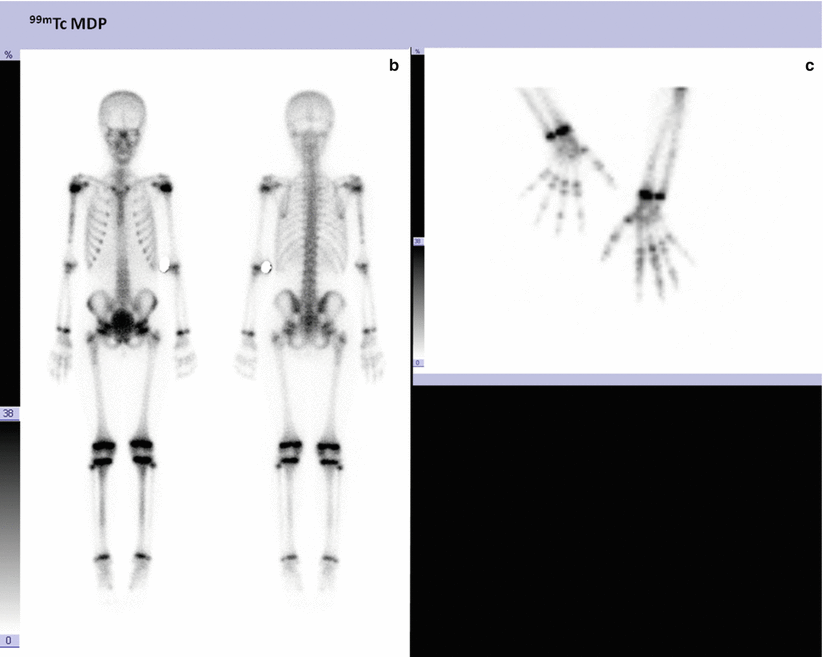
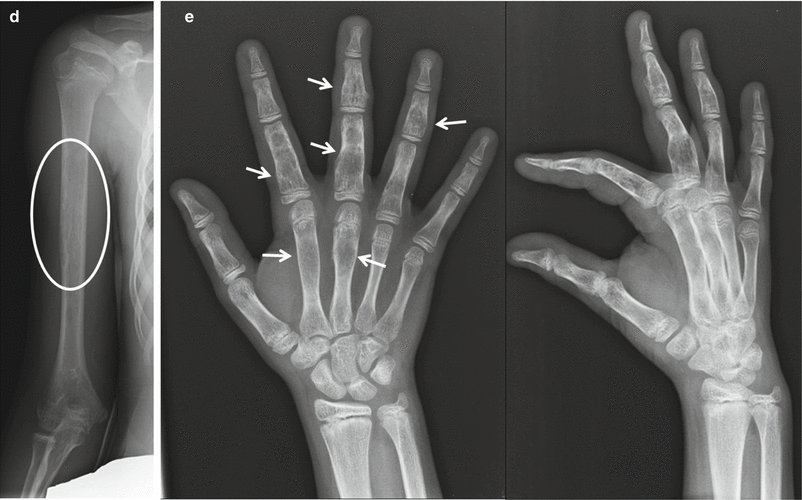
Fig. 26.5
(a–c) Three-phase bone scan shows normal blood-pool images (a) and mild uptake into the right humerus, proximal right femur, distal radius, and distal ulnae bilaterally, into metacarpal bones bilaterally, several foci of uptake in the phalanges of both hands (b–c) corresponding to the radiological findings. (d–e) Plain radiography: the humeral shaft is slightly flared with thinned cortical and small radiolucent areas (d, white oval). Flaring, increased radiolucency with cortical bulging, and thinning at the level of the metacarpals and proximal phalanges of the second and third fingers and middle phalanges of the third and fourth fingers (e, white arrows)
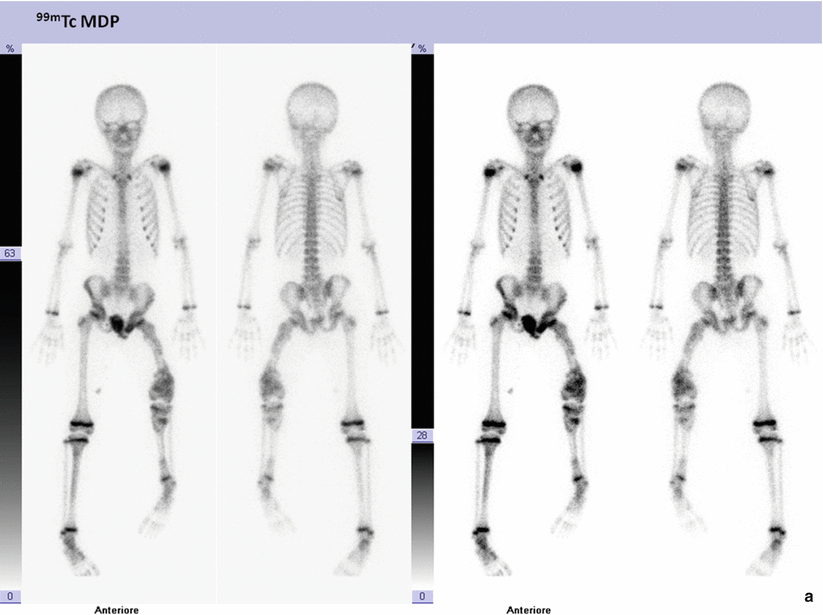
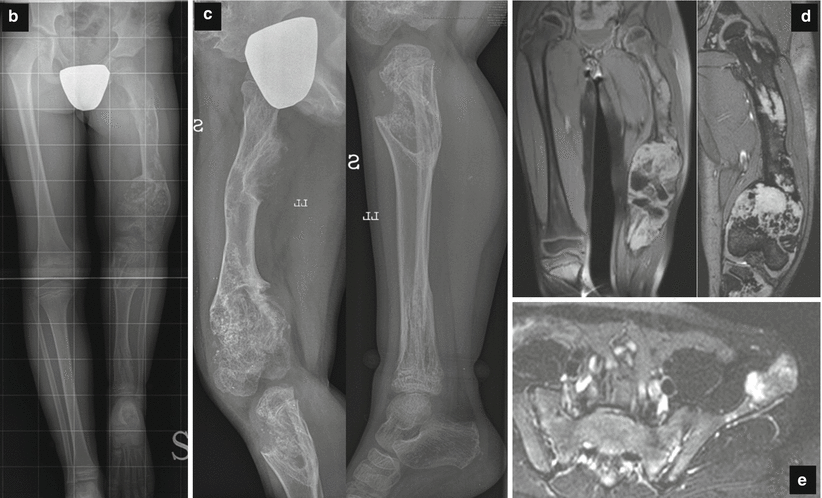
Fig. 26.6


(a) Bone scan shows short left lower limb, which appears deformed and with multiple areolas of increased uptake inside, in a context of widespread maldistribution, extensively in the femur and tibia. Mild and widespread increase in the left iliac bone, with maldistribution and poor definition of the iliac crest, is also noted. (b–e) AP telemetry with grid of the lower limbs (b): shortening of the left lower limb. Radiographs of the femur and tibia (c): marked femoral diaphyseal and metaphyseal flaring with large areas of osteolysis and multiple small calcifications. Coronal MRI T2 * (d): metaphyseal flaring with hypersignal in the context of which are present multiple hypointense nodules due to calcifications in chondroid tissue. MRI axial T2 fat/sat of pelvis (e): flaring and hypersignal of left ileum due to chondroid tissue with microcalcifications in the context
Stay updated, free articles. Join our Telegram channel

Full access? Get Clinical Tree


