Chapter Outline
Imaging Evaluation of Focal Liver Lesions
Nodular Regenerative Hyperplasia
Bile Duct Hamartomas (von Meyenberg Complexes)
Congenital Hepatic Fibrosis and Polycystic Liver Disease
Infantile Hemangioendothelioma
Each of the cellular components of the liver can give rise to both benign and malignant tumors. Epithelium can degenerate into cystadenomas and cholangiocarcinoma, and mesenchymal tissue may produce hemangiomas or angiosarcomas. In this chapter, the benign primary hepatic neoplasms are discussed ( Box 86-1 ).
Hepatocellular Origin
Hepatocellular adenoma
Hepatocellular hyperplasia
Focal nodular hyperplasia
Nodular regenerative hyperplasia
Macroregenerative nodule (adenomatous hyperplasia)
Cholangiocellular Origin
Hepatic cysts
Simple hepatic cysts
Congenital hepatic fibrosis or polycystic liver disease
Biliary cystadenoma
Bile duct adenoma
Mesenchymal Origin
Mesenchymal hamartoma
Hemangioma
Infantile hemangioendothelioma
Lymphangioma
Lipoma, angiomyolipoma, myelolipoma
Leiomyoma
Fibroma
Heterotopic tissue
Adrenal rests
Pancreatic rests
Primary hepatic carcinoma
Imaging Evaluation of Focal Liver Lesions
The liver is a large and homogeneous organ and therefore is well suited for evaluation by many imaging techniques. The study of liver neoplasms is particularly challenging. In many cases, a preoperative diagnosis may be achieved with the appropriate combination of imaging techniques in a purely noninvasive fashion. This is important because many adults have benign, nonsurgical hepatic lesions, such as hemangioma or simple cyst. For many tumors, each imaging technique provides a piece of information that, like a puzzle, must be combined with findings from other imaging techniques as well as clinical information for a diagnosis to be achieved.
The study of focal liver lesions by imaging can be likened to a game in which different “players” (imaging techniques) must be used appropriately to achieve the diagnosis. In evaluation of focal liver diseases, the following imaging techniques are available:
Plain abdominal radiography;
Nuclear medicine: positron emission tomography (PET), red blood cells (RBCs) tagged with technetium Tc 99m;
Ultrasonography: gray-scale and color Doppler sonography, contrast-enhanced examinations;
Multidetector computed tomography (MDCT): nonenhanced scans and contrast-enhanced dynamic scans including arterial, portal venous, and delayed phases;
Angiography; and
Magnetic resonance imaging (MRI): nonenhanced, vascular enhanced with gadolinium, reticuloendothelial enhanced with small and ultrasmall superparamagnetic iron oxide particles (SPIOs and USPIOs), hepatocyte enhanced with gadolinium benzyloxypropionictetraacetate (Gd-BOPTA), and gadolinium ethoxybenzyl diethylenetriaminepentaacetic acid (gadoxetate; Gd-EOB-DTPA).
The “plays” that the foregoing players can offer are listed in Box 86-2 .
To Assess Vascularity
Contrast-enhanced CT
Gadolinium-enhanced MR
Contrast-enhanced ultrasound
Angiography
Blood pool studies ( 99m Tc-labeled red blood cells)
To Assess Hepatocyte Function or Biliary Excretion
MR imaging enhanced with hepatocyte-specific contrast agents
To Assess Metabolic Activity of Neoplasms
18 F-FDG PET imaging
To Assess Kupffer Cell Activity
MR imaging enhanced with intravenous superparamagnetic iron oxide
To Assess Tumoral Calcification
CT
Ultrasound
Plain radiographs
To Assess Capsule Presence
CT (enhanced/nonenhanced)
Ultrasound (enhanced/nonenhanced)
MR (enhanced/nonenhanced)
To Assess Internal Nature of Neoplasms (e.g., Solid Versus Cystic, Hemorrhage, Fibrosis)
CT
MR
Ultrasound
With the widespread use of new cross-sectional imaging techniques such as MDCT and the development of reticuloendothelial and hepatocyte-specific MRI contrast agents, the role of older techniques such as angiography and nuclear medicine has become more limited. The majority of liver lesions can now be detected and characterized noninvasively, and angiography is required only in exceptional circumstances. Although conventional scintigraphic techniques are only exceptionally used for the evaluation of focal liver lesions, PET and PET/CT are effective techniques, especially for detection of hepatic metastatic disease. Today, most focal liver lesions are diagnosed by ultrasound, CT, and MRI.
As mentioned before, two main groups of liver-specific contrast agents are used in MRI. Superparamagnetic iron oxide particles (SPIOs) are the first group. These particles are taken up by the reticuloendothelial system or Kupffer cells of the liver by phagocytosis. By causing magnetic field inhomogeneities with shortening of T2 relaxation time, these substances decrease the signal intensity of the normal liver parenchyma on T2-weighted images, which is best seen on T2* or gradient recalled echo sequences for lesion detection. However, to evaluate signal intensity loss for lesion characterization, T2-weighted turbo spin-echo sequences or HASTE (half-Fourier acquisition single-shot turbo spin-echo) sequences are more sensitive. Benign hepatocellular lesions show uptake of these contrast agents, depending on the content of the Kupffer cells. Being an exception for this although lacking Kupffer cells, hemangiomas show a decrease in signal on T2-weighted images because of their relatively large, slow-flowing blood pool that allows the effect of the SPIO particles to occur.
Lesions lacking Kupffer cells, such as malignant lesions or metastases, do not take up SPIO contrast agents, so they appear bright in the dark liver parenchyma on T2-weighted post-SPIO sequences. This increased contrast between the liver and a lesion of nonhepatic origin allows an easy distinction from benign hepatic lesions.
The second group consists of gadolinium-based contrast material, gadobenate dimeglumine (MultiHance; Bracco Diagnostics, Princeton, NJ) and gadoxetate (Primovist; Bayer Schering Pharma, Berlin, Germany). Gadobenate dimeglumine (Gd-BOPTA) and gadoxetate disodium (Gd-EOB-DTPA) are hepatobiliary contrast agents that allow evaluation of the vascularity of the lesion and hepatocellular function within the lesion. These contrast agents are taken up by hepatocytes and excreted in the biliary tract. The administered doses of Gd-BOPTA and Gd-EOB-DTPA are excreted in the bile at a rate of approximately 5% and 50%, respectively ( Fig. 86-1 ). Both act as nonspecific extracellular contrast agents on the early postcontrast phase, whereas they act as hepatocyte-specific agents on the delayed contrast-enhanced phases (40 to 120 minutes for Gd-BOPTA and 10 to 20 minutes for Gd-EOB-DTPA). These contrast agents will be taken up by normal hepatocytes on delayed postcontrast phases.

They increase the signal intensity of the normal liver parenchyma on T1-weighted images. Because malignant lesions do not take up hepatocyte-specific contrast agents during the hepatobiliary phase, they appear hypointense and become more conspicuous.
Hemangioma
Pathologic Findings
A hemangioma is defined microscopically as a tumor composed of multiple vascular channels lined by a single layer of endothelial cells supported by a thin, fibrous stroma ( Fig. 86-2 ). The channels are separated by thin fibrous septa, which may form finger-like protrusions into the channels. In gross appearance, it is frequently solitary, well circumscribed, and blood filled and ranges in size from a few millimeters to more than 20 cm. Hemangiomas may be multiple in up to 50% of cases.

Hemangiomas larger than 10 cm are defined as giant hemangiomas. On cut sections, hemangiomas are almost always heterogeneous with areas of fibrosis, necrosis, and cystic change. The radiologic-pathologic correlates of hemangioma are listed in Table 86-1 .
| Pathologic Features | Radiologic Features |
|---|---|
| Vascular channels | Echogenic mass: ultrasound |
| Blood-filled cavity | Hyperintense mass: T2-weighted image (MR) |
| No arteriovenous shunting | Early globular peripheral enhancement on contrast-enhanced helical CT, dynamic Gd-DTPA–enhanced T1-weighted MR and USPIO-enhanced T1-weighted MR Delayed-persistent filling on red blood cell scan, enhanced conventional CT, Gd-DTPA–enhanced MR, angiography |
| Fibrosis | Hypodense region: CT Hypointense region: MR Hypoechoic region: ultrasound |
| Calcification | Dense region: plain films, CT Absent signal: MR Hyperechoic shadowing region: ultrasound |
Incidence and Clinical Presentation
Hemangioma is the most common benign tumor of the liver, with a reported incidence ranging from 1% to 20%. The latter figure is the result of a prospective autopsy study in which a dedicated search for this lesion was performed.
Hemangiomas occur primarily in women (female-to-male ratio of 5 : 1). Although hemangiomas may be present at all ages, they are seen more commonly in postmenopausal women. The worldwide prevalence of this tumor is fairly uniform. In a study of Vilgrain and associates, it was reported that there was a significant association between focal nodular hyperplasia and hemangioma in the liver. Whereas each of these lesions is found commonly as an isolated hepatic mass, in 20% of patients in the study group of Vilgrain and associates, both lesions were present together.
Plain Radiographic Findings
Calcification is rare in this tumor; less than 10% of hemangiomas have calcification detectable by plain radiographs. Calcification can be either large and coarse (amorphous calcification within zones of fibrosis) or phlebolith-like thrombi within the vascular channels of hemangioma.
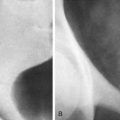
Nuclear Medicine
Radionuclide scintigraphy for identification of hemangiomas is not performed routinely in all centers, especially outside the United States. With tagged RBC pool scans, there is a defect in the early phases that shows prolonged and persistent “filling in” on delayed scans ( Fig. 86-3 ). Many vascular tumors, such as hepatocellular carcinoma, adenoma, and focal nodular hyperplasia, may have persistent uptake, but all exhibit early uptake rather than a defect. Rarely, angiosarcomas can demonstrate the hemangioma pattern of early defect and late isotope uptake. In this context, new hybrid single photon emission computed tomography (SPECT)/CT systems may further aid diagnosis of hemangiomas by means of a more accurate anatomic localization of the lesions. In a study, SPECT/CT increased the accuracy of RBC scintigraphy in classifying the hepatic lesions as hemangiomas and nonhemangiomas from 70.8% to 87.5%.

Ultrasound
On sonography, hemangiomas are typically hyperechoic and well demarcated and exhibit faint acoustic enhancement ( Fig. 86-4 ). The echogenicity may vary because these tumors may contain cystic and fibrotic regions. Color Doppler ultrasound demonstrates filling vessels in the periphery of the tumor but no significant color Doppler flow deep within the hemangioma itself. Power Doppler, however, may detect minimal flow within hemangiomas, but the pattern is nonspecific and may be seen in hepatocellular carcinomas and metastases.

Hemangiomas, like other focal lesions of the liver, are detected and characterized with ultrasound not only by an analysis of echogenicity and vascularity but also by the changes occurring in inflow kinetics of ultrasound contrast agents. In general, ultrasound contrast agents consist of microbubbles of air or perfluorocarbon gas stabilized by a protein, lipid, or polymer shell. The small size (approximately the same as RBCs) and stability of the bubbles allow them to traverse the pulmonary and cardiac circulations after intravenous injection. The bubbles cannot move through the vascular endothelium into the interstitium and remain within the vessel until they disappear by the diffusion of the gas through their thin shell. Therefore, they are true blood pool agents and have a typical half-life of a few minutes in the circulation. Bubbles respond to sound emitted by the imaging transducer by oscillating and returning detectable echoes to the transducer.
On contrast-enhanced ultrasonography, hemangiomas demonstrate a typical specific peripheral nodular contrast enhancement and centripetal fill in. Whereas the “filling in” of the lesion can take several minutes with CT and iodinated contrast material, the kinetics of ultrasound contrast agents is different, and with them, the process can last even less than a minute. Therefore, imaging in the first 60 seconds is critical in characterizing hemangiomas at ultrasound.
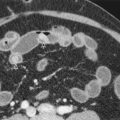
Computed Tomography
Hemangiomas appear as low-density masses with well-defined, lobulated borders on nonenhanced CT scans. Calcification is observed in 10% to 20% of cases. After intravenous administration of contrast material, both arterial phase and portal venous phase CT scans show early, peripheral, globular enhancement of the lesion. The attenuation of the peripheral nodules is equal to that of aorta. In a study of Leslie and colleagues, the presence of globular enhancement isodense with the aorta was found to be 67% sensitive and 100% specific in differentiating hemangiomas from hepatic metastases. Therefore, if this pattern is visualized, no further evaluation is required. If venous phase CT is obtained, centripetal enhancement that progresses to uniform filling persists on delayed phase images ( Fig. 86-5 ). Although small lesions often fill in completely, large tumors may not show central nonenhancing zones during venous and delayed phases, corresponding to scar tissue or cystic cavities. On the other hand, approximately 16% of all hemangiomas and 42% of small ones (<1 cm in diameter) show immediate homogeneous enhancement at arterial phase CT imaging. This feature is relatively challenging for the differential diagnosis because other hypervascular tumors, including hepatocellular carcinoma, also may enhance rapidly during this phase of imaging. In such cases, accurate diagnosis can be made with delayed phase CT imaging because hemangiomas remain hyperattenuating, whereas hypervascular metastases do not. Another important and helpful imaging finding in diagnosis of this type of hemangiomas is that their attenuation is equal to that of the aorta during all phases of dynamic CT imaging. Hemangiomas may also be a cause of transient hepatic attenuation differences (THADs).

Angiography
Although angiography is not routinely used in the diagnostic evaluation of hepatic hemangiomas, knowledge of the characteristic appearances is important because hemangiomas may coexist with metastases. In this scenario, correct identification of the lesions is vital because therapeutic options such as hepatic resection depend on the number and distribution of metastases. On angiography, there is pooling of contrast medium within the hemangioma, producing a characteristic “cotton wool” appearance, without evidence of arteriovenous shunting or tumor neovascularity. Hemangiomas typically retain contrast medium well beyond the venous phase.
Magnetic Resonance Imaging
The study of hemangiomas of the liver is one of the major applications of abdominal MRI ( Figs. 86-6 to 86-8 ). Hemangiomas generally have moderately low signal intensity on T1-weighted images and characteristically demonstrate marked hyperintensity on T2-weighted images, which may contain low-intensity areas correlating with zones of fibrosis. They maintain high signal intensity on longer echo time (>120 milliseconds) T2-weighted sequences. Nevertheless, the signal characteristics of other masses and neoplasms may overlap with those of hemangioma owing to their similar T2 values, and because of this overlap, characteristics at contrast-enhanced MRI are used for further evaluation. Suspected hemangiomas should be evaluated by a dynamic breath-hold sequence, in a manner similar to contrast-enhanced dynamic CT protocol. After intravenous administration of a contrast agent, a fast gradient-echo T1-weighted sequence (20-30 seconds) is repeatedly acquired once per minute until the lesion has filled in completely or nearly completely. In fact, three patterns of enhancement may be seen, depending on the size of the lesion. The majority of small (<1.5 cm) lesions show uniform early enhancement or peripheral nodular enhancement progressing centripetally to uniform enhancement. This second pattern is commonly seen in medium-sized lesions (1.5-5 cm) and in a few large (>5 cm) lesions. Most large hemangiomas exhibit peripheral nodular enhancement while the center of the lesion remains hypointense. Peripheral nodular enhancement is a useful discriminating feature in the differential diagnosis between hemangiomas and metastases. However, small lesions can be a diagnostic problem because a uniform pattern of enhancement is seen in both hemangiomas and vascular metastases. Flash-filling hemangiomas may also cause a serious problem regarding their differentiation from hypervascular metastases (e.g., those of malignant neuroendocrine tumors) because of a similar appearance in unenhanced and contrast-enhanced imaging. In the majority of cases, the combination of T2-weighted images and serial dynamic postgadolinium images allows a confident diagnosis of hemangioma to be made. The role of USPIOs has also been evaluated in the characterization of hemangiomas. This agent is ultimately cleared by the reticuloendothelial system but resides in the intravascular compartment (“blood pool”) immediately after injection. On T1-weighted images, hemangiomas enhance immediately because of their vascularity and become isointense with normal liver. On T2-weighted scans, hemangiomas demonstrate decreased signal intensity and may become isointense to the liver at higher doses of USPIOs. Hemangiomas do not demonstrate uptake of SPIOs because they do not contain Kupffer cells or normal hepatocytes.


Hemangiomas appear isointense or hypointense in the late dynamic phase and hepatocyte phase with use of Gd-EOB-DTPA. The reasons for this are marked hepatocyte uptake of Gd-EOB-DTPA in the surrounding liver, substantially low overall administered dose of Gd-EOB-DTPA, and substantially short plasma half-life of Gd-EOB-DTPA ( Fig. 86-9 ).

On diffusion-weighted imaging, hemangiomas show low signal intensity with increased b values and have high apparent diffusion coefficient (ADC) values like simple cysts ( Fig. 86-10 ). However, differentiation between cystic metastases and hemangioma or small flash-filling hemangiomas and hypervascular metastases cannot be achieved solely with this single-pulse sequence, and it should be interpreted in conjunction with contrast-enhanced images.

Diagnostic Work-Up
Differentiation of hepatic hemangiomas from other benign and malignant focal liver lesions is one of the most common problems in abdominal imaging. Most authorities believe that if a focal liver lesion has the classic appearance of a hemangioma on ultrasound, CT, or MRI examinations, it should be left alone. We believe that in patients with known malignant disease or abnormal liver function test results, one of the tests with high accuracy should be performed, such as multiphasic MDCT or gadolinium-enhanced dynamic MRI, for confirmation. In atypical cases, biopsy should be considered.
Focal Nodular Hyperplasia
Pathologic Findings
Focal nodular hyperplasia (FNH) is defined microscopically as a tumor-like condition characterized by a central fibrous scar with surrounding nodules of hyperplastic hepatocytes and small bile ductules. The nodules seen in FNH lack normal central veins and portal tracts. The bile ductules seen in the central scar do not connect to the biliary tree. Vessels course through the tumor and are most abundant in the fibrous scar ( Fig. 86-11A ).

In gross appearance, FNH is a well-circumscribed, solitary mass (95%) that is often located on the surface of the liver or pedunculated. On cut section, the majority of these tumors have an obvious central fibrous scar, and although the margin is sharp, there is no capsule ( Fig. 86-11B ). Hemorrhage and necrosis are rare because this tumor has excellent vascularity. The majority of FNHs are smaller than 5 cm and have a mean diameter of 3 cm at the time of diagnosis. On occasion, FNH replaces an entire lobe of the liver (lobar FNH). The consistency is firm to rubbery, and the color is always paler than that of the surrounding liver. When an FNH is sectioned, it bulges from the cut surface with the stellate scar depressed and forming stellate fibrous septa that course through the tumor. Multiple FNHs have been reported in association with vascular malformations of various organs and neoplasia of the brain. FNH is believed to be a hyperplastic response to an underlying “spider-like” arterial malformation. It has to be emphasized that on microscopic examination, particularly by needle biopsy, the appearance of FNH resembles that of a cirrhotic process; however, acinar landmarks are not present.
Radiologic-pathologic correlates of this tumor are listed in Table 86-2 .
| Hyperplasia of normal liver | |
| Uptake of SPIO results in loss of signal | |
| Pathologic Features | Radiologic Features |
| Central scar with vessels and bile ducts | Hyperintense region: T2-weighted images (MR) Spoke-wheel pattern: angiography Calcification rare |
| Hyperplasia of normal liver (Kupffer cells, portal spaces, bile ductules) | Sulfur colloid uptake (80%) Iminodiacetic acid uptake and excretion Homogeneous mass: CT, ultrasound, MR, angiography Hyperdense relative to live on arterial phase of contrast-enhanced helical CT, becoming isodense during portal venous phase of enhancement Uptake of SPIO results in loss of signal on T2-weighted MR Uptake of hepatobiliary contrast agents (e.g., mangafodipir, Gd-EOB-DTPA) results in hyperintensity relative to liver on T1-weighted images |
Incidence and Clinical Presentation
FNH is the second most common benign hepatic tumor, constituting 8% of primary hepatic tumors in autopsy series. FNH is more common in women, predominating in the third to fifth decades of life. Oral contraceptives have a trophic effect on FNH, but there is debate as to whether these agents actually cause this tumor.
Clinically, FNH is usually an incidental finding at autopsy, elective surgery, or cross-sectional imaging. Fewer than one third of cases are discovered because of clinical symptoms, usually right upper quadrant or epigastric pain.
Plain Radiographic Findings
Plain radiograph calcification is almost never present. On occasion, a pedunculated FNH lesion may project to the margin of the liver and compress the adjacent stomach or hepatic flexure.
Nuclear Medicine
In the past, sulfur colloid scintigraphy was the preferred imaging technique in the diagnosis of FNH because of normal tracer uptake in approximately 50%, and a defect is seen in 40% of FNH cases. “Hot spots,” present in 10% of lesions, indicate an increased number of Kupffer cells. Hepatobiliary scans show tracer uptake in the majority of cases, and isotope excretion can be observed in 50% of delayed scans. Tagged RBC pool studies show early isotope uptake and late defect. There is no gallium uptake in FNH.
There are only a few studies about PET imaging of FNH. In one study, it was reported that in contrast to liver metastases, there is no increased glucose metabolism in FNH in vivo. Also, the imaging features of FNH on 18 F-fluorodeoxyglucose (FDG) PET imaging are not specific.
Today, CT and MRI are used in the diagnostic work-up of FNH. Nuclear medicine studies are reserved for exceptional circumstances.
Ultrasound
On gray-scale ultrasound studies, FNH typically appears as a well-demarcated, hypoechoic mass that is homogeneous in tissue texture except for a central scar ( Fig. 86-12 ). Rarely (1.4%), calcifications may be seen within FNH, and the lesion may resemble fibrolamellar hepatocellular carcinoma. On color Doppler sonography ( Fig. 86-13 ), FNH shows increased blood flow, and a pattern of blood vessels radiating peripherally from a central feeding artery may be seen, similar to the findings at conventional angiography. In a contrast-enhanced examination, like hepatocellular carcinoma, FNH in the early arterial phase appears typically as a hyperperfused structure relative to the adjacent liver tissue. However, the specific morphologic features of these two entities are different. FNH typically enhances uniformly without the necrosis and heterogeneity often seen in hepatocellular carcinoma. The stellate lesion vascularity, a central nonenhancing scar, and a tortuous feeding artery are the other typical features of FNH. Nevertheless, portal venous phase imaging is critical for an accurate diagnosis to be reached. During this phase, as opposed to hepatocellular carcinoma, in which washout is generally seen, FNH remains isoechogenic with the portal vein and later with the liver parenchyma.


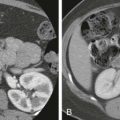
Computed Tomography
On nonenhanced scans, FNH usually appears as a homogeneous, hypodense mass ( Fig. 86-14 ). In a third of cases, a low-density central area is seen, corresponding to the scar. During the arterial phase of contrast-enhanced CT, FNH enhances rapidly and becomes hyperdense relative to normal liver ( Fig. 86-15 ). The low-attenuation scar appears conspicuous against the hyperdense tissue, and foci of enhancement representing arteries may be seen within the scar (see Fig. 86-14B ). In the portal venous phase and later phases of enhancement, the difference in attenuation between FNH and normal liver decreases and the FNH may become isodense with normal liver. Ten-minute delayed images can show increased uptake of contrast material in the scar relative to surrounding liver.


Angiography
On angiography, FNH is a hypervascular tumor with a centrifugal blood supply creating a “spoke-wheel” pattern in 70% of cases. The scar is usually hypovascular. During the capillary phase, an intense and inhomogeneous stain without avascular zones is characteristic. During the venous phase, large veins draining the hypervascular FNH are noted. Angiography is no longer primarily used to diagnose FNH.
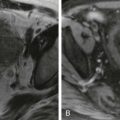
Magnetic Resonance Imaging
MRI has higher sensitivity (70%) and specificity (98%) for FNH than CT and ultrasound. On nonenhanced MRI studies, FNH is an isointense tumor on T1-weighted images that becomes slightly hyperintense to isointense on T2-weighted images ( Figs. 86-16 and 86-17 ). The central scar is hypointense on T1-weighted images and hyperintense on T2-weighted images. However, there is overlap in the appearance of FNH and malignant lesions on nonenhanced T1-weighted and T2-weighted images, and further characterization with contrast-enhanced dynamic studies may be necessary.


FNH, which is a hypervascular tumor, enhances robustly and homogeneously in the arterial phase, with the exception of late-enhancing central scar (see Figs. 86-16 and 86-17 ). Hepatocellular adenomas show less intense enhancement and lack a central scar.
Although other focal liver lesions, such as giant hemangiomas and hepatocellular carcinomas, may also have a central scar, MRI findings can help establish a specific diagnosis. The central scar in giant hemangiomas is typically larger and brighter on T2-weighted images. Because of the presence of scar tissue, calcifications, or necrosis, the central scar in hepatocellular carcinoma tends to show low signal intensity on T2- and T1-weighted images and typically does not enhance that much on contrast-enhanced images. Nevertheless, in some cases, FNH may show atypical features, such as very high signal intensity on T2-weighted images and a central scar with a low signal intensity that causes difficulty in differential diagnosis. In such cases, application of more sophisticated contrast media, such as SPIOs, or hepatobiliary agents, such as Gd-EOB-DTPA, may be necessary to demonstrate the hepatocellular origin of the lesion. On T2-weighted images with SPIO administration, FNH shows loss of signal due to uptake of iron oxide particles by Kupffer cells within the lesion. The degree of signal loss seen in FNH with use of SPIOs is significantly greater than in other focal liver lesions, such as metastases and hepatocellular adenoma.
Hepatobiliary agents can also be helpful in characterization of FNH. FNH contains hepatocytes, which take up these agents, resulting in hyperintensity of the lesion relative to the liver on T1-weighted images. On hepatocyte phase images, FNH usually appears isointense or hyperintense relative to the surrounding liver parenchyma and shows the classic popcorn-like enhancement pattern as a result of the accumulation of Gd-EOB-DTPA and poor biliary drainage. Similar to hemangiomas, the central scar appears hyperintense on delayed phase imaging with extracellular agents and hypointense on hepatocyte phase images with Gd-EOB-DTPA.
Hepatobiliary-specific contrast agents can be useful for differentiation of FNH from adenomas. FNH shows hyperintensity or isointensity except for a central scar in the hepatobiliary-specific phase (typically 20-minute delay for Gd-EOB-DTPA), whereas adenoma usually shows hypointensity ( Fig. 86-18 ).