(5.1)
whereD represents the ion absorbed dose, expressed in gray (Gy). D RBE is the RBE-weighted carbon ion absorbed dose and is the dose of photons that would produce the same therapeutic effect as an ion absorbed dose, D, given under identical circumstances; it is also expressed in gray (Gy). To avoid this confusion the quantity D RBE is expressed in units of Gy, followed by a space and the parenthetical descriptor “(RBE).” The RBE-weighted absorbed dose specification would read “D RBE = 70 Gy (RBE).” This notation will be used throughout the remainder of this textbook. RBE of therapeutic carbon-ion beams can be affected by many factors complexly such as dose level, linear energy transfer (LET), biological endpoint, fractionation, oxygen status, and so on. The role of the biophysical model is to take into account the changeable biological effect appropriately in treatment planning. However, full simulation of the underlying biological processes is not yet feasible the physical properties of the different radiation types can be described in great detail and thus form the basis of different theoretical approaches/models to predict the increased effectiveness of particle beams in experimental and therapeutic situations.
5.2 Biophysical Model in Carbon-Ion Radiotherapy
When starting C-ion RT at HIMAC in 1994, little was known on the clinical effectiveness of ion beams. In order to design the dose distribution under the situation, an experimentally oriented pragmatic approach has been developed [2], referring to the clinical experience with neutron beams and combined with a dose-escalation strategy. Therefore, the estimation of the clinically relevant RBE values is implemented as a two-step procedure in this case, where a “biological RBE” is distinguished from the “clinical RBE.”
The first step includes the shaping of the spread-out Bragg peak (SOBP) and thus the ridge filter design. It is based on similar procedures developed for the pioneering study at LBL, but slightly differs with respect to the endpoints chosen as representative for the typical treatments performed at HIMAC, i.e., a human salivary gland (HSG) tumor cell line was selected as in vitro model system because the initial patients to receive carbon-ion radiotherapy were forecasted to have salivary gland tumors, which were known to respond well to fast neutron therapy.
5.2.1 Shaping of the SOBP
Treatment fields for application in tumor therapy are typically characterized by a superposition of Bragg peaks with different energies and even different ion species. The field is characterized by a distribution of LET values. Therefore, it is of particular interest to determine the RBE as a function of depth in such a typical mixed field treatment configuration. In general, dose-averaged LET value, determined by weighting the individual components of the field by their contribution to the total dose, is regarded as an adequate index for the biological effectiveness of mixed fields. Due to fragmentation of the primary carbon ions, a small dose contribution originating from the lighter particles is observed in the beam and more prominent beyond the distal falloff of the dose distribution. Though the RBE values might differ even in the case of similar dose-averaged LET values if different ion species are contaminated, the influence was regarded limited and therefore negligible in this model.
For the HSG cells, cell survival measurements were performed for different monoenergetic beams and mixed beams [3] covering a broad LET range, from which the linear-quadratic coefficients α(x) and β(x) as a function of the depth x in a monoenergetic, pristine Bragg peak can be derived according to the LET at the depth x as shown as Eq. (5.2). Based on these values, dose-effect curves for mixed fields composed of k Bragg peaks were calculated from the linear-quadratic coefficients α RM(x) and β RM(x) at the depth x in a range-modulated Bragg peak by using Eqs. (5.3) and (5.4):
![$$ S= \exp \left\{-[a{}_{RM}{}(x)d+b{}_{RM}{}(x)d{}{}^2]\right\} $$](/wp-content/uploads/2016/04/A311168_1_En_5_Chapter_Equ2.gif)


![$$ S= \exp \left\{-[a{}_{RM}{}(x)d+b{}_{RM}{}(x)d{}{}^2]\right\} $$](/wp-content/uploads/2016/04/A311168_1_En_5_Chapter_Equ2.gif)
(5.2)

(5.3)

(5.4)
Here, r j denotes the weight, i.e., the relative fluence contribution, of the jth pristine Bragg peak to the total SOBP, d(x) denotes the dose deposition in depth x of a pristine Bragg peak, and s j denotes the distance between the position x and the depth of the jth Bragg peak. Using α RM(x) and β RM(x), survival at depth x can be determined for the given total dose at that depth, and finally the corresponding biological RBE can be determined.
The 10 % surviving fraction level for HSG cells was chosen as the relevant endpoint for biological RBE determination of carbon ions. This allowed the design of a ridge filter required to achieve a homogenous cell killing of HSG cells throughout the extension of the SOBP. The design has been checked experimentally by irradiation of HSG cells with carbon ions at various positions of a 6-cm SOBP. Figure 5.1 shows the biological RBE-weighted dose distribution of 290 MeV/n carbon-ion beams with a 6-cm SOBP [3]. The biological RBE-weighted doses range from 1.6 to 2.1 Gy (RBE) within the SOBP, depending on cell lines and positions. HT1080 cells show slightly higher RBE-weighted doses than HSG cells at proximal positions while the reverse is true at distal positions. In general, however, the biological dose distributions are sufficiently flat. Because they were derived from in vitro cell survival data, the corresponding RBE values were designated “biological RBE.”
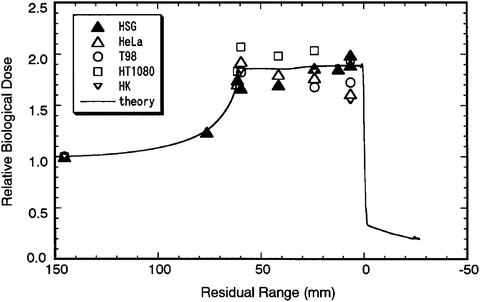

Fig. 5.1
Biological dose distribution of a therapeutic carbon beam. The Bragg peak of a monoenergetic carbon beam of 290 MeV/n was spread out to 6 cm. Image from published paper [3]
5.2.2 Determination of Neutron Equivalent Point
In a second step, the link to previous experience with neutron therapy was made. Biological RBE values of neutrons for cultured cells and in vivo systems are experimentally obtainable and can be compared with RBE values of carbon ions. A position in the SOBP was determined which exhibited the same biological RBE as the neutron radiation used for the clinical trials at NIRS. This position is designated the “neutron equivalent point” in the SOBP. Measurements of the biological RBE for 10 % cell survival of HSG cells revealed that after irradiation within a 6-cm SOBP the RBE increased with an increase of dose-averaged LET of carbon ions and was 2.05 at 85 keV/μm (see Fig. 5.2 [3]). This RBE was identical to the neutron RBE for the same endpoint. Similar measurements were performed for normal tissue effects in an in vivo system, where RBE for the induction of early skin reaction was determined at a scoring level of 2.5 (dry desquamation) as endpoint. Here, the RBE of 3.1—corresponding to the neutron RBE—was achieved at a dose-averaged LET of 75 keV/μm for carbon ions. Combining the results for in vitro and in vivo systems, it was thus decided to use the point with an LET of 80 keV/μm as the neutron equivalent point; this corresponds to a position approximately 8 mm upstream of the distal falloff in case of the 6-cm SOBP with 290 MeV/n beam.
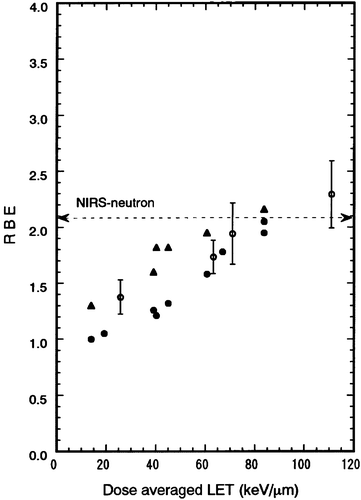

Fig. 5.2
LET dependency of the RBE for colony formation of HSG cells at the 10 % survival level. The data of the RBE were obtained by exposures of a HIMAC carbon beam of 290 MeV/n. The dashed line shows the RBE for the NIRS neutron beam for the HSG cells. Image from published paper [3]
Therefore, it was assumed that the RBE at this position of a carbon-ion SOBP should be the same as that of fast neutrons used for patient therapy. The NIRS experience of fast neutron therapy in the past was thus used to determine the corresponding “clinical RBE” of carbon-ion therapy at one point in the SOBP.
5.2.3 Estimation of Clinically Applicable RBE-Weighted Dose Profile
Tsunemoto [4] published clinical results of fast neutron therapy at NIRS. He summarized clinical results after various fractionation schedules for fast neutron therapy. Kutsutani-Nakamura [5] published a treatment planning method of fast neutron therapy and calculated RBE values of fast neutrons for tolerance of acute skin reaction. Based on the formula RBE(N) = 1.8 × N 0.2, he calculated clinical RBE values of neutron vs. number of fraction (N). Depending on the number of fractions the clinical RBE of neutrons increased such that it was 2.5, 2.9, and 3.3 as the number of fractions increased from 5, 10, and 20. Because it was intended to use an 18-fraction scheme over 6 weeks for C-ion RT, which is slightly different from the schemes used for neutron irradiation, a value of 3.0 was selected for the neutron RBE.
Stay updated, free articles. Join our Telegram channel

Full access? Get Clinical Tree


