3 Blood Vessels: The Aorta and its Branches, the Vena cava and its Tributaries
 Organ Boundaries
LEARNING GOALS
 Locate and identify the aorta and vena cava.
 Demonstrate the aorta and vena cava in their entirety.
The aorta and vena cava run parallel, anterior, and slightly lateral to the spinal column in the retroperitoneum. Just below the diaphragm, the vena cava initially is slightly more anterior than the aorta and is surrounded predominantly by the liver. The aorta is covered by the esophagogastric junction as it pierces the diaphragm and is more difficult to image than the vena cava (Fig. 3.1).
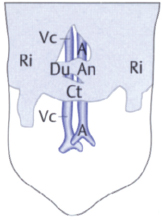
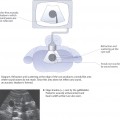
Fig. 3.1 Barriers to scanning the aorta (A) and vena cava (Vc).
The transverse colon (Ct) is a barrier to scanning, along with the antrum (An) and duodenum (Du). Ri = costal arch.
Locating the aorta and vena cava
Barriers to scanning
The two main barriers to scanning the aorta and vena cava are the stomach and transverse colon.
Optimizing the scanning conditions
Usually the two vessels can be quickly located by sliding the transducer across the upper abdomen.
Organ identification
Start with the transducer placed transversely in the midline of the upper abdomen below the xiphoid. From there you can almost always image the aorta and vena cava in transverse section by angling the transducer slightly up (cephalad) and down (caudad), as shown in Fig. 3.2.
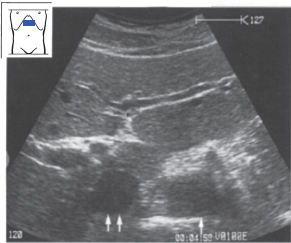
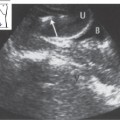
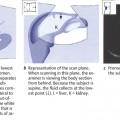
Fig. 3.2 Upper abdominal transverse scan of the aorta and vena cava.
Aorta (↑), vena cava (↑↑).
Demonstrating the aorta and vena cava in their entirety
Demonstrating the aorta and vena cava in transverse section
Define both vessels in an upper abdominal transverse section and scan slowly down the length of the vessels to the level of the bifurcation (Fig. 3.3). It is normal for your view to be obscured intermittently by bowel gas, mainly in the transverse colon.
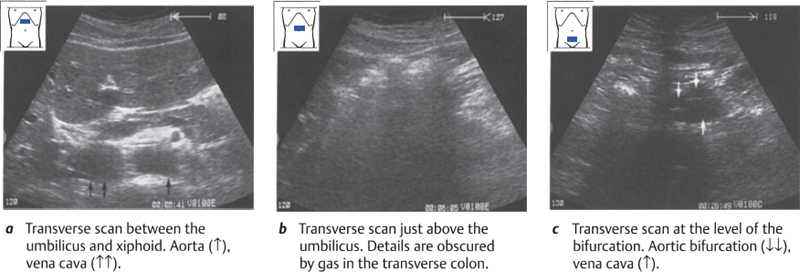
Fig. 3.3 Transverse scans of the aorta and vena cava
Demonstrating the aorta and vena cava in longitudinal section
While watching the screen, rotate the transducer over the aorta in the upper abdomen from a transverse to a longitudinal plane of section. As you move the transducer slowly toward the right side, the aorta will disappear and the vena cava will come into view (Fig. 3.4). Scan across the entire aorta and vena cava. Repeat this pass several times.
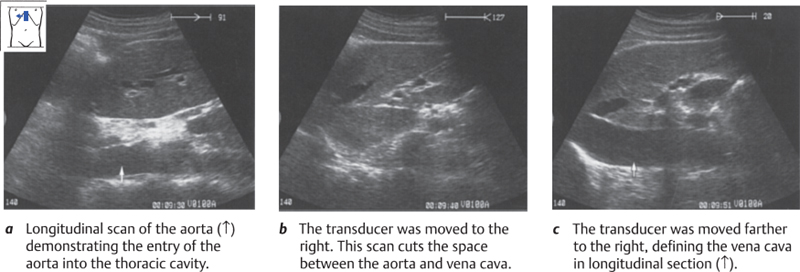
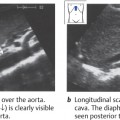
Fig. 3.4 Upper abdominal longitudinal scans of the aorta and vena cava
Now move the transducer down to the midabdomen. You will notice that the vessels are obscured by gas — usually in the transverse colon, which is cut transversely by the scan plane. As before, scan slowly across the entire aorta and vena cava several times (Fig. 3.5).
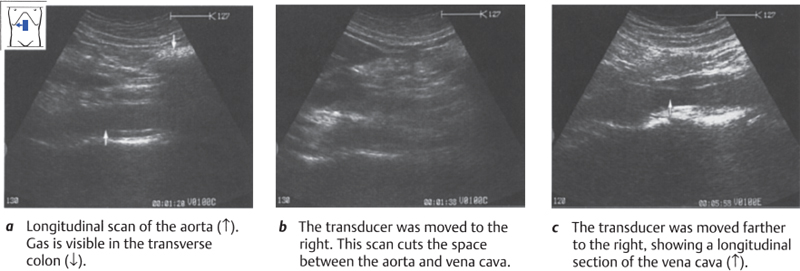
Fig. 3.5 Midabdominal longitudinal scans of the aorta and vena cava
Abnormalities in the course of the aorta
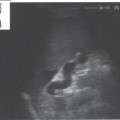
Elongation and kinking of the aorta may occur with ageing (Fig. 3.6). In these cases only small segments of the kinked aorta can be seen in longitudinal sections. In transverse sections, you will see the lumen deviate toward the right or left side as you scan down the vessel.
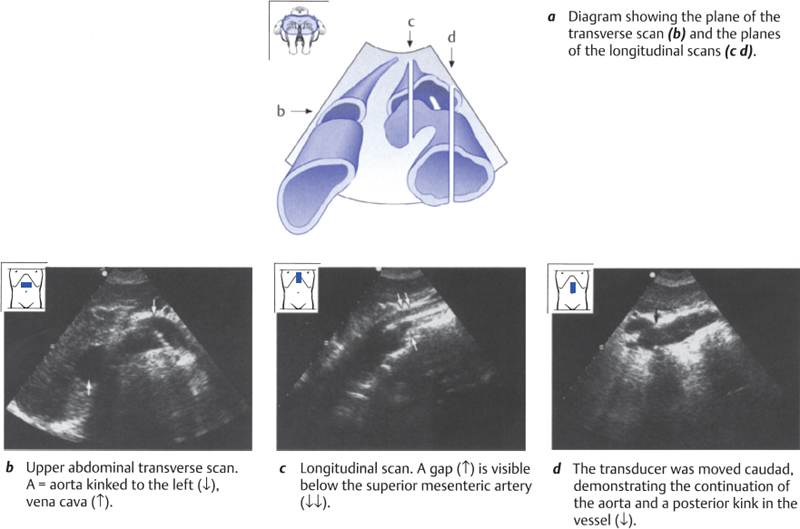
Fig. 3.6 Kinking of the aorta toward the left side
 Organ Details
LEARNING GOALS
 Locate and identify the aorta and vena cava.
 Demonstrate the aorta and vena cava in their entirety.
 Locate and identify the branches of the aorta and the vena cava.
Demonstrating arterial and venous pulsations
Demonstrate the aorta in an upper abdominal longitudinal scan. Notice the firm beat of its pulsations. Now image the vena cava in longitudinal section and observe the soft, double-beat pattern of its pulsations.
K E Y P O I N T S
The aorta cannot be compressed with the transducer.
The diameter of the aorta gently tapers from 2.5 cm superiorly to 2.0 cm inferiorly.
The lumen of the vena cava becomes smaller during inspiration.
Evaluating the vessel walls and lumina
Image the aorta in longitudinal section. Look at its thick, echogenic wall. Occasionally a typical three-layered wall structure can be seen (Fig. 3.7). Note how the size of its lumen does not change during pulsations or during inspiration/expiration. Apply pressure over the aorta with the transducer and notice that it is not compressible. The normal aorta tapers from above downward, its diameter decreasing from approximately 2.5 cm to 2.0 cm.
Define the vena cava in longitudinal section. Notice its thin wall and the changes in its caliber during the pulse phases. Have the subject breathe in and out (Figs. 3.8, 3.9) and observe how the lumen narrows during inspiration.
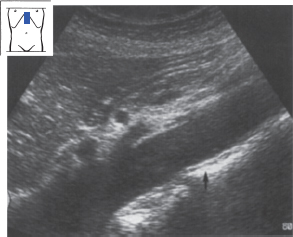
Fig. 3.7 Longitudinal scan of the aorta. The three-layered wall structure is faintly visible (↑). Notice the smooth outline of the vessel wall.
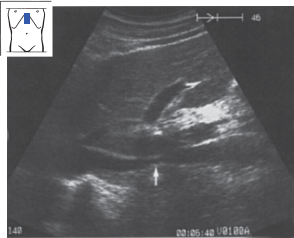
Fig. 3.8 Longitudinal scan of the vena cava during inspiration (↑).
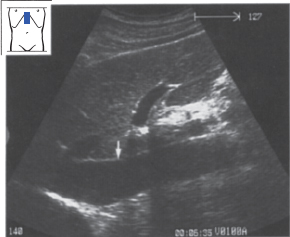
Fig. 3.9 Vena cava during expiration (↓).
Abnormalities of the aortic wall and lumen
Atherosclerotic plaque. It is common to find atherosclerotic plaques on the inner wall of the aorta and its branches (Figs. 3.10–3.13).
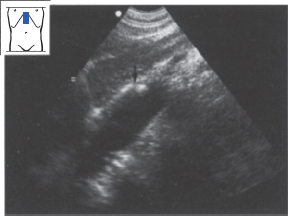
Fig. 3.10 Atherosclerotic plaque (↓) at the origin of the celiac trunk in longitudinal section.
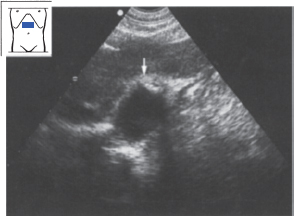
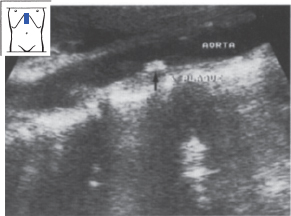
Fig. 3.12 Atherosclerotic plaque on the posterior wall of the aorta (↑).
Aortic aneurysm. Most aortic aneurysms occur at an infrarenal level, and generally they are easy to detect. A saccular aneurysm (Fig. 3.14) appears as a circumscribed, asymmetrical outpouching of the aorta, while a fusiform aneurysm (Fig. 3.15) uniformly affects the circumference of the vessel (Fig. 3.16). With a dissecting aneurysm, the intimal flap can be recognized as a bright echo (Fig. 3.17). Table 3.1 reviews the sonographic features of aortic aneurysm.
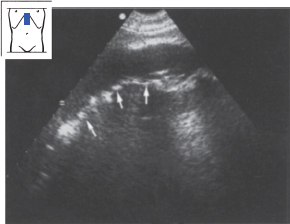
Fig. 3.13 Atherosclerosis (↑↑↑) involving a long segment of the aortic posterior wall.
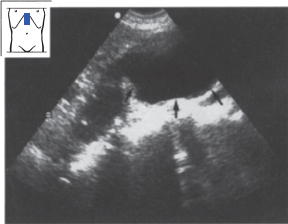
Fig. 3.14 Saccular aortic aneurysm (↑↑↑)
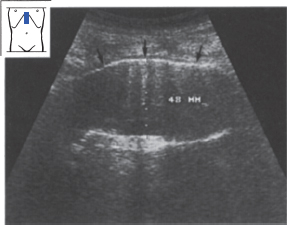
Fig. 3.15 Fusiform aortic aneurysm (↓↓↓).
Table 3.1 Sonographic features of aortic aneurysm
Distension >30 mm Pulsations Signs of aortic sclerosis Possible partial thrombosis |
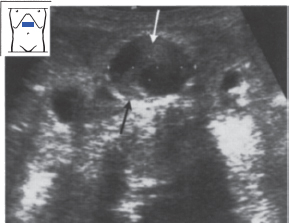
Fig. 3.16 Aortic aneurysm with a thrombus. Notice the mural thrombus (↑↓) and two lumina.
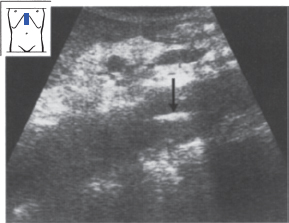
Fig. 3.17 Dissecting aortic aneurysm. The echogenic intima (↓) is clearly defined.
Table 3.2 Sonographic features of vena cava thrombosis
Distension Lack of compressibility Intraluminal echogenicity |
Aortic aneurysms tend to enlarge over time. The larger the aneurysm, the more rapid its progression. Aneurysms less than 5 cm in diameter grow by 2-4mm each year. Cases of this kind should be scanned every three months to evaluate size. Aneurysms with a diameter of 5 cm or more grow by up to 6 mm per year. These cases should be evaluated for surgical treatment. With aneurysms larger than 7 cm, the risk of rupture in one year is greater than 50%.
Luminal and wall abnormalities of the vena cava
Heart failure. Scanning in patients with overt right heart failure demonstrates an enlarged vena cava (>2cm) that is resistant to compression and does not change its caliber with respiration (Fig. 3.18).
Vena cava thrombosis. A thrombus appears as an intraluminal area of high echogenicity (Fig. 3.19). As in heart failure, the vessel does not show caliber changes with respiration. Table 3.2 lists the sonographic features of vena cava thrombosis.
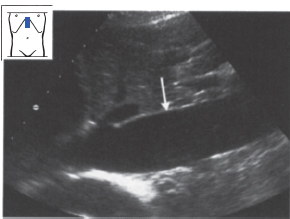
Fig. 3.18 Right-sided heart failure. Ultrasound shows an enlarged, noncompressible vena cava (↓) 2.9 cm in diameter.
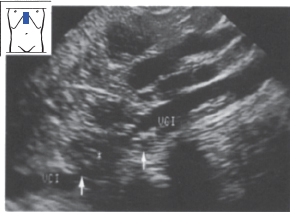
Fig. 3.19 Vena cava thrombosis (↑). The lumen is occluded by echogenic thrombus.
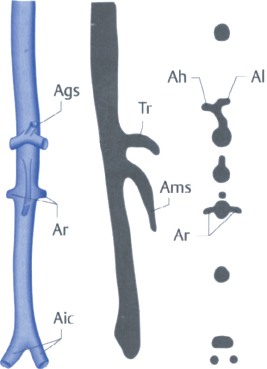
Fig. 3.20 The branches of the aorta viewed from the front, from the side, and in cross section.
Tr = celiac trunk, Ah = hepatic artery, Al = splenic artery, Ags = left gastric artery, Ams = superior mesenteric artery, Aic = common iliac arteries, Ar = renal artery
Identifying and defining the branches of the aorta and vena cava
Aortic branches
You know the anatomy of the aortic branches that can be seen with ultrasound: the celiac trunk with the hepatic artery, splenic artery, and left gastric artery; the superior mesenteric artery; the right and left renal arteries; and finally the right and left iliac arteries (Table 3.3
Stay updated, free articles. Join our Telegram channel

Full access? Get Clinical Tree


