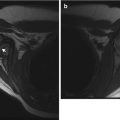
Fig. 25.1
Histology of normal hematopoietic and fatty marrow. (a) Hematopoietic marrow is very cellular (white arrows) and has little fat (arrowhead). Supporting trabeculae (black arrow). (b) Fatty marrow has low cellularity (black arrow) and extensive fat
Fat cells may be actively involved in hematopoiesis, supplying metabolic or nutritional support, possibly along with growth factors [5]. The cellular composition of adult red marrow is 60 % hematopoietic cells and 40 % adipocytes, while its chemical composition is 40–60 % lipid, 30–40 % water, and 10–20 % proteins [6]. In contrast, yellow marrow is almost entirely composed of adipocytes (95 %), with its chemical composition being 80 % lipid, 15 % water, and 5 % protein [6–8]. In neonates and young infants, little or no marrow fat is present. Red marrow is significantly more cellular than yellow, with 100 % cellularity at birth; this decreases to 80–90 % in infancy and 60–80 % in young children [8]. Cancellous bone, composed of primary and secondary bridging trabeculae, provides the underlying structural framework for the cellular elements of marrow and also serves as a mineral depot [9].
The MRI signal of marrow reflects its cellular composition. Hematopoietic marrow is usually similar to or slightly more hyperintense than muscle on T1-weighted (T1-W) and T2-weighted (T2-W) sequences, although in neonates it can be slightly darker than muscle on T1-W images as a result of its relatively high cellularity [10, 11]. On T1-W sequences, yellow marrow is isointense to subcutaneous fat, whereas on T2-W images it appears similar to or slightly more hypointense than subcutaneous fat and slightly more hyperintense than muscle. This is discussed in greater detail below, in the section on MRI technique and the appearance of bone marrow.
Bone Marrow Conversion
The cellular composition of normal marrow changes significantly with age (Box 25.1). This is termed marrow conversion. Thorough understanding of the rate and anatomic pattern of marrow conversion has allowed for MRI mapping of the expected age-related distribution of marrow throughout the skeleton [8, 11–15]. At birth, hematopoietic marrow is present throughout the entire skeleton. Various regions of hematopoietic marrow then rapidly undergo conversion to fatty marrow. This begins in the periphery of the skeleton—first in the distal phalanges of the fingers and toes (Fig. 25.2) and then extending in a symmetric, centripetal manner into the more proximal skeleton [6, 16]. During the first decade, but especially during the first 5 years of life, the long bones undergo marrow conversion [17].
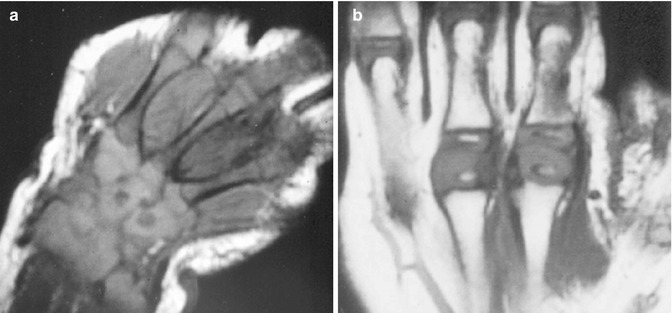
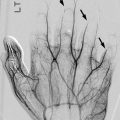
Fig. 25.2
Normal rapid conversion from hematopoietic to fatty marrow in the peripheral appendicular skeleton. (a) Coronal T1-weighted (T1-W) hand in a neonate shows T1-hypointense hematopoietic marrow in the metacarpals. The epiphyses and carpal bones are cartilaginous and mildly hyperintense. (b) Coronal T1-W hand in a 1-year-old shows fatty conversion of the metacarpals and phalanges, which are now hyperintense, brighter than the cartilaginous portions of the epiphyses
Box 25.1: Conversion of Hematopoietic to Fatty Marrow
Neonate | Hematopoietic marrow everywhere | |
Conversion | Progression: distal to proximal (distal phalanges to proximal long bones) | |
Epiphysis: rapid conversion to fatty marrow (within several months of ossification) | ||
Residual red marrow common in humeral head | ||
Diaphysis to distal metaphysis to proximal metaphysis | ||
Spine: on T1-W imaging | ||
<1 year old | Vertebral body darker than intervertebral disk | |
1–3 to 5 years old | Vertebral body similar to intervertebral disk | |
>3 to 5 years old | Vertebral body brighter than intervertebral disk | |
The epiphyses are the first areas to develop fatty marrow, as discussed below and in Chap. 2. Marrow conversion then occurs in the diaphysis and progresses to the distal and finally proximal metaphyses [6, 16] (Fig. 25.3). Slight early fatty conversion can result in subtle increased signal in the diaphysis as soon as age 3 months, and by 1 year of age, some degree of heterogeneity is routinely evident. By age 5 years, the femoral diaphysis is homogeneously hyperintense due to fatty conversion [17]. Persistence of significant hematopoietic marrow in the diaphysis after about age 10 is abnormal.

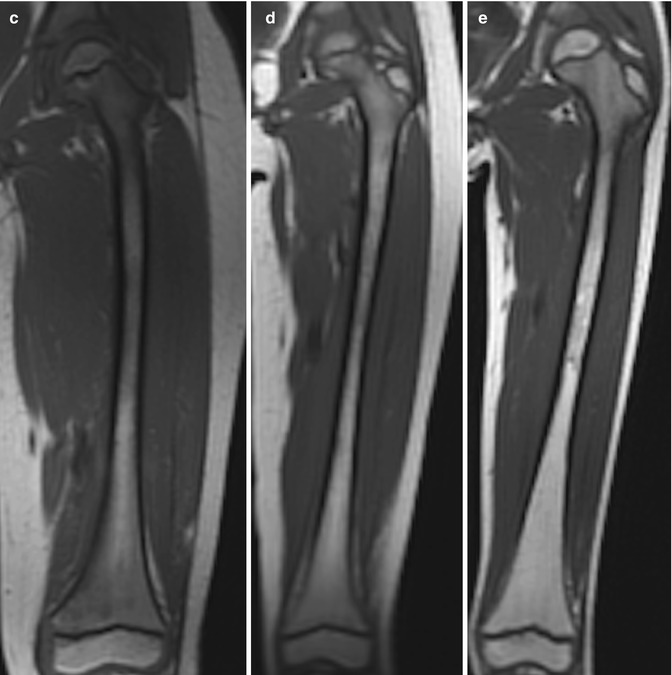
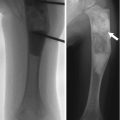
Fig. 25.3
Normal marrow conversion in the femur on coronal T1-W images. (a) 1-year-old boy: the diaphysis has subtle hyperintensity, but the metadiaphysis is predominantly hypointense. The ossification center at the proximal femur is hyperintense due to fatty marrow (the distal femoral ossification center is almost entirely out of plane). (b) 4-year-old girl: heterogeneous hyperintensity is evident in the diaphysis and distal metaphysis. (c) 6-year-old boy: hyperintensity at the distal femur has increased. (d) 7-year-old girl: the distal femoral metaphysis is almost uniformly hyperintense, and the proximal metaphysis is becoming brighter. (e) 9-year-old boy: there is now heterogeneous hyperintensity at the proximal femoral metaphysis (Courtesy of Rebecca Stein-Wexler)
Cartilaginous epiphyses and apophyses lack marrow until they ossify. Once ossified, these centers initially contain hematopoietic marrow that is hypointense on T1-W and hyperintense on T2-W images. This is rapidly converted to fatty marrow within months of ossification (with resultant hyperintense signal on both T1- and T2-W images) (Fig. 25.4). In the mid- to late third decade of life, bone marrow distribution achieves its adult state [16], confined to the axial skeleton and proximal humeri and femurs.
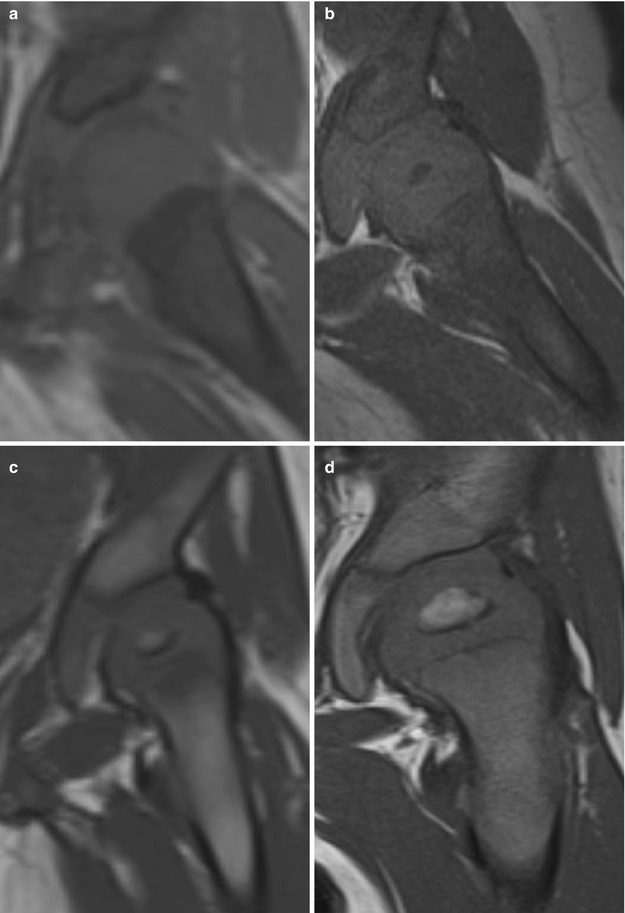
Fig. 25.4
Changes in the appearance of the proximal femur on coronal T1-W images during early childhood. (a) The femoral head of this 3-month-old girl is uniformly isointense to muscle; there is no ossification center. (b) The femoral head of another 3-month-old girl is hypointense, with early ossification and formation of hypointense red marrow. In both a and b, the proximal femur is hypointense due to red marrow. (c) The femoral head in a 6-month-old girl is converting to fatty marrow, slightly hyperintense to muscle. (d) The femoral head in this 8-month-old boy is larger and demonstrates hyperintense fatty marrow (Courtesy of Tal Laor, Cincinnati Children’s Hospital)
Even though red marrow persists in the axial skeleton, it too undergoes conversion—though later and more gradually than in the appendicular skeleton (Fig. 25.5). For example, the amount of hematopoietic marrow in the vertebral bodies diminishes, with corresponding slight increase in fatty marrow. Before age 1 year, the vertebral body appears hypointense on T1-W images compared with the intervertebral disks. It then becomes isointense to the disks. After age 3–5 the vertebral body is mildly hyperintense compared with the disks, and this hyperintensity gradually increases [18, 19] (Box 25.1).
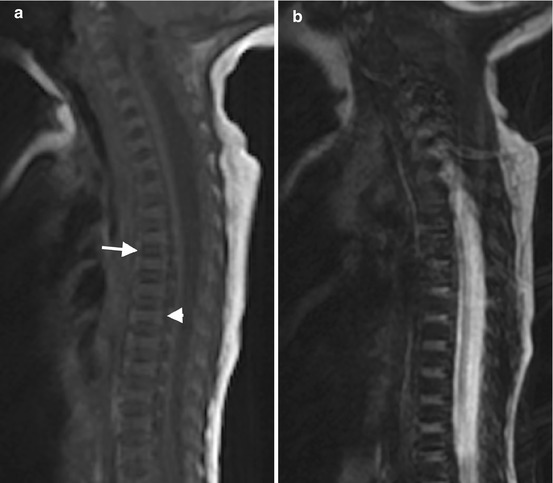
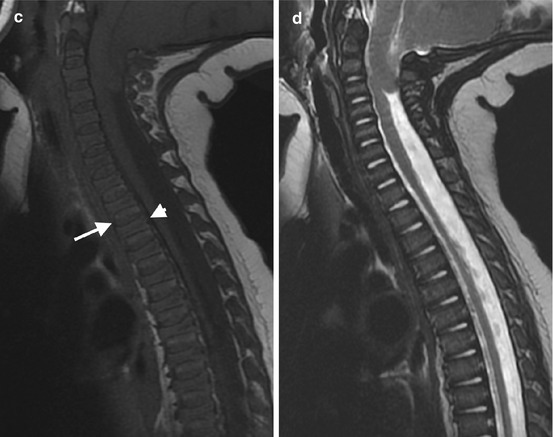
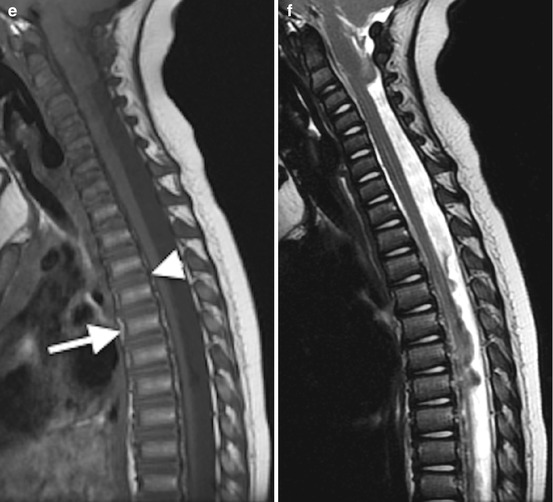
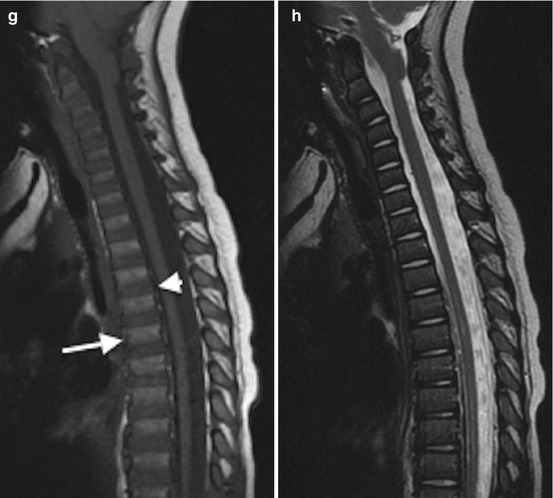
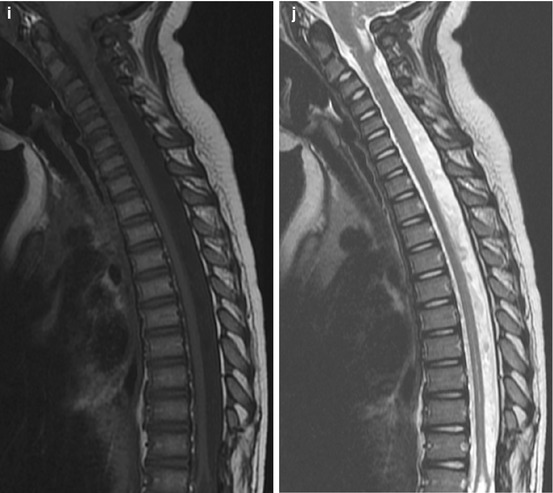
Fig. 25.5
T1 and T2 signal alterations in the vertebral bodies during early childhood in a girl followed for Chiari I malformation and syrinx (sagittal views). At 1 week, T1-W image (a) shows marrow (arrow) that is hypointense compared with the hyperintense intervertebral disk (arrowhead) and adjacent vertebral body cartilage; T2-W image (b) shows the vertebral bodies are hypointense compared to hyperintense intervertebral disks. At 6 months, T1-W image (c) shows that the vertebral body (arrow) is heterogeneous but predominantly isointense to the intervertebral disk (arrowhead); T2-W image (d) shows uniform marrow and cartilage hypointensity compared to the disk. At 14 months, T1-W image (e) shows that the marrow (arrow) is slightly more hyperintense than the disk (arrowhead); T2-W image (f) shows little change. At 2 years, T1-W image (g) shows marrow (arrow) is brighter than disk (arrowhead); T2-W image (h) shows decreasing marrow signal intensity (compared to disk) due to progressive increase in fatty marrow. At 3.5 years, T1-W image (i) shows that hyperintense marrow fills the marrow space more completely and is hyperintense to disk; T2-W image (j) shows no significant change (Courtesy of Rebecca Stein-Wexler)
Box 25.2: Characteristics of Metaphyseal Residual Red Marrow
Symmetric, with base near physis (flame shape)
Margins: vertical, feathery, ill defined
Center: ± fat
T1-W: brighter than muscle
No trabecular distortion or mass effect
These are only general guidelines on marrow maturation, and variation and incomplete conversion are very common. For example, prominent hematopoietic marrow in the metaphyses is normal until the end of the second decade. In fact, the lack of red marrow in the proximal femoral metaphyses in the young child is abnormal and raises concern for myeloid depletion.
Heterogeneous, sharply demarcated linear areas or focal islands of red marrow are common normal variants (Fig. 25.6). Although they can be confused with marrow lesions, several features help to differentiate. Residual red marrow typically has a symmetric distribution and abuts or almost abuts the physis. It is flame shaped and often has vertical or feathery margins, with a central focus of fatty marrow (target sign). It does not disturb the trabeculae. Finally, residual marrow should be brighter than muscle on T1-W imaging and similar to marrow on short-tau inversion recovery (STIR) (Box 25.2).
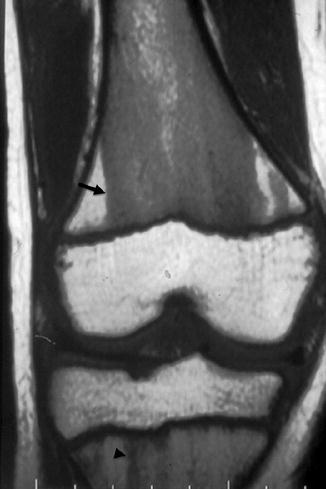
Fig. 25.6
Prominent persistent hematopoietic marrow. Coronal T1-W image shows hypointense hematopoietic marrow that has the typical straight margins (arrow) and is brighter than muscle. At the proximal tibial metaphysis, residual hematopoietic marrow appears feathery and flame shaped (arrowhead)
Small foci of high-signal T2 changes of the bone marrow are common within the foot and ankle, wrist, and cervical spine in children up to the age of 15 years (Fig. 25.7). These may reflect residual regions of red marrow or possibly asymptomatic changes from subclinical trauma. Out-of-phase imaging may help differentiate hematopoietic marrow from metastasis.
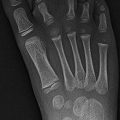
Fig. 25.7
Normal hyperintense foci in tarsal bones of a 9-year-old. Sagittal inversion recovery (IR) image (Courtesy of Rebecca Stein-Wexler)
Prominent hematopoietic marrow can occasionally be normal in the subchondral regions of some epiphyses, most often in the distal femur, proximal tibia, and proximal humerus (Fig. 25.8). Although this is often interpreted as evidence of marrow reconversion, it likely represents residual hematopoietic marrow [20].
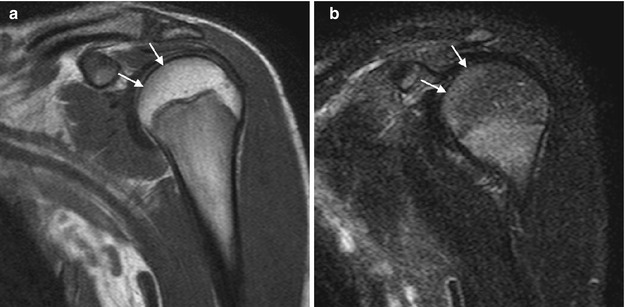
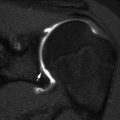
Fig. 25.8
Subchondral epiphyseal hematopoietic marrow, a normal variant. (a) Coronal T1-W image shows subchondral hypointensity (arrows). (b) Coronal T2-W FS image shows increased signal in the corresponding area (arrows). Vascularity in the subchondral region is slightly increased, and hematopoietic marrow may persist within the epiphysis
Bone Marrow Reconversion
In the event of increased functional demand for hematopoiesis, yellow marrow may reconvert to red marrow. Conditions triggering reconversion include chronic hemolytic anemias (such as sickle-cell disease and thalassemia) (Fig. 25.9), physiologic stress, endurance running, obesity, extensive marrow replacement from marrow proliferative or replacement disorders, and chemotherapy with marrow-stimulating agents such as granulocyte colony-stimulating factor [12, 16] (Fig. 25.10). The extent of reconversion depends on the severity and duration of the stimulus. This reconversion process typically reverses the order of initial conversion, first in the central and then the peripheral skeleton, and in the long bones from the metaphyses to the diaphyses [6].
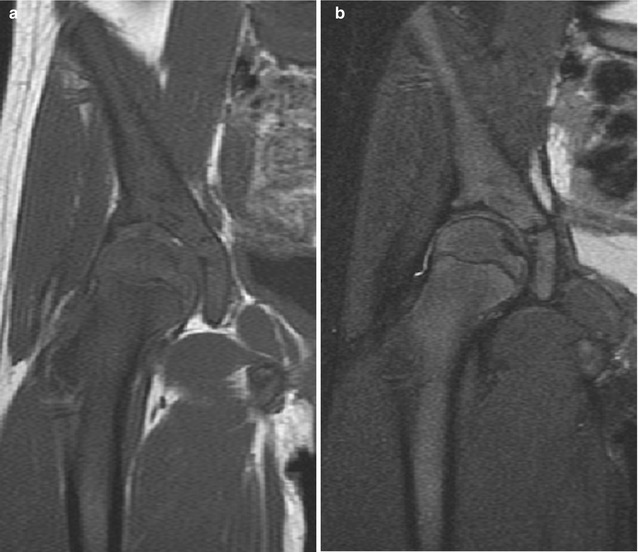
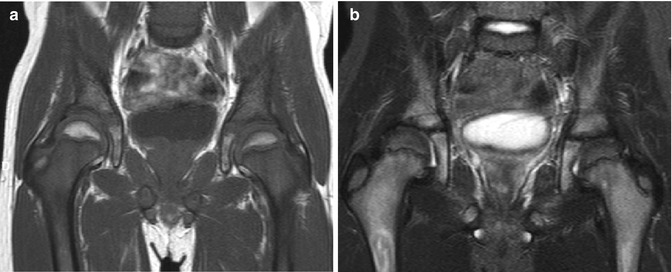
Fig. 25.9
Marrow reconversion in a young adolescent girl with sickle-cell disease. (a) T1-W coronal image shows diffuse hypointensity throughout the marrow due to replacement of all expected fatty marrow with hematopoietic marrow. This is especially striking at the femoral head, which should be hyperintense. (b) T2-W FS image shows diffuse intermediate signal due to marrow reconversion
Fig. 25.10
Marrow reconversion after therapy with granulocyte colony-stimulating factor in a child with osseous metastases in the proximal femurs due to rhabdomyosarcoma. (a) On T1-W coronal image, diffuse hypointensity in the femoral metaphysis results from combination of hematopoietic marrow and metastases. (b) On T2-W FS image, heterogeneous signal better delineates these two processes
2 MRI Technique and Appearance of Bone Marrow
MRI is the mainstay of clinical marrow evaluation. The MRI characteristics of bone marrow are influenced by a number of factors, including the choice of imaging sequence, use of contrast agents, marrow cellularity (especially its hematopoietic, lipid, and iron content), and surrounding trabecular bone [3].
On T1–weighted (T1–W) and T2–weighted (T2-W) fast spin–echo (FSE) sequences, differences in T1 and T2 relaxation times generally allow the differentiation of normal red and yellow marrow from pathologic marrow. The trabecular bone itself has little direct signal but contributes to T2 shortening, producing local magnetic field gradients [7, 21].
Since fatty marrow is composed primarily of low-cellular lipids, its signal characteristics are similar to those of subcutaneous fat on both T1-W and T2-W spin-echo (SE) sequences. Red marrow is more cellular but still contains significant lipid, and therefore, the signal characteristics of fat are averaged with the longer T1 and T2 relaxation times of water and protein [7, 12]. On T1-W images, the signal intensity of red marrow is less than that of fatty marrow but typically higher than that of adjacent muscle or intervertebral disks (except in the very young child, in whom the fat content of hematopoietic marrow can be quite low). The exact marrow signal intensity will depend on the specific water and lipid content [7, 12]. On T2-W images, the signal intensity of red marrow is similar to that of adjacent muscle and approximates the signal intensity of fatty marrow. Hence, the contrast between red and fatty marrow is more evident on T1-W sequences. SE imaging underestimates the proportion of hematopoietic marrow because the short T1 relaxation time of fat overwhelms the longer T1 relaxation time of red marrow.
Fast spin-echo (FSE) T2–W sequences have largely replaced conventional T2-W SE imaging because of the marked reduction in acquisition times as well as improved signal-to-noise ratio for similar acquisition times [3]. Fat is much brighter on T2-W FSE images compared with conventional T2-W images, and selective fat suppression is therefore generally applied to FSE T2-W images to improve other tissue contrast [12]. With fat suppression, T2-W FSE images have been shown to be highly effective in the evaluation of marrow abnormalities, improving lesion conspicuity [22] (Fig. 25.11). As most marrow lesions are rich in free water, they are brighter than both red and yellow marrow on T2-W images and thus easily detected [12].
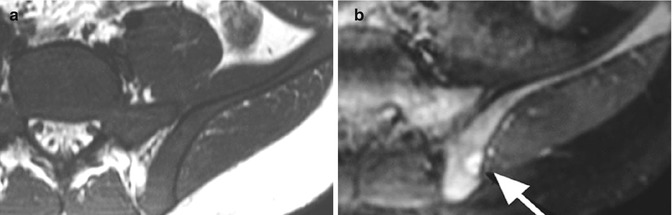
Fig. 25.11
Hypercellular marrow with focus of metastatic Wilms tumor evident only on T2-W FS imaging in a 2-year-old. (a) On T1-W axial image, marrow signal is uniformly hypointense. (b) T2-W FS image shows intermediate signal in most of the marrow and a focal hyperintense lesion (arrow) that was obscured by adjacent hematopoietic marrow on T1
Short–tau inversion recovery (STIR) or FSE inversion recovery (FSE IR) demonstrates lesions well. STIR is widely used for bone marrow imaging because it offers excellent delineation of marrow abnormalities and, depending on technical parameters, may yield improved lesion visibility compared with T2-W SE imaging. STIR images have additive T1 and T2 characteristics, so lesions with long T1 and T2 relaxation times are bright on STIR. Normal fatty marrow is low in signal intensity, while red marrow demonstrates intermediate signal intensity, similar to muscle [3]. The chemical shift/selective fat suppression techniques used in FS T2-W FSE images may cause field heterogeneity, particularly with large fields of view. STIR imaging is less susceptible to magnetic field inhomogeneity, and therefore, a large volume of bone marrow can be assessed with large field of view STIR imaging [12]. Fast STIR sequences can demonstrate marrow lesions as well as conventional STIR sequences, with considerable savings in imaging time.
Intermediate proton density (PD) images lack sufficient contrast resolution between normal marrow and pathologic processes to be primarily useful for marrow evaluation.
Gradient-echo (GRE) sequences are sometimes helpful in musculoskeletal imaging, especially for delineation of hemosiderin. Many factors influence the appearance of normal marrow on GRE, including tissue characteristics and acquisition technique. Unlike SE techniques, local magnetic field inhomogeneities are not rephased on GRE, making it more sensitive to susceptibility differences and signal loss, especially with 3-Tesla (T) imaging. This includes the effects induced by trabecular bone and marrow heterogeneity [3]. On GRE imaging, this leads to a loss of marrow signal intensity that is greatest in the regions with the most trabecular bone (e.g., epiphyses, metaphyses, and vertebrae) and is even greater when there is iron, such as in hematopoietic marrow. Hence, there is more signal loss for epiphyseal marrow than for metaphyseal marrow and more for metaphyseal marrow than for trabeculae-poor diaphyseal marrow [23].
Fat suppression offers important information. In GRE sequences, if fat and water protons are in phase (typically an echo time [TE] of 4.2 ms at 1.5 T), their signals are added; if they are opposed phase (a TE of 2.1 ms at 1.5-Tesla (1.5 T)), the image obtained represents the difference between the lipid and water signals. This can be used to help identify the presence or absence of marrow fat. Since both hematopoietic and fatty marrow contain fat, normal marrow signal is suppressed and appears dark on opposed-phase imaging (see Fig. 25.8). However, if normal marrow is replaced by a lesion (with loss of marrow fat), no subtraction will be apparent on opposed-phase imaging, and the lesion will remain bright [24]. This is useful for differentiating neoplasia from normal marrow as well as in evaluation of nonneoplastic processes, such as ischemia and injury, where marrow fat persists [20].
Gadolinium-enhanced images are particularly useful for the detection of diffusely abnormal marrow that may not be recognized on unenhanced MRI [25, 26]. However, normal hematopoietic marrow of some infants and young children may also enhance, as it can be quite vascular. The degree of enhancement depends on the type of marrow present and is generally much more evident with hematopoietic than with fatty marrow. Normal marrow enhancement decreases with advancing age, paralleling an increasing proportion of marrow fat and accompanying decreasing vascularity [3]. In addition, delay in scanning after gadolinium injection reduces the degree of enhancement [25].
Dynamic gadolinium–enhanced imaging can be useful for tumor evaluation, as it assesses capillary blood flow, permeability, and the relative volume of the extravascular extracellular space. It may allow differentiation of tumor from the many other processes that also cause abnormal marrow enhancement, such as inflammation and infection. Angiogenesis, which is common with neoplastic involvement of the marrow, leads to increased initial flow [20]. Peak normal marrow enhancement is evident within the first minute after injection (between 45 and 60 s). Dynamic contrast-enhanced MRI allows quantitative estimates of tumor necrosis, which correlate well with pathologic determination of percent necrosis. The dynamic MRI’s ability to distinguish between tumors that are less or more than 90 % necrotic is especially important clinically, as this noninvasive assessment of treatment response during neoadjuvant therapy can suggest which patients would benefit from a change in therapy [27].
Studies in adults suggest that diffusion-weighted MRI allows excellent distinction between neoplastic and benign causes of collapsed vertebral bodies [20], and there may be similar applications in children. Diffusion-weighted imaging is based on the principle of Brownian motion of water molecules. The apparent diffusion coefficient (ADC) of tissues quantifies this microscopic motion in tissues and reflects local water mobility. The free motion of water molecules in normal tissues results in relatively high ADC values. Both densely packed cells within a tumor and cytotoxic edema restrict the motion of free water molecules, thus decreasing the ADC and resulting in low signal on an ADC map. High-resolution diffusion-weighted MRI with STIR-echo planar imaging sequence and free-breathing scanning can be used to create three-dimensional displays of the marrow [28].
In the neonate and young child, assessment of the marrow is often more challenging. For example, in the developing spine, striking marrow enhancement results from hypervascularity, increased marrow cellularity, and extensive extravascular space where contrast can pool. From the neonatal period through early childhood, increased cellularity due to especially active hematopoiesis results in unusually hyperintense T2 signal (brighter than muscle), no loss of signal on out-of-phase imaging, and regions of restricted diffusion that may mimic lesions.
Whole–body MRI (WB–MRI) allows noninvasive and relatively rapid survey of the entire body and bone marrow (usually with STIR technique). This supplements standard multimodality imaging both for initial tumor staging and to screen for tumor recurrence [2] and may help detect distant metastatic disease. Pediatric patients may benefit especially from WB-MRI, as marrow metastases in the peripheral skeleton are more common in children than in adults [29]. The use of WB-MRI has also been reported in Langerhans cell histiocytosis, chronic osteomyelitis, and systemic muscle diseases [30–33]. WB-MRI facilitates accurate biopsy by identifying the exact location of marrow involvement in cases of focal disease.
Fluorodeoxyglucose positron emission tomography (FDG PET) may be more sensitive for detecting bone metastasis than WB-MRI in children, but it may have more false-positives [34]. Furthermore, FDG PET requires complementary CT or MRI to localize areas of increased glucose metabolism. In addition, FDG PET may not display or demonstrate skull metastases because the high glucose metabolism of normal brain may obscure lesions [35]. Positron emission tomography-magnetic resonance imaging (PET-MRI) may improve both sensitivity and specificity for detecting marrow metastases. MRI techniques employing injection of ultrasmall super-paramagnetic iron oxide particles have the potential to improve the contrast between tumor and normal marrow (the reticuloendothelial system of normal marrow phagocytizes the particles, resulting in signal loss) [36, 37].
3 Abnormal Bone Marrow
A variety of disorders may lead to abnormal marrow. These include disorders of marrow hyperplasia and reconversion, disorders with diffuse marrow infiltration (including neoplasia and non-tumoral infiltration), and disorders of marrow depletion and failure. MRI has proven to be a sensitive method for detecting focal, multifocal, and diffuse bone marrow lesions, including those of neoplastic, infectious, and ischemic origin (see Table 25.1). Careful consideration of the morphologic signal characteristics of any marrow lesion, its distribution, and its location facilitates diagnosis.
Table 25.1
Marrow disorders by anatomic distribution
Diffuse marrow disorders |
Normal variant |
Gaucher disease |
Iron overload |
Langerhans cell histiocytosis |
Lymphoma |
Marked red cell hyperplasia |
Marrow reconversion |
Metastases from certain solid tumors including neuroblastoma and rhabdomyosarcoma |
Myelodysplastic disorder |
Myelofibrosis |
Myeloproliferative disorders including |
Acute myelogenous leukemia |
Acute lymphoblastic leukemia |
Chronic myelogenous leukemia |
Essential thrombocythemia |
Idiopathic hypereosinophilic syndrome |
Idiopathic myelofibrosis |
Juvenile myelomonocytic leukemia |
Mastocytosis |
Polycythemia vera |
Transient myeloproliferative disorder of Down syndrome |
Multifocal marrow disorders
Related posts:Stay updated, free articles. Join our Telegram channel
Full access? Get Clinical Tree
 Get Clinical Tree app for offline access

|