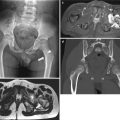
Fig. 5.1
Evolving periventricular leukomalacia (PVL) on US in preterm neonate. (a, b) Initial coronal (a) and sagittal (b) US images obtained at 3 days of life show abnormally increased echogenicity of the periventricular white matter. (c, d) Follow-up US images obtained 3 weeks later reveal multiseptated cystic encephalomalacia of the echogenic periventricular white matter
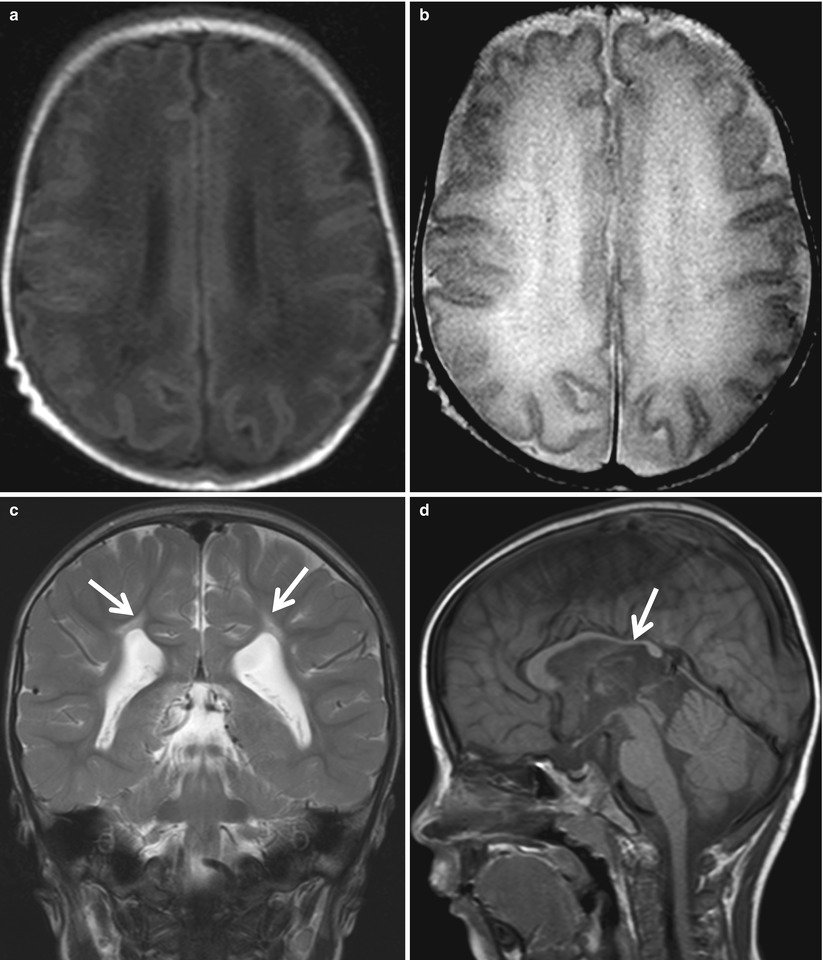
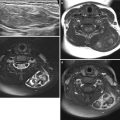
Fig. 5.2
Evolving PVL on MR imaging in preterm neonate. The deep white matter is hypointense on T1-weighted image (a) and hyperintense on T2-weighted image (b) obtained 2 weeks after the birth. Follow-up T2-weighted coronal image obtained 2 years later (c) shows passive enlargement of the lateral ventricles with undulated margins and periventricular hyperintensity (arrows) abutting the ventricular ependyma. Sagittal T1-weighted image (d) demonstrates decreased volume of the posterior body and splenium of the corpus callosum (arrow)
5.4.1.2 Hypoxic Ischemic Brain Injury in Preterms; Noncavitary White Matter Injury
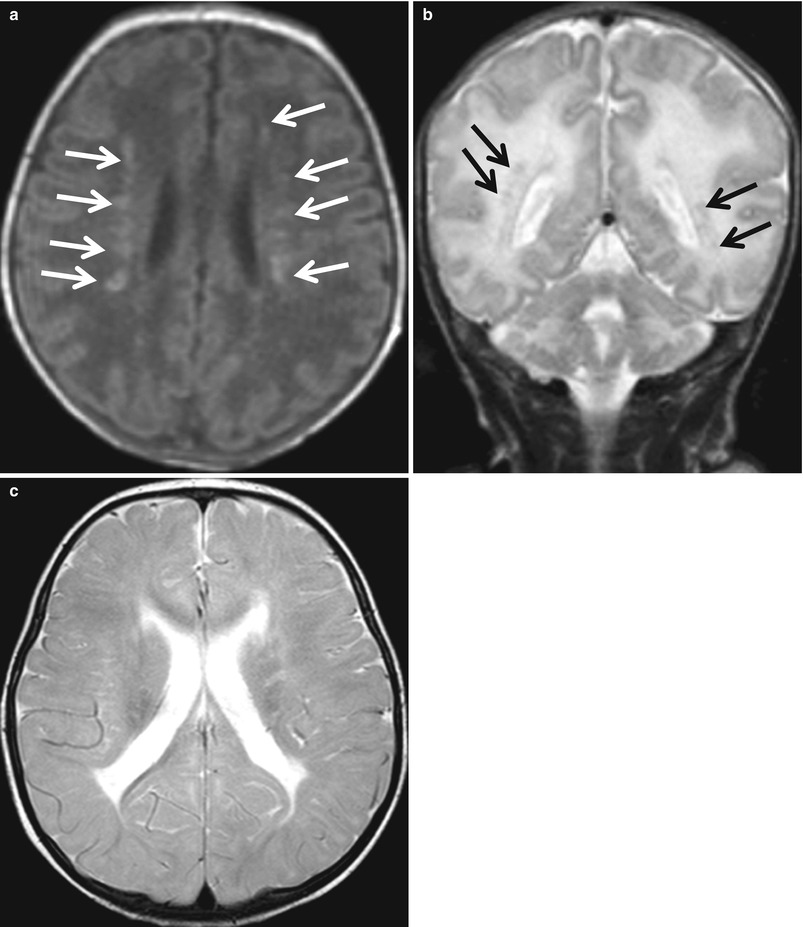
Fig. 5.3
Noncavitary white matter lesions in preterm neonate. There are multiple punctate white matter lesions (arrows) becoming hyperintense on T1-weighted image (a) and hypointense on T2-weighted image (b). (c) Follow-up T2-weighted image obtained 2 months later shows enlarged ventricles and thin area of T2 hyperintensity along the ventricular surface, representing periventricular leukomalacia
5.4.1.3 Hypoxic Ischemic Brain Injury in Preterms; DEHSI (Diffuse Excessive High Signal Intensity)
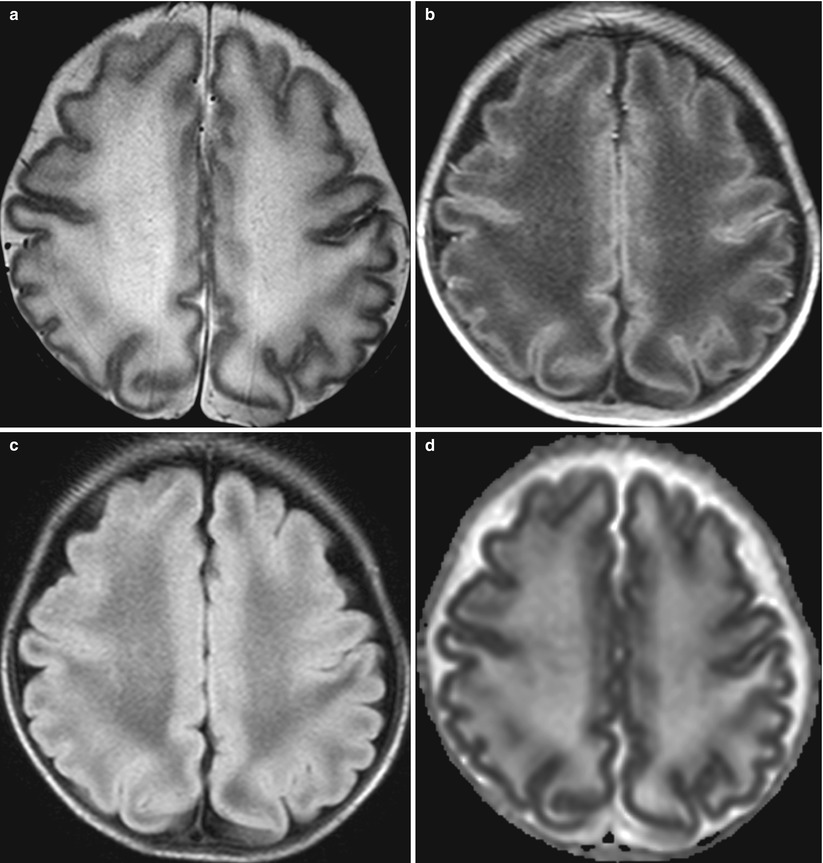
Fig. 5.4
Diffuse excessive high signal intensity (DEHSI) in preterm baby at corrected gestational age of 36 weeks. (a) T2-weighted axial image shows excessive higher signal intensity of the centrum semiovale compared with unmyelinated subcortical white matter. DEHSI lesions exhibit low signal intensity on T1-weighted image (b) and FLAIR image (c) and increased diffusion on ADC map (d)
5.4.1.4 Hypoxic Ischemic Brain Injury in Preterms; Profound Injury
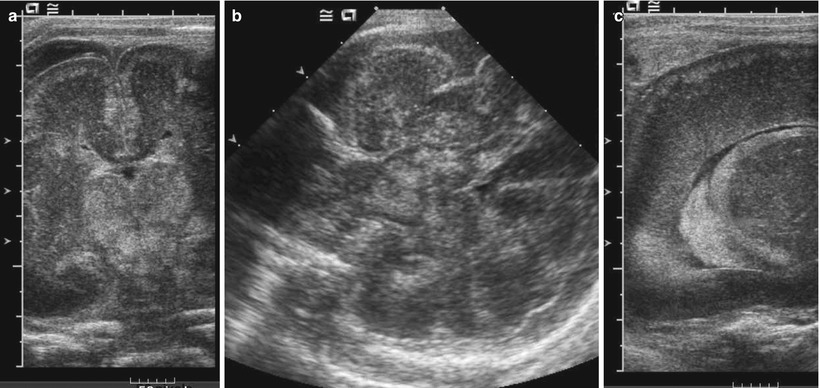
Fig. 5.5
Asphyxiated extremely preterm neonate with 25 weeks of gestational period. Coronal (a) and axial (b) images of the brain US show abnormally echogenic thalami and brain stem. (c) Subcortical layers and germinal layers along the ependyma on the thalamus are also echogenic on a sagittal scan
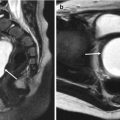
5.4.1.5 Germinal Matrix Hemorrhage and Intraventricular Hemorrhage
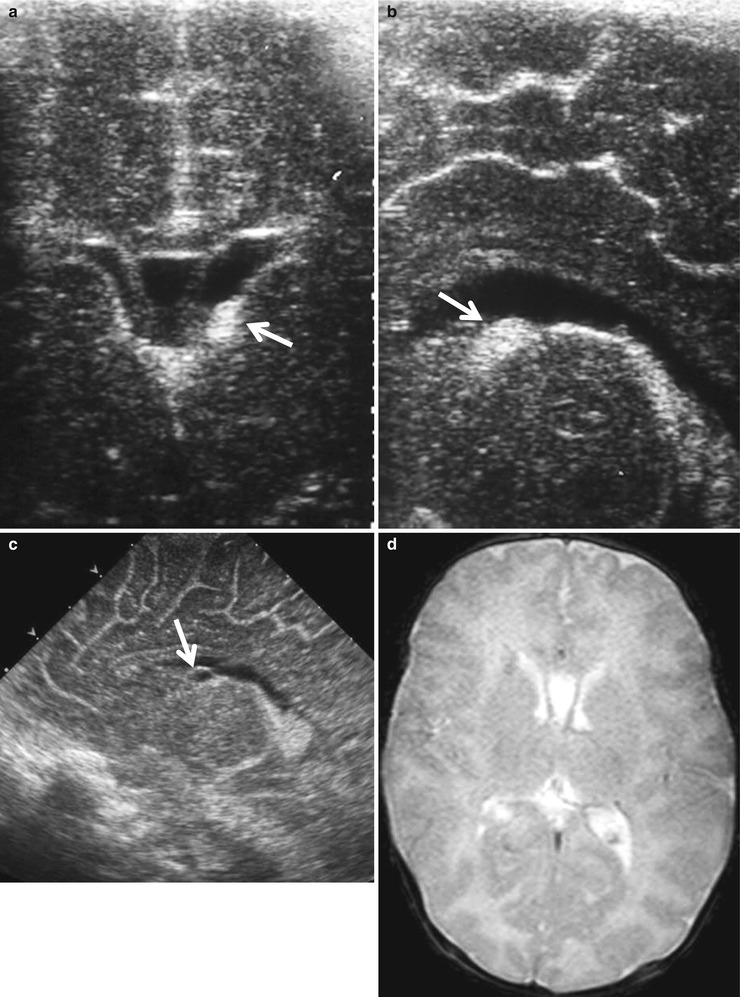
Fig. 5.6
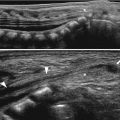
Germinal matrix hemorrhage on US and MR images. (a, b) US obtained at 4 days of life reveals focal echogenic bulging (arrow) at the left caudothalamic groove (ganglionic eminence). (c) Cystic change is evident on follow-up US (arrow), which is not well visualized on T2-weighted MR image (d) obtained on the same day
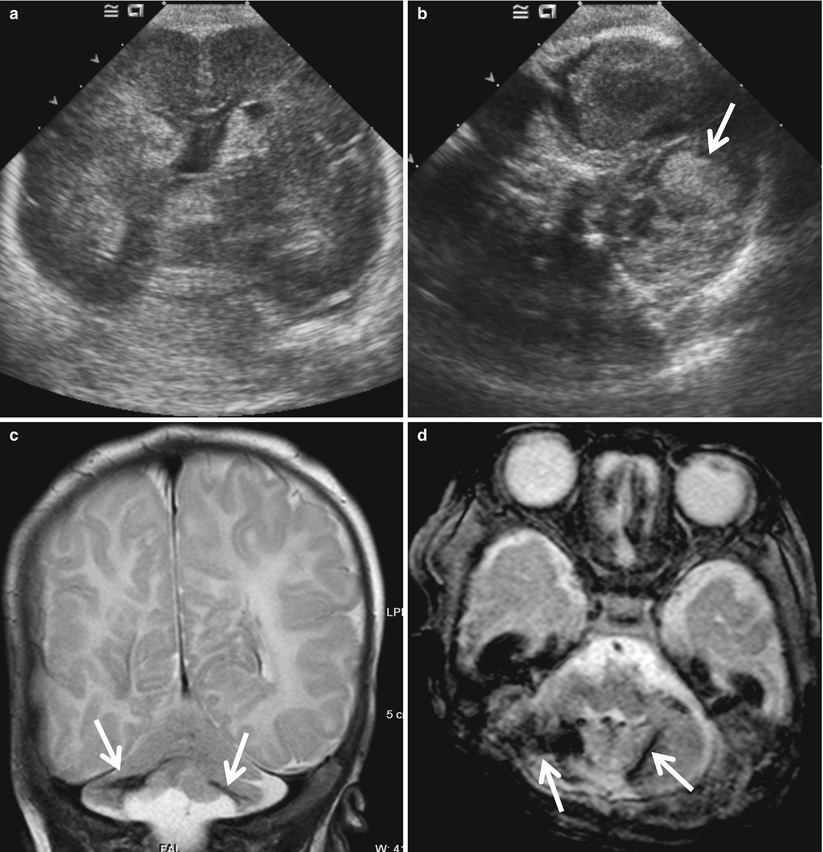
Fig. 5.7
Cerebellar hemorrhage in a neonate with GMH-IVH. (a) Coronal US image shows echogenic hemorrhage in the ventricles. However, cerebellar lesion is not evident because normal cerebellum is echogenic. (b) Echogenic hemorrhage (arrow) in the cerebellum is better demonstrated on axial image obtained from the mastoid fontanel. (c) Bilateral cerebellar hemorrhage (arrow) with tissue loss is apparent on T2-weighted coronal image. (d) Gradient echo axial image demonstrate hemorrhage sensitively as dark signal intensity (arrows)
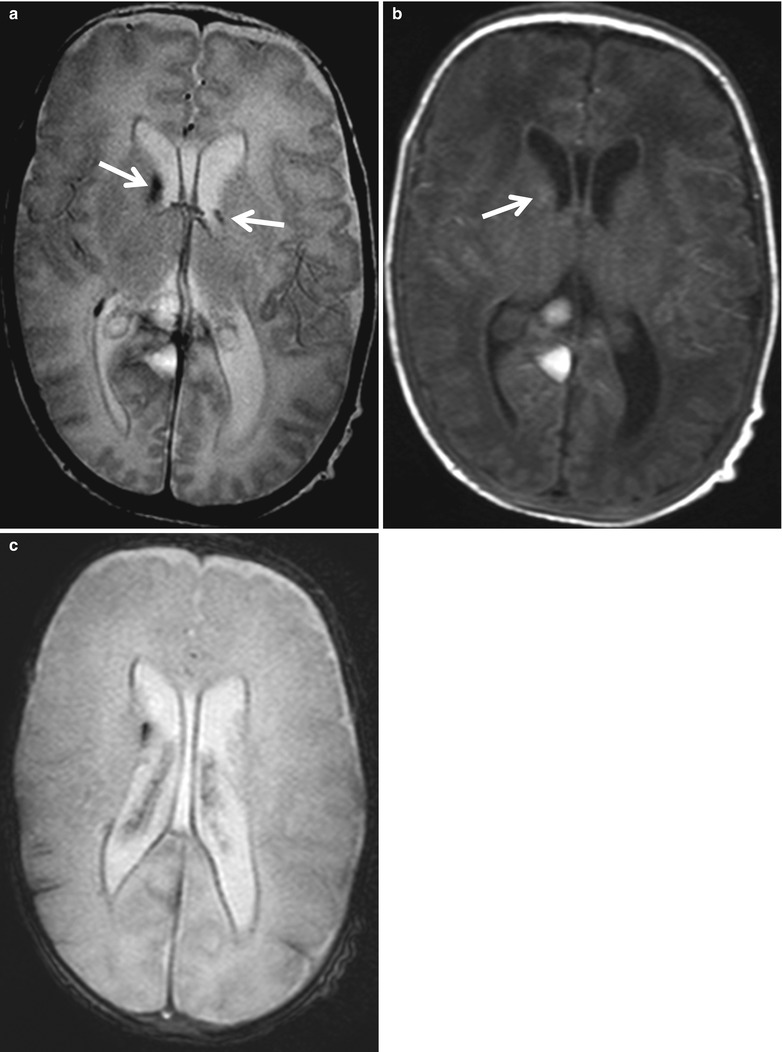
Fig. 5.8
GMH-IVH in MR images. (a) GMH is seen as dark signal intensity on T2-weighted image. Dark signal intensity along the ventricular margin suggests hemorrhage. (b) On T1-weighted image, GMH is slightly hyperintense (arrow). (c) Gradient echo image more sensitively reveals hemorrhage as dark signal intensity
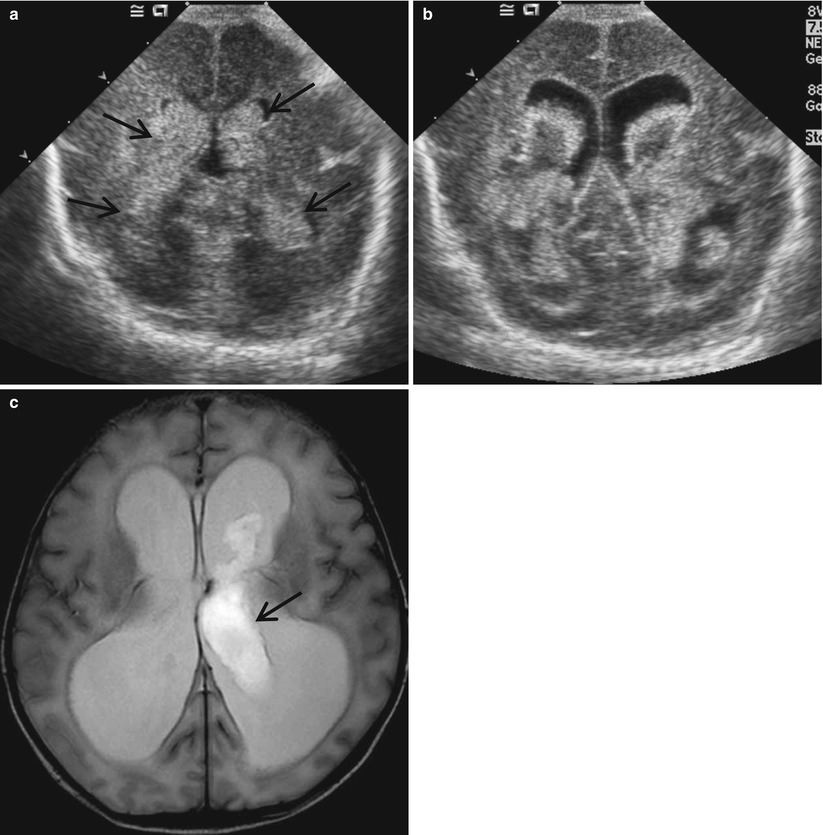
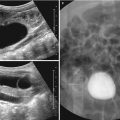
Fig. 5.9
Grade 3 IVH. (a) Coronal sonogram shows bilateral large echogenic hemorrhage casting the ventricles. The ventricles are slightly distended. (b) Follow-up US obtained 1 week later reveals further enlarged ventricles and central hypoechoic area within the hematoma suggesting liquefaction. (c) Axial T2-weighted image shows progression of the ventricular distension and residual intraventricular clot (arrow) as high signal intensity
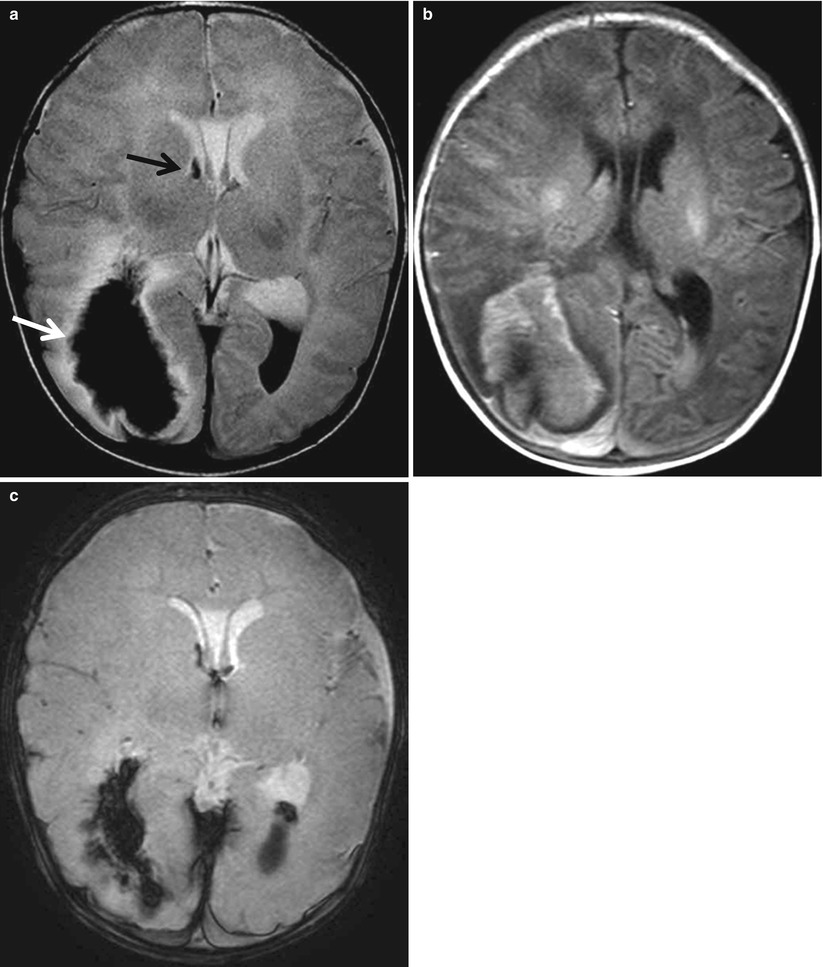
Fig. 5.10
Periventricular hemorrhagic infarct (PVHI). (a) T2-weighted image shows hypointense hemorrhage extending from the ventricle into the adjacent periventricular white matter (white arrow). The white matter surrounding the hemorrhage is hyperintense, and multiple streaky dark signal intensity lesions are extending from the white matter hemorrhage, suggesting medullary veins. There are GMH (black arrow) and IVH seen as dark signal intensity fluid level. (b) Hemorrhagic lesions are seen as high signal intensity on T1-weighted image, suggesting subacute hemorrhage. (c) Gradient echo image shows hemorrhage as dark signal intensity
5.4.1.6 Hypoxic Ischemic Brain Injury in Terms; Watershed Injury
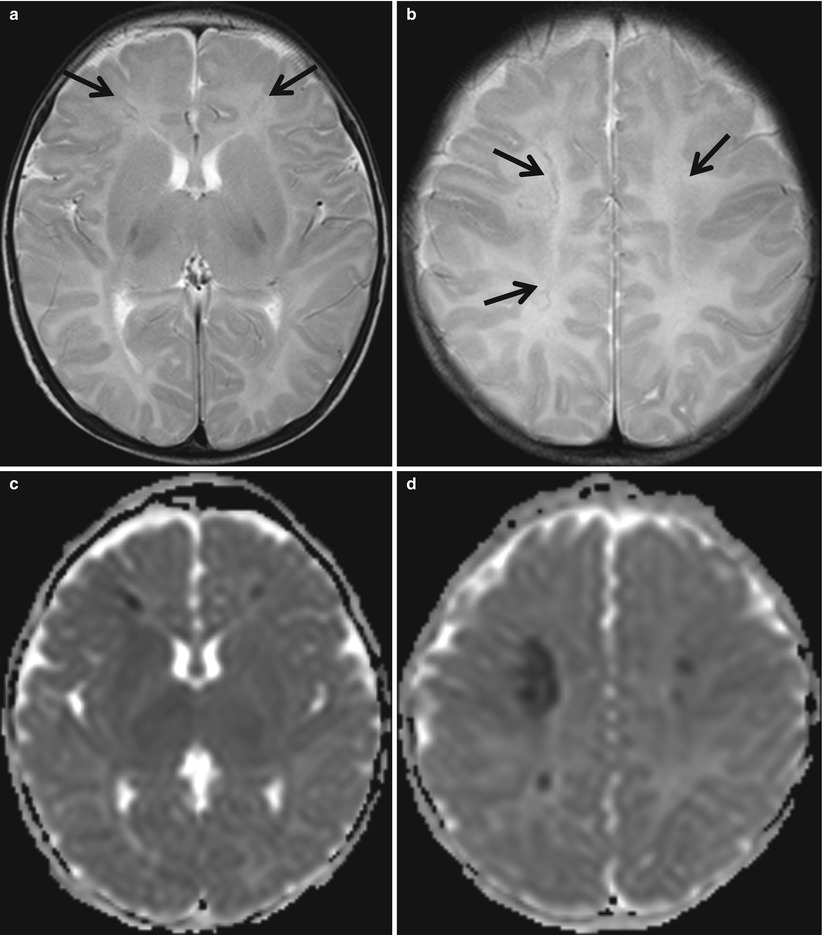
Fig. 5.11
Acute parasagittal injury in term neonate with complex heart disease. (a, b) T2-weighted axial images show subtle hypointense lesions at bilateral parasagittal areas (arrows). (c, d) ADC maps demonstrate corresponding diffusion restriction suggesting acute cytotoxic edema or hemorrhage
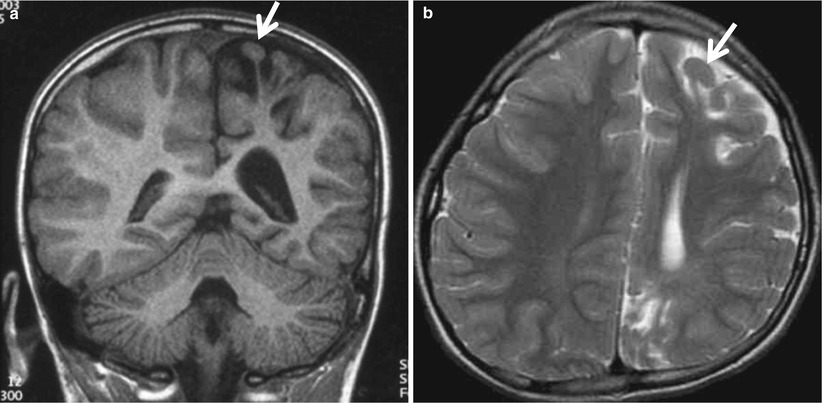
Fig. 5.12
Ulegyria in chronic watershed injury. T1-weighted coronal (a) and T2-weighted axial (b) images show more tissue loss at the depth of sulci than the superficial portion of the cortex resulting in mushroom-shaped gyri (arrow)
5.4.1.7 Hypoxic Ischemic Brain Injury in Terms; Profound Injury
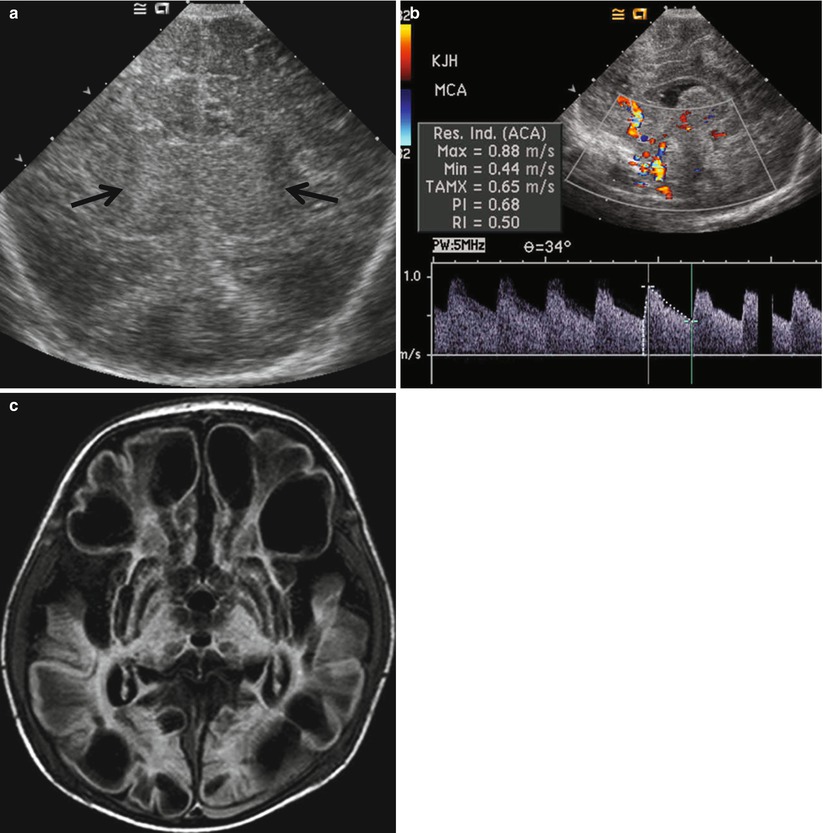
Fig. 5.13
Term neonate with birth asphyxia and meconium aspiration. (a) US shows diffuse swelling of the brain and increased echogenicity of the deep gray matter (arrows). (b) Doppler US demonstrates decreased RI (0.5) of the anterior cerebral artery in spite of the edematous brain, suggesting impaired cerebral vascular autoregulation and decreased vascular resistance and increased end-diastolic flow. (c) Follow-up FLAIR image reveals extensive encephalomalacia of the brain and bilateral subdural hemorrhage
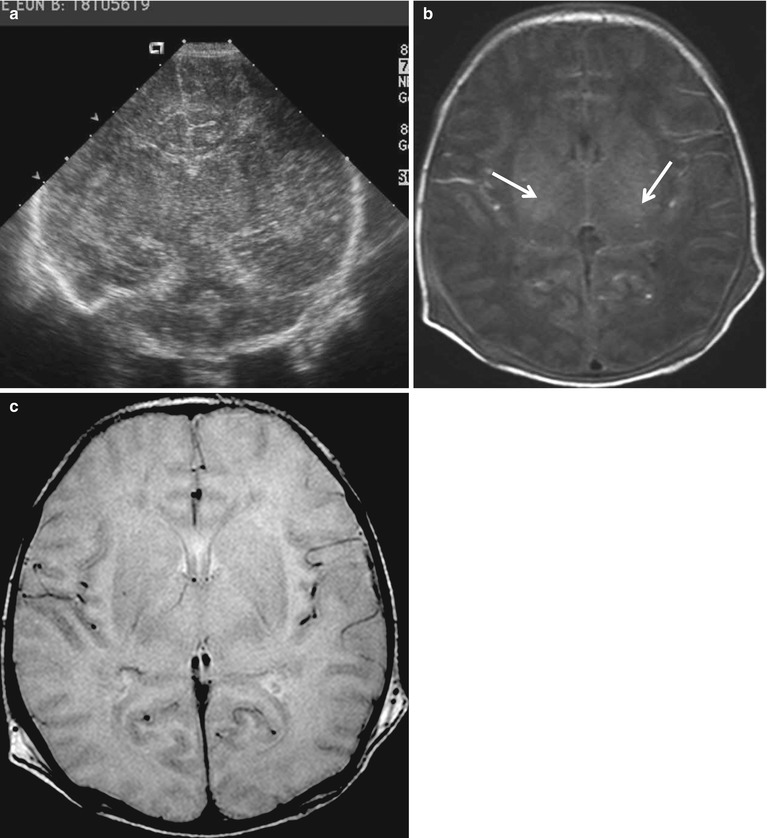
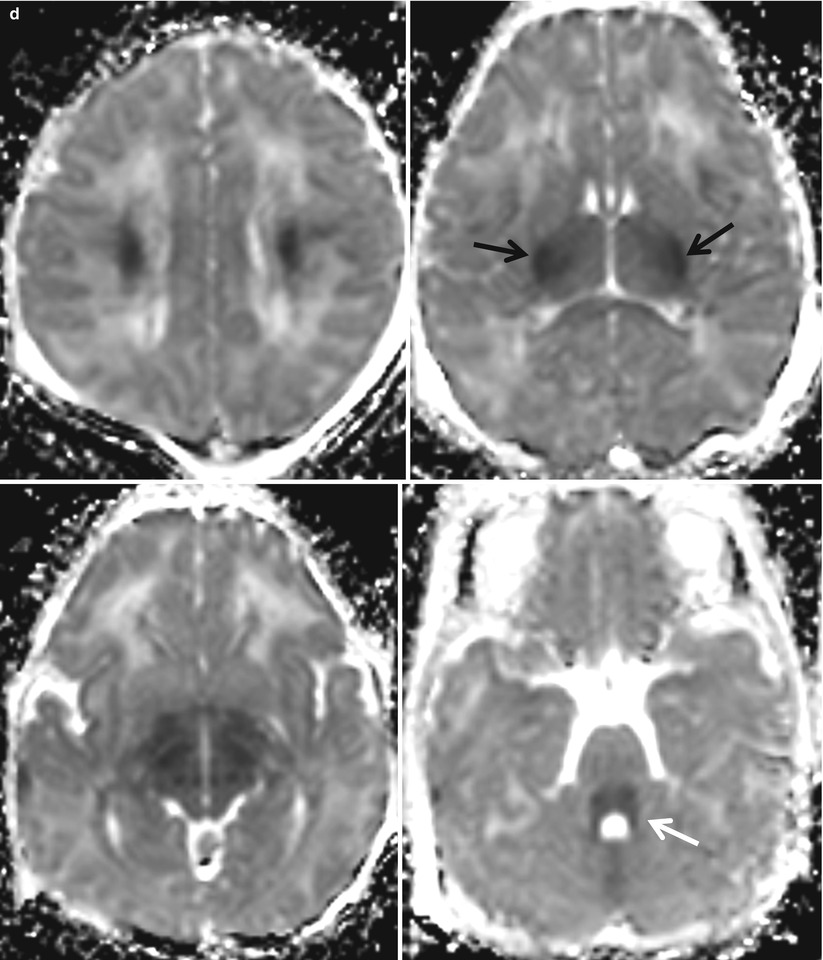
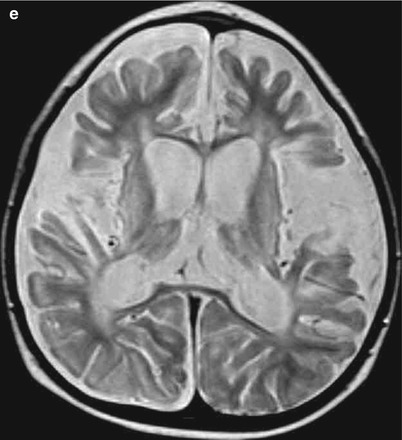
Fig. 5.14
Term neonate with meconium aspiration. (a) Sonography shows diffusely edematous brain and subtle echogenic thalami. (b, c) Normal posterior internal capsule myelin is absent on fast inversion recovery T1- and T2-weighted images (arrow), referred to as “absent posterior limb sign.” (d) Serial ADC maps demonstrate diffusion restriction in the centrum semiovale, posterior internal capsule (arrow) and lateral thalami, midbrain, and dorsal pons (white arrow). (e) T2-weighted image obtained 10 months later shows extensive encephalomalacia
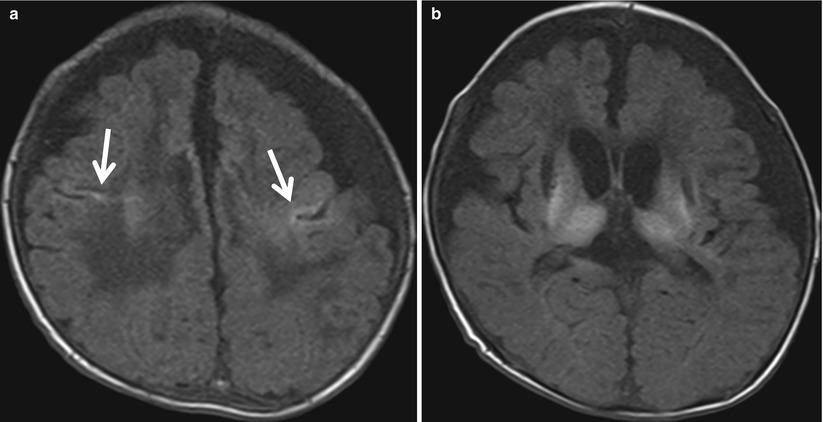
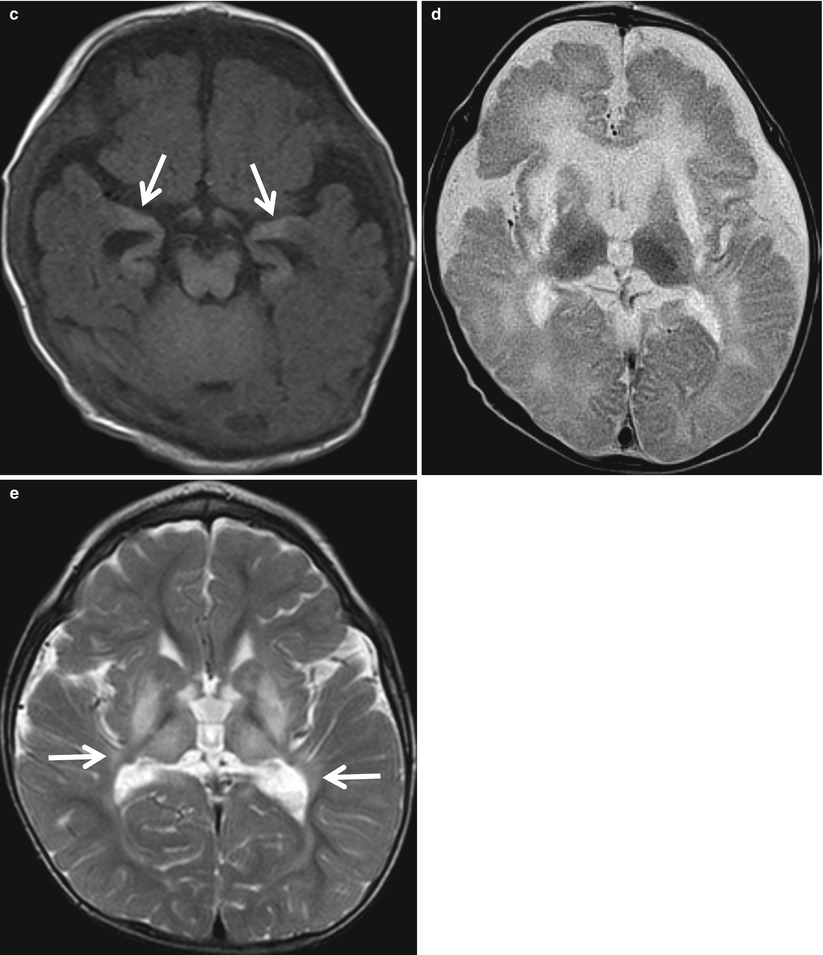
Fig. 5.15
Neonate born after 37 weeks of gestational period and placenta abruption. (a–c) Serial T1-weighted images demonstrate hyperintense lesions in the sensorimotor cortex (arrows in a), lateral thalami, basal ganglia, hippocampi (arrows in c), and brain stem, associated with volume loss. (d) Markedly decreased signal intensity in thalami and excessive high intensity in the white matter are noted on T2-weighted image. (e) Follow-up T2-weighted image obtained at 2 years of age reveals diminished volume of the basal ganglia and thalami, enlarged ventricles, and disturbed myelination of the deep white matter (arrow)
5.4.1.8 Hypoxic Ischemic Brain Injury; Normal Variant
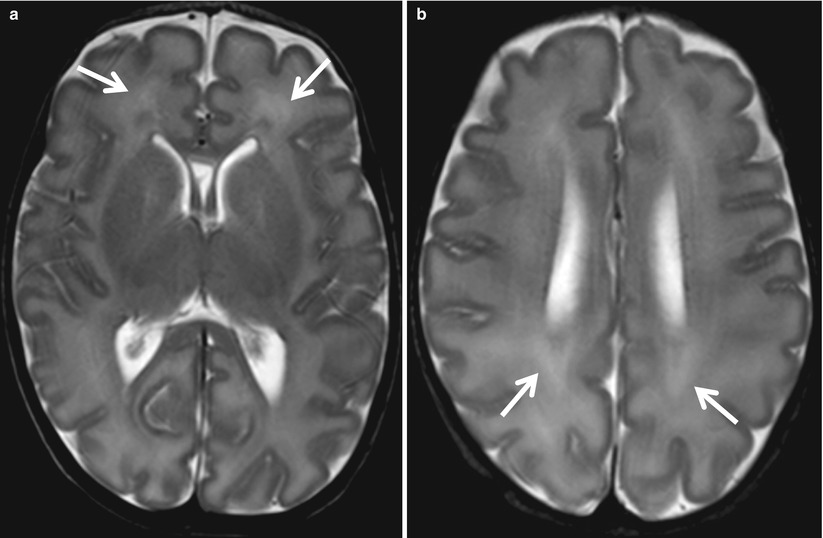
Fig. 5.16
Normal periventricular white matter in preterm baby at corrected gestational age of 35 weeks. (a) On T2-weighted image, developing white matter is seen as high signal intensity areas (arrows) adjacent to the hypointense germinal layer. (b) This takes the form of arrowheads posteriorly (arrows)
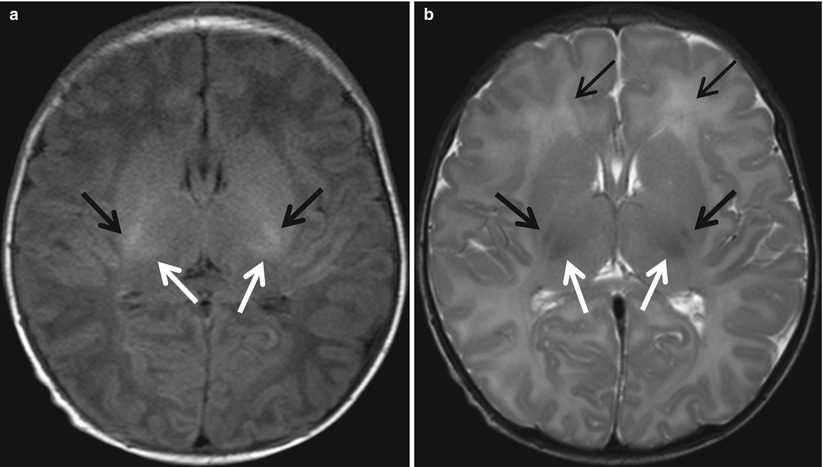
Fig. 5.17


MR images in a normal 4-day-old full-term neonate. (a, b) Axial T1-weighted image shows normally increased signal intensity of posterior limb of internal capsule (arrows) and ventrolateral nucleus of the thalami relative to basal ganglia and thalamus (white arrows). (b) The posterior limb of the internal capsule (arrows) and ventrolateral nucleus of the thalami (white arrows) are hypointense on T2-weighted image. Anterior cap (arrow) is faintly visualized anterior to the frontal horn
Related posts:
Stay updated, free articles. Join our Telegram channel
Full access? Get Clinical Tree
