This article focuses on advanced magnetic resonance (MR) imaging techniques and how they can be used to help diagnose a specific tumor, suggest tumor grade and prognosis, follow tumor progression, evaluate tumor extension, suggest the ideal site for biopsy, and assess therapeutic response. Advanced MR imaging techniques may also help to distinguish between lesions that simulate brain tumors on conventional MR imaging studies.
Key points
- •
High choline levels in the spectrum and high blood volumes in the perfusion study of the peritumoral region favors glioblastoma multiforme (GBM) rather than single brain metastasis with high specificity.
- •
Low apparent diffusion coefficient (ADC), along with low blood volumes and mild elevation of the permeability, favors lymphoma over GBM.
- •
Restricted diffusion and prominent choline peak, along with the presence of taurine in the spectrum favors medulloblastoma rather than ependymoma; on the other hand, a high myo-inositol (mI) peak in the spectrum along with high blood volume and low percentage of signal intensity recovery of the time-intensity curve favors ependymoma.
- •
High-grade gliomas typically present with high choline in the spectrum, high blood volumes, and high permeability. High ADC measurements, discrete or no elevation of the choline peak along with high mI peak, low blood volumes, and no or low elevation of the permeability characterize low-grade (grade II) gliomas. Beware: high blood volumes may be seen in low-grade gliomas, usually in oligodendrogliomas.
- •
ADC, cerebral blood volume (CBV) and multivoxel 1 H magnetic resonance spectroscopy (MV-MRS) may better indicate the ideal site for biopsy in an infiltrative tumor than a conventional magnetic resonance (cMR) imaging study.
- •
Tumor extension is better estimated by perfusion study and MV-MRS than cMR imaging.
- •
Elevated ADC and low choline levels along with high lipids, low blood volumes and, probably, lower permeability characterize favorable tumor response to therapy. Beware: elevated choline levels may be seen in radiation necrosis.
Introduction
In addition to conventional magnetic resonance (MR) imaging techniques, advanced techniques including diffusion-weighted (DW) imaging, proton nuclear magnetic resonance spectroscopy ( 1 H-MRS), perfusion-weighted (PW) imaging, and dynamic contrast-enhanced (DCE) imaging studies can provide information beyond mere anatomy and have been commonly used in clinical practice. Maps of apparent diffusion coefficient (ADC), fractional anisotropy (FA), and relative cerebral blood volume (rCBV), as well as the metabolic abnormalities in the spectrum and the permeability maps and curves generated by advanced imaging techniques, may enable the radiologist to identify tumor tissue, differentiate tumor types, grade tumors, evaluate tumor extent, guide stereotactic biopsy, and determine early response to treatment.
Diffusion-Weighted Imaging
DW imaging has been used to grade brain tumors on the basis of cellularity.
Low ADC values have been correlated with increasing cellularity, increasing grade, and increasing Ki-67 cellular proliferation index in cerebral gliomas.
Fractional Anisotropy
FA represents the magnitude and directionality of water diffusion. FA measurements may help distinguish glioblastoma multiforme (GBM) from solitary brain metastases.
1 H Magnetic Resonance Spectroscopy
1 H-MRS is a noninvasive, in vivo technique that provides additional metabolic diagnostic indices beyond anatomic information, which has been extensively used to evaluate brain tumors. High choline (Cho) and lipids (Lip), along with low N -acetylaspartate (NAA) peaks, are related to tumor aggressiveness.
Dynamic Susceptibility Contrast (Perfusion) MR Imaging
rCBV maps can be generated from dynamic susceptibility contrast (DSC) T2* gradient-echo–echo-planar sequence (GE-EPI), acquired during the first pass of the standard dose of a gadolinium-based contrast agent. Tumor blood volume (TBV) values can be measured from the rCBV map, and TBV has been correlated with tumor grade and vascularity, with higher TBV associated with gliomas of higher grade.
Dynamic Contrast-Enhanced (Permeability) MR Imaging
DCE studies allow estimation of brain tumor permeability, and have been used more recently in the characterization of brain tumors. While pharmacokinetic modeling and determination of metrics such as volume transfer constant (K trans ), volume of the extravascular-extracellular space (Ve e ), and blood plasma volume (Vp) have been commonly used in the literature, one of the authors (L.A.B.) has had extensive experience in subjective analysis of dynamic changes in signal enhancement using the Maximum Slope of Increase algorithm with the aid of GE Functool (GE Healthcare, Waukesha, WI). Such changes are likely correlated with microvascular permeability, and the content referred to as “permeability” herein is reflective of that experience, unless otherwise noted.
Main clinical applications
Determination of Tumor Type
On contrast-enhanced T1-weighted images (CE-T1WI), high-grade gliomas (HGGs), lymphomas, and metastasis show enhancement, which are sometimes difficult to specify using conventional MR (cMR) images.
The information obtained from advanced MR imaging techniques may help indicate a specific diagnosis.
GBM versus solitary metastasis
It is clinically important to differentiate GBM from a solitary brain metastasis because medical staging, surgical planning, and therapeutic decisions are vastly different for each tumor type.
On conventional MR images, HGGs and solitary metastatic brain tumors often display similar signal-intensity characteristics and contrast-enhancement patterns. Advanced MR imaging techniques may help in differentiating solitary brain metastasis from high-grade glial tumors such as GBM.
Peritumoral ADC
GBMs and metastatic tumors often contain heterogeneous signal intensity secondary to necrosis and susceptibility artifacts. As a result of this heterogeneity, DW imaging metrics obtained from the tumor can be imprecise or inaccurate. Lee and colleagues demonstrated that tumoral ADC showed no statistically significant difference between the two groups (GBM and metastasis). On the other hand, the mean minimum ADC value in the peritumoral region of GBMs (1.149 ± 0.119 [standard deviation]) was significantly lower than that in metastases (1.413 ± 0.147) ( P <.05). The mean peritumoral ADC ratio (minimum ADC in the peritumoral edema of the affected hemisphere divided by that from the normal white matter in the contralateral hemisphere) was also significantly lower in GBMs (1.466 ± 0.24) than in metastases (1.829 ± 0.25) ( P <.05). These results support the hypothesis that minimum ADC values can detect neoplastic cell infiltration in peritumoral edema in patients with GBM, distinguishing these tumors from solitary brain metastasis.
Differentiation of vasogenic edema from infiltrative edema has been attempted using DW imaging, based on the premise that water diffusivity is facilitated to a greater degree in vasogenic edema surrounding brain metastasis than in infiltrative edema surrounding GBMs, because of a lack of intervening tumor cells in the former. However, the authors believe that ADC measurements in the peritumoral areas of GBM and metastasis cannot be used to distinguish between these lesions, as a large overlap is often demonstrated. This finding is in agreement with previous studies, which have shown that peritumoral ADC is not useful for distinguishing between GBMs and metastatic tumors.
Peritumoral diffusion tensor imaging metrics
Areas of extensive edema on T2-weighted imaging surround both GBMs and metastatic tumors. In metastatic tumors, this peritumoral edema is assumed to be composed of pure water, whereas for GBMs the edema is assumed to contain tumor cells that have infiltrated into the tissue.
Diffusion tensor (DT) imaging is an advanced MR technique that describes the movement of water molecules by using 2 metrics, mean diffusivity (MD) and FA, which represent the magnitude and directionality of water diffusion, respectively. DT imaging may be able to detect changes in the white matter surrounding malignant gliomas that are not visible on cMR imaging. In a study by Lu and colleagues the peritumoral MD of metastatic lesions was significantly greater (average 0.798 ± 0.109) than that of gliomas (average 0.622 ± 0.111) ( P <.005). The average FA was 0.181 ± 0.049 around metastatic lesions, whereas the average FA around HGGs was 0.248 ± 0.063.
Although peritumoral MD could be used to distinguish HGGs from metastatic tumors, peritumoral FA demonstrated no statistically significant difference.
1 H-MRS
To differentiate a solitary brain metastasis from GBM, the voxel should be placed in the peritumoral area. No evidence of tumor infiltration is demonstrated in the peritumoral vasogenic edema surrounding a metastatic brain lesion. No elevation of the Cho, Cho/creatine (Cho/Cr), and Cho/NAA ratios will be demonstrated in the spectrum ( Fig. 1 A, B ). On the other hand, evidence of tumor infiltration outside the tumor nodule may be demonstrated in the peritumoral area surrounding a GBM (see Fig. 1 C, D).
Beware that high Cho peak, Cho/Cr ratio, and Cho/NAA ratio in the peritumoral region surrounding a GBM may not be demonstrated in the spectrum, as these changes are related to the number of tumor cells that have infiltrated the peritumoral area ( Fig. 2 ). If no elevation of the Cho peak is seen in the peritumoral area, a high-grade primary tumor cannot be ruled out.
Dynamic susceptibility contrast MR imaging
Tumoral CBV
In a retrospective study of 83 tumors, spin-echo echo-planar images (SE-EPI)–derived rCBV maps allowed reliable distinction of brain metastasis from HGGs and were superior to percentage recovery analysis for distinguishing brain metastasis from HGG. In this study, the average normalized CBV (nCBV) obtained from the maximum rCBV within the tumor divided by the rCBV of an equivalent region of interest (ROI) in the contralateral normal-appearing white matter was 1.53 ± 0.79 (0.59–4.05) within HGG compared with 0.82 ± 0.40 for brain metastasis (0.48–2.12), and differences between nCBV averages and ranges for the two groups were significant ( P <.05).
The optimal threshold occurred at 1.0, where sensitivity and specificity for detection of brain metastasis were 88% and 72%, respectively. Therefore if the tumoral CBV is less than the CBV measured in the contralateral normal white matter, metastasis should be suggested instead of a HGG.
Peritumoral CBV
When a focal brain lesion presents with high blood volume, GBM and metastasis should be both considered in the differential diagnosis. In metastatic brain lesions, the area with high blood volume will correspond exactly to the tumoral-enhancing nodule. On the other hand, GBMs tend to have angiogenesis beyond the contrast-enhancing portion of the tumor, so that high blood volume may be demonstrated outside the tumor nodule ( Fig. 3 ).
In a study of 75 brain tumors, peritumoral CBV values (rCBVp) were more effective than tumoral rCBV (rCBVt) in differentiation of metastasis from both LGG and HGG. rCBVp cutoff values of 1.1 and 1.2 were used for the differentiation.
Percentage of signal-intensity recovery (curve analysis)
Percentage recovery analysis of time-intensity curves from GE-EPI DSC PW imaging has been proposed to distinguish GBMs from metastasis by assessing the profound difference in capillary permeability between the 2 tumor types with increased capillary permeability in brain metastasis.
The percentage of signal-intensity recovery (PSR) is a hemodynamic variable derived from DSC perfusion MR imaging that provides additional information on tumor vasculature. PSR is defined as the percentage of signal-intensity recovery relative to the precontrast baseline at the end of the first pass, and is influenced by the amount of contrast agent leaked during the first pass, thus reflecting alteration in capillary permeability.
Cha and colleagues demonstrated that both the minimum and average percentages of signal-intensity recovery were significantly greater for patients with GBM compared with the values for patients with metastasis ( P <.05). When the average PSR in the contrast-enhancing lesion was more than 82% and less than 66%, the prediction of GBM and single brain metastasis, respectively, had specificity of 100% ( Fig. 4 ).
Beware: Some GBMs with significant disruption of the blood-brain barrier (BBB) will demonstrate a very low PSR of the time-intensity curve, resembling metastasis ( Fig. 5 ).
Dynamic contrast-enhanced MR imaging
Permeability is typically high in aggressive tumors such as metastasis and GBM, owing to significant disruption of the BBB. There is greater permeability in metastasis than in GBM because metastases have no BBB, whereas GBMs have a “damaged” BBB.
GBM versus lymphoma
Despite some characteristic conventional MR imaging findings, it may be difficult or even impossible to distinguish cerebral lymphomas from GBM.
Accurate preoperative differentiation between these 2 tumors is important for appropriate treatment.
GBMs are usually treated with surgical resection plus radiation therapy and chemotherapy, whereas lymphoma is not treated with surgery.
ADC and FA
Lymphomas demonstrate low ADC values ( Fig. 6 A–C ), a finding consistent with restricted water diffusion related to high tumor-cell density. By contrast, HGGs are relatively hyperintense to gray matter on both trace DW imaging and ADC maps ( Fig. 7 B ), findings consistent with elevated diffusivity. Prior studies have shown statistically significant differences in ADC between the cerebral lymphoma and GBM. However, GBMs with restricted water diffusion have also been reported. Therefore, discrimination of lymphoma from some GBMs may be difficult.
A study by Toh and colleagues demonstrated that the FA and ADC of lymphomas were significantly lower than those of GBMs. Cutoff values to differentiate lymphomas from GBM were 0.192 for FA, 0.33 for FA ratio, 0.818 for ADC, and 1.06 for ADC ratio. Accuracy of 100% was reached in the distinction between lymphoma and GBM using a cutoff value of 1.06 for the ADC ratio (see Fig. 6 C).
The specificity and accuracy of ADC were higher than those of FA in differentiating the two.
ADC measurements are also useful in the distinction between lymphoma and GBM infiltrating the corpus callosum.
1 H-MRS
When lipids are demonstrated in a solid-appearing tumor, lymphoma should be considered (see Fig. 6 D, E).
Lipids are also typically seen in the spectrum of the GBM (see Fig. 7 C), related to the presence of necrosis.
DSC and DCE MR imaging
CBV and cerebral blood flow are much lower in lymphomas than in GBMs.
Angiogenesis is not a prominent finding in lymphomas, so perfusion may not be elevated (see Fig. 6 F).
In the authors’ experience, despite being an aggressive tumor, lymphomas may present with minimal or mild elevation of the permeability (see Fig. 6 G). On the other hand, high blood volumes and significantly high permeability are typically demonstrated in high-grade glial tumors such as GBM (see Fig. 7 D, E).
Gliomatosis cerebri versus lymphomatosis cerebri
Intracranial gliomas may present as infiltrative lesions known as gliomatosis cerebri. These tumors usually infiltrate at least 2 or 3 lobes, sometimes in a bilateral and fairly symmetric fashion, usually with no or minimum mass effect.
Lymphomas may also present as infiltrative tumors known as lymphomatosis cerebri. This rare presentation of intracranial primary lymphomas may resemble gliomatosis cerebri on cMR imaging. Discrete or no enhancement is demonstrated in both tumors.
ADC measurements are not helpful in the differentiation of these lesions. Restricted diffusion, typically seen in lymphomas, is mild or absent in lymphomatosis cerebri.
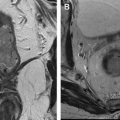
1 H-MRS may be helpful, and a high mI peak has been described as the most characteristic spectral finding in gliomatosis grade II, especially if the Cho peak is not elevated ( Fig. 8 A, B ). On the other hand, lymphomatosis cerebri is characterized by reduction of the NAA and mI peaks, along with elevation of the Cho and lipid peaks (see Fig. 8 C, D).
Medulloblastoma versus ependymoma
Medulloblastoma, a highly malignant neoplasm, is the most common neoplasm of the posterior fossa in children. The tumor usually arises at the midline within the vermis, and exhibits growth into the fourth ventricle.
Medulloblastomas and ependymomas may look very similar on cMR imaging. Accurate diagnosis is crucial, as treatment strategies and prognosis are different.
ADC
ADC values are significantly lower in medulloblastomas than in all other posterior fossa tumors ( P <.001) related to high cell density ( Fig. 9 A, B ).
Diffusion is not typically restricted in the classic ependymomas (see Fig. 9 C, D), but may be restricted in the anaplastic ones, making distinction between these tumors and medulloblastomas more difficult.
1 H-MRS
Medulloblastomas usually demonstrate a significant elevation of the Cho peak, Cho/Cr ratio, and Cho/NAA ratio in the spectrum, related to the high cell density and reflecting its malignant nature ( Fig. 10 A ). Majós and colleagues demonstrated that significantly elevated levels in the Cho peak could be used to distinguish primitive neuroectodermal tumors (PNET) from non-PNET tumors with a high degree of accuracy (94%).
Also, spectrum with a short echo time (TE) show a significantly elevated taurine concentration at 3.3 ppm in patients with medulloblastoma when compared with other tumors (see Fig. 10 A).
Ependymomas may show very high mI in spectrum obtained with short TE (30 milliseconds), allowing distinction between these tumors and medulloblastomas (see Fig. 10 B).
Dynamic susceptibility contrast MR imaging
In the authors’ experience, some medulloblastomas present with high blood volumes and others with low blood volumes.
Ependymomas generally demonstrate markedly elevated rCBV ( Fig. 11 A–C ) and, unlike many other glial neoplasms, a poor return to baseline that may be attributable to fenestrated blood vessels and an incomplete BBB (see Fig. 11 C).
Dynamic contrast-enhanced MR imaging
In the authors’ experience, some medulloblastomas have demonstrated no significant elevation of the permeability ( Fig. 12 A–C ).
Permeability in ependymomas is highly variable, with some ependymomas presenting with high permeability ( Fig. 13 A, B ) and some with no significant elevation of the permeability (see Fig. 13 C, D) (authors’ personal communication).
Hemangioblastoma versus pilocytic astrocytoma
Hemangioblastomas (HGBLs) are the most common primary brain tumors in the posterior fossa of adult patients. The lesion arises in the cerebellar parenchyma, and usually presents with cystic and solid components ( Fig. 14 ). HGBL may resemble a pilocytic astrocytoma (PA) on cMR imaging.
Flow voids consistent with prominent blood vessels may be demonstrated in the solid portion of HGBLs (see Fig. 14 A), suggesting the diagnosis.
ADC
ADC is typically elevated not only in the cysts but also in the solid portions of HGBLs, related to the large amount of capillaries in these tumors (see Fig. 14 B).
A PA has greater ADC values than do other cerebellar tumors such as ependymoma and medulloblastoma, and may look similar to an HGBL on diffusion study.
1 H-MRS
Elevation of the Cho peak in the spectrum of HGBLs is usually minimal, as these are low-grade tumors (see Fig. 14 C). Lipids may be seen, related to the presence of cysts. On the other hand, despite being a grade I tumor, PAs typically demonstrate a prominent Cho peak, along with reduction of the NAA and Cr peaks and the presence of lipids and lactate, simulating a HGG (see Fig. 14 D).
DSC and DCE MR imaging
High blood volume and high permeability may be demonstrated in PAs but, in the authors’ experience, never as high as in HGBLs. These neoplasms are truly vascular, and behave like vessels in the perfusion and permeability studies. Very high CBV and very high permeability, related to the presence of enlarged vessels, will be demonstrated in this grade I tumor (see Fig. 14 E–G).
Determination of Tumor Grade
Differentiation between high-grade and low-grade tumors is important for therapeutic planning. The contrast-enhancement pattern of a tumor on cMR imaging is not always reliable enough to obtain precise information about tumor angiogenesis at a capillary level, because tumoral enhancement is mainly due to disruption of the BBB rather than the tumoral vascular proliferation itself. Thirty-three percent of high-grade tumors do not enhance, and 20% of low-grade tumors enhance.
Advanced MR imaging techniques such as DW imaging, DT imaging, 1 H-MRS, PW imaging, and permeability may better estimate tumor grade than conventional MR imaging studies.
ADC
ADC measurements are related to tumor-cell density and tumor grade. Many studies have demonstrated an inverse relationship between ADC values and tumor grade, with lower ADCs found in higher-grade tumors ( Figs. 15 and 16 ) in comparison with lower-grade tumors ( Fig. 17 ).
Recent studies have shown that minimum ADCs may facilitate accurate grading of astrocytic tumors, because regions exhibiting the minimum ADC correspond to the highest-grade glioma foci within heterogeneous tumors.
Beware: restricted diffusion may be seen in PA, a grade I tumor ( Fig. 18 ).
1 H-MRS
1 H-MRS may indicate tumor grade with more accuracy when compared with a blind biopsy, because it assesses a larger amount of tissue than is usually excised at biopsy.
Tumors are commonly heterogeneous, and their spectrum may vary depending on the region sampled by 1 H-MRS. Hence, the ROI chosen for analysis will have a large influence on the results, and multivoxel (MV) spectroscopy is generally considered preferable because it allows metabolic heterogeneity to be evaluated. 1 H-MRS is considered 96% accurate in differentiating LGGs from HGGs.
There is a high correlation between in vivo concentration of Cho in brain tumors and in vitro tumor proliferation markers. Compared with low-grade gliomas (LGGs) (see Fig. 17 C, D), statistically significantly higher Cho/Cr, Cho/NAA, and rCBV have been reported in HGGs (see Fig. 15 D, E). although threshold values of metabolite ratios for grading of gliomas are not well established. Cho/Cr is the most frequently used ratio for grading gliomas.
Although Cho is related to tumor-cell density and tumor grade, grade IV GBM usually presents with lower levels of Cho (see Fig. 16 C) than gliomas of grades III (see Fig. 15 D) and II (see Fig. 17 C). This discrepancy may be due to the presence of necrosis in GBMs, because necrosis is associated with a prominent lipid peak along with reduction of all other metabolites. Lipids may be the only spectral finding in a GBM.
Useful information on tumor grade may be acquired by using a short-TE (30–35 milliseconds) 1 H-MRS to assess mI. In low-grade tumors, the mI/Cr ratio is typically higher (see Fig. 17 C) than in high-grade tumors (see Fig. 15 D). According to Howe and colleagues, high mI is characteristic of grade II astrocytomas. Increased mI levels have been reported to be useful in identifying low-grade astrocytomas in which the Cho/Cr ratio is not altered.
In summary
Grade II gliomas
The 1 H-MRS spectrum in LGGs may look very similar to a normal spectrum, demonstrating a mild reduction of the NAA peak along with a mild elevation of the Cho peak.
An elevated mI peak may be the only finding in the spectrum of a grade II astrocytoma (see Fig. 17 C).
No lipids or lactate are usually demonstrated in the spectrum of a grade II glioma.
Grade III gliomas
In grade III gliomas there is a significant elevation of the Cho peak, which correlates well with the high cell density in these tumors. NAA, Cr, and mI peaks are reduced (see Fig. 15 D). If the lesion does not exhibit mobile lipid signals, anaplastic glioma is more likely than GBM. In the authors’ experience, however, some elevation of lipids and lactate may be seen in grade III gliomas.
Grade IV gliomas
The spectral pattern of these tumors is characterized by severe reduction of the NAA, Cr, and mI peaks. Cho is elevated, although not as much as in a grade III glioma, because prominent necrosis is usually present in grade IV gliomas. Marked necrosis will result in a prominent lipid peak (see Fig. 16 C). Typically the higher levels of Cho occur in grade III gliomas, whereas in GBM the Cho levels may be much lower because of necrosis. In fact, when the voxel is placed within the necrotic area of a GBM, no Cho will be detected and a prominent lipid-lactate peak will be the only spectral abnormality (see Fig. 16 C).
Key points to remember
- 1.
PAs usually present with a significant elevation of the Cho peak. Some lipids and lactate are also usually seen in these tumors (see Fig. 18 C).
- 2.
Some overlap between grades II and III gliomas may be seen in the spectrum ( Fig. 19 ).
Fig. 19
Overlap in the spectrum between grades II and III gliomas. ( A ) MRS from a left frontal grade II glioma in a 50-year-old man demonstrates a Cho/Cr ratio of 1.58 and mI/Cr ratio of 0.76. ( B ) MRS from a left frontal grade III glioma in a 27-year-old man with similar abnormalities: the Cho/Cr ratio is 1.55, a little less than in the grade II glioma ( A ), and the mI/Cr ratio is about the same (0.75 × 0.76). MRS cannot be used in isolation to differentiate grade II and III gliomas.
- 3.
Some aggressive tumors, such as metastases and GBM, may present with no elevation of the Cho peak (see Fig. 16 C).
- 4.
Cho peak and the Cho/Cr and Cho/NAA ratios may be higher in grade III (see Fig. 15 D) than in grade IV gliomas (see Fig. 16 C).
- 5.
Lipids do not necessarily represent necrosis. Lipids may be related to the presence of cysts in grade III gliomas ( Fig. 20 ).
Fig. 20
Grade III glioma misdiagnosed as grade IV glioma. A 24-year-old man presenting with seizures. There is a right frontoparietal infiltrating tumor, with high signal intensity on the T2 ( A ) and peripheral enhancement ( B ), and a central area that does not enhance, which could represent cystic component or necrosis. There is significant elevation of the Cho peak in the spectrum ( C ), along with a prominent lipid peak. Based on the conventional MR imaging and 1 H-MRS studies, a diagnosis of GBM was suggested. However, the final diagnosis was a grade III anaplastic glioma. The nonenhancing area corresponded to cyst formation. High lipids do not necessarily mean necrosis.
DSC MR imaging
The rCBV, the most robust and standard hemodynamic variable derived from DSC perfusion MR imaging, has been shown to correlate with grading of pure astrocytomas.
CBV is a marker of angiogenesis, tumor grade, and survival. CBV is related not only to vascular density but also to tumor-cell density.
Law and colleagues have demonstrated that rCBV is better related to tumor biology than Cho/Cr and Cho/NAA ratios.
Tumor rCBV obtained with GE-EPI is significantly higher than that obtained with the SE-EPI technique in the HGGs. This is probably related to the higher sensitivity of the GE-EPI technique to large vessels, which can be clearly observed in the HGGs. The findings suggest that the GE-EPI technique is more useful for detecting low-versus high-grade gliomas than is the SE-EPI technique. However, SE-EPI may have a better performance than the GE-EPI technique in areas of greater susceptibility, such as close to the bone and surgical cavities.
Permeability can confound rCBV measurements, and correction for T1 and T2/T2* effects should be done before interpreting the results from the perfusion study.
Many different techniques have been advocated, although no standardized methods exist. This ambiguity can result in a wide range of values in the literature, and makes comparison of studies problematic.
Perfusion studies can also be done without gadolinium-based contrast agent (GBCA) injection using the arterial spin-labeling (ASL) technique. The results from this technique are related to the percentage of blood vessels and tumor cellularity, and may be useful in distinguishing between high-grade and LGGs. ASL currently can provide measurements of cerebral blood flow, and absolute quantification is more easily performed in ASL than in DSC MR imaging.
Using the SE-EPI technique, Lev and colleagues found that if the tumoral rCBV was more than 1.5 times the rCBV in the contralateral white matter, a HGG could be suggested with 100% sensitivity and 69% specificity. According to this study, none of the HGGs presented with low CBV. On the other hand, using the GE-EPI sequence, Law and colleagues demonstrated that if the measured rCBV in the tumor lesion was more than 1.75 times the rCBV in the contralateral white matter, a HGG could be suggested with 95% sensitivity and 57.5% specificity.
HGGs are characterized by high rCBV (see Figs. 15 E and 16 E; Fig. 21 A, B). However, a high proportion of LGGs can demonstrate foci of high rCBV ( Fig. 22 ).
It is important to remember that both low-grade and high-grade oligodendrogliomas may present with high blood volume in the perfusion study, because of their unique “chicken-wire” vascularity. Low-grade oligodendrogliomas with high blood volumes tend to respond better to chemotherapy with procarbazine and vincristine.
Recently, susceptibility-weighted (SW) imaging has been described as a useful tool for the grading of noninvasive glioma. High rCBV values on perfusion imaging in tumors go hand in hand with evidence of blood products detected within the tumor matrix on SW imaging.
Beware: pilocytic astrocytomas may present with high blood volumes.
DCE MR imaging
Like PW MR imaging, permeability MR imaging, also known as DCE MR imaging, is performed through the use of GBCAs. However, it often uses more complex pharmacokinetic models (PKMs) than in PW imaging, and incorporates several assumptions that may potentially result in errors. It is insensitive to magnetic susceptibility and thus has a better performance than perfusion studies in the evaluation of lesions close to the skull base and close to the surgical cavity. The techniques utilized often result in conflicting demands on high temporal resolution, high signal to noise ratio, high spatial resolution, and wide anatomic coverage.
Permeability allows estimation of the BBB integrity through calculation of microvascular permeability. The volume-transfer constant between the capillary plasma space and the extravascular-extracellular space (EES), K trans , is the most widely used microvascular permeability metric. It is a potentially intractable combination of flow, permeability, and surface area. Despite the most rapid imaging techniques, it may not be possible to differentiate the contribution of each factor in the resultant K trans and, thus, its physiologic meaning can differ. Furthermore, variations in the DCE technique can also make a comparison of literature values of K trans difficult.
K trans of the brain parenchyma is insignificant, and consistent with noise.
K trans and CBV measure different vascular parameters, so areas of high CBV do not necessarily correspond to areas of high permeability. Strong relationships have been demonstrated between both rCBV and K trans and histologic grade in gliomas; however, the relationship appears to be stronger with rCBV.
More simple methods analysis that do not use PKM, such as qualitative or semiquantitative analysis of signal intensity–time curves, though physiologically less specific, can be beneficial. The GE Functool maximum (max) slope of increase is likely correlated with permeability, and subjective dynamic curve analysis can be beneficial.
Grade II gliomas
Grade II gliomas typically present with no significant elevation of permeability (see Fig. 17 E).
Grade III gliomas
Permeability is variable in grade III gliomas, with some presenting with no significant elevation of the permeability (see Fig. 15 F, G) and others with high permeability (see Fig. 21 C, D). Overlap may be seen between grades III and II gliomas in the permeability study.
Grade IV gliomas
According to Cha and colleagues, distinction between grade IV gliomas and gliomas of lower grade was only possible using the K trans and not the CBV measurements. K trans was much higher in GBM (see Fig. 16 F, G) than in lower-grade tumors, and was more predictive of tumor grade than the CBV derived from the perfusion study. Permeability may better distinguish between grades III and IV gliomas than the perfusion study.
A recent study using individual arterial input functions and 5 flip-angle T1 mapping at 1.5 T found that K trans was not only able to distinguish LGGs (grade I and II) from HGGs (grade III and IV) but also grade II from grade III. Nguyen and colleagues used a phase-derived vascular input function (VIP) with the bookend T1 measurement to show that both K trans and plasma volume (Vp) derived from DCE MR imaging could differentiate LGGs from HGGs. Adoption of a phase-derived VIP may be helpful because changes in the concentration of GBCA are known to vary in a linear fashion with phase changes in vessels that are more or less parallel to the magnetic field. This finding is significant because the relationship between MR signal intensity and gadolinium-based contrast agent may not always be linear, and could be complicated by inflow.
Special situations
- 1.
Pilocytic astrocytoma may present with high permeability despite being a grade I tumor
- 2.
Steroids and antiangiogenic therapy may reduce the measured K trans
The effects of steroid therapy are predicted to reduce the measured K trans , and reduce or abolish the strength of the relationship between K trans and grade.
Antiangiogenic therapy such as bevacizumab (Avastin) dramatically reduces BBB permeability, and no elevation of the permeability may be seen even if an aggressive tumor is present; this is known as pseudoresponse (see for more detail the article elsewhere in this issue on posttreatment evaluation of central nervous system gliomas).
Prediction of Prognosis and Survival
DW imaging, 1 H-MRS, and PW imaging yield structural and metabolic information that may provide better insight into tumor functionality and improve the prognostic stratification of brain tumors.
ADC measurements
Some studies have shown that the minimum ADC values of tumors have preoperative prognostic importance in patients with malignant supratentorial astrocytoma.
ADC values are also predictive of clinical outcome in primary central nervous system lymphoma.
Lymphomas with more restricted diffusion have higher cell density and have a worse prognosis, so these tumors deserve more aggressive treatment.
1 H-MRS
Majós and colleagues have demonstrated that a high-intensity value of the peaks at 0.98 and 1.25 ppm, attributed to lipids, correlates with tumoral necrosis and low survival in high-grade astrocytomas. These investigators also found that another region of the short TE spectrum, around 3.67 ppm, likely representing glucose, showed a direct correlation with patient survival. High metabolic activity and, consequently, poor prognosis correlate with depletion of glucose in the extracellular compartment and, accordingly, with low intensity of the resonances that represent this compound in the spectrum, centered at 3.67 ppm. The investigators concluded that 1 H-MRS could be used to stratify prognostic groups in HGGs and that this prognostic assessment could be made by evaluating the intensity values of 2 points on the spectrum at short TE (0.98 and 3.67 ppm) and another 2 at long TE (0.98 and 1.25 ppm). Although short-TE 1 H-MRS may be considered somewhat superior to long-TE 1 H-MRS for prognostic assessment of HGGs, spectrum at both TEs may provide relevant information.
Oh and colleagues found a significantly shorter median survival time for patients with a large volume of metabolic abnormality, measured by 1 H-MRS.
In grade IV gliomas, high relative volumes of regions with elevated Cho/NAA index were negatively associated with survival. Survival time was also negatively associated with high lactate and lipid levels and with low ADC within the enhancing volume.
DSC MR imaging
The predictive value of perfusion MR imaging for the prognosis of patients with glioma has been well documented. Lev and colleagues reported that in low-grade and HGGs, elevated rCBV was a stronger predictor of survival than the degree of enhancement.
According to Tzika and colleagues, the rCBV value was useful for distinguishing between progressive and stable tumors in pediatric patients with low-grade or high-grade glioma.
Low-grade astrocytomas
Law and colleagues suggested that rCBV measurements in LGGs better correlated with time to progression than the initial histopathologic grading of the tumor.
rCBV may be able to distinguish the stable from the rapidly progressing gliomas among patients with the same histopathologic grade (grade II gliomas). Grade II gliomas that present with high blood volume (see Fig. 22 B) will probably progress more rapidly than grade II gliomas that present with low blood volume (see Fig. 17 D). In patients with imaging features of low-grade tumors, high rCBV values suggest a need for a more aggressive approach, with biopsy and treatment and/or MR imaging at closer intervals.
High-grade astrocytomas
A long-term follow-up study of patients with high-grade astrocytoma showed that the maximum rCBV value on pretreatment MR imaging scans is useful as a clinical biomarker for predicting the survival of these patients. The presence of an intratumoral area with a high maximum rCBV value (≥2.3) may be predictive of a poor prognosis. The combined assessment of histopathologic and perfusion MR imaging findings obtained before the inception of treatment may be useful in determining optimal management strategies in patients with high-grade astrocytoma.
Anaplastic astrocytomas harboring components manifesting a high maximum rCBV may be associated with a poor prognosis and may require the same aggressive treatment as for GBM. Survival was significantly longer in GBM patients with low rather than high maximum rCBV values.
Determination of Tumor Progression
In patients diagnosed with LGGs, advanced MR imaging techniques may detect malignant transformation earlier than conventional imaging studies.
ADC
Low-grade tumors are typically characterized by relatively higher ADC values related to low cell density. During follow-up, foci of restricted diffusion related to high cellularity and malignant transformation may be demonstrated in these lesions ( Fig. 23 ). A calculated ADC ratio (tumoral ADC divided by the ADC in the contralateral white matter) of less than 1.0 is related to malignant transformation in LGGs.