Breast Imaging: Mammography
8.0 INTRODUCTION
Mammography is a radiographic examination that is optimized for detecting breast cancer. Breast cancer screening with mammography can catch cancers at an earlier, more treatable stage. Technological advances over the last several decades have greatly improved the diagnostic sensitivity of mammography (Fig. 8-1).
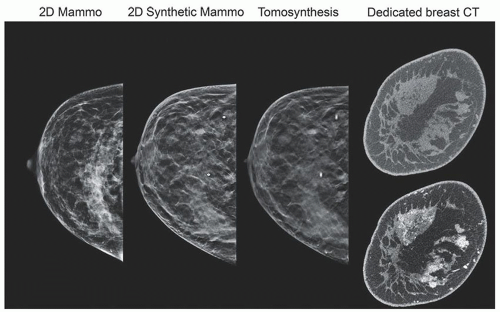 ▪ FIGURE 8-1 Improvements in mammography and breast x-ray imaging. On the left is a 2-dimensional (2D) full-field digital mammogram (acquired after tomosynthesis study). On the middle left is a 2D synthetic mammogram created from the digital breast tomosynthesis examination on the middle right; shown is a 1-mm focal plane image of approximately 60 images. On the right are reconstructed coronal slices of the breast (of about 500) positioned at the site of the lesions from pre and postcontrast injection acquisitions using a dedicated breast CT scanner. The contrast enhanced image (bottom) shows significant uptake in glandular tissues. |
Breast cancer screening programs depend on x-ray mammography as a low-cost, low-radiation dose procedure. Mammographic features include masses with irregular or “spiculated” margins, clusters of microcalcifications, and architectural distortions of breast structures.
Screening mammography: detection of breast cancer in asymptomatic population
2 views of each breast, in the mediolateral oblique and craniocaudal views
Diagnostic mammography: assess lesions identified by screening mammography
Includes additional x-ray projections, spot compression and magnification, tomosynthesis, ultrasound, MRI, breast CT, scintigraphy, PET/CT
X-ray attenuation between normal and cancer tissue is small, requiring low energy (Fig. 8-2)
Requirements: high contrast sensitivity, low-dose, high spatial resolution images
Implementation essentials: dedicated x-ray equipment (Fig. 8-3)
8.1 X-RAY TUBE COMPONENTS, STRUCTURES, AND OPERATION
1. Cathode: filament current and tube current are limited. Typical maximum tube current values: 100 to 125 mA for 0.3 mm (large focal spot); 15 to 30 mA for 0.1 mm (small focal spot).
2. Anode: target materials include molybdenum (Mo), rhodium (Rh), and tungsten (W).
a. Anode angle for 65 to 70 cm SID is approximately 22° (with tube tilt) for field coverage of 24 × 30 cm (Fig. 8-4)
b. Half field beam geometry—protects the lungs from radiation—central axis is tangent to the chest wall
c. Heel effect—optimal orientation of x-ray tube: cathode chest wall; anode over anterior (Fig. 8-5)

▪ FIGURE 8-2 A. Attenuation of breast tissues as a function of energy, showing fat, glandular, and ductal carcinoma linear attenuation coefficients. Comparison of three tissues shows a small difference between the glandular and the cancerous tissues. B. Calculated percentage contrast of the ductal carcinoma relative to the glandular tissue declines rapidly with energy; contrast is optimized using low energy, nearly monochromatic x-ray spectrum.

▪ FIGURE 8-3 A dedicated mammography system has unique attributes: k-edge filtration, collimation, and compression. Automatic Exposure Control (AEC) has a sensor for digital detectors and can be positioned by the user. Major components of a typical system are shown, excluding generator and user console.

▪ FIGURE 8-4 Half-field geometry projects the x-ray beam central axis at the chest wall. Full-area x-ray beam coverage requires a tube tilt of about 20° to 24° to avoid cutoff on the anode side of the field.
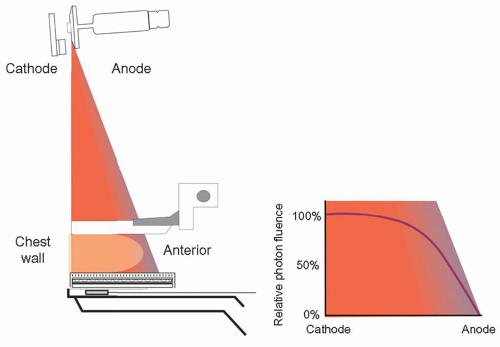
▪ FIGURE 8-5 X-ray tube orientation: cathode over the chest wall and anode over anterior side of the breast to compensate for the heel effect, a loss of x-ray fluence by anode self-filtration.
3. Focal Spot
a. Focal spot—0.3- and 0.1-mm spot size—for contact and magnification studies, respectively
b. Nominal size is measured at a reference axis, halfway between chest wall and anterior dimension of the large field area
c. Best resolution occurs on anterior side of the field per the line focus principle (Fig. 8-6A)
d. System resolution: combination of geometric blurring and detector sampling resolution
(i) Measurement: line-pair bar pattern consisting of frequencies from 4 to 20-lp/mm (Fig. 8-6B)
4. Target, Tube Port. Filtration, Beam Quality: generate x-rays; shape the x-ray photon spectrum.
a. Target; Mo, Rh, W.: Mo and Rh produce useful characteristic x-rays.
b. Tube Port: Beryllium (Z = 4; 0.5 to 1 mm) allows high transmission of all x-ray energies.
c. Tube filtration: Material and thickness remove low- and high-energy x-rays (Fig. 8-7).
d. Characteristic x-rays: Mo: 17 to 19 keV; Rh: 20 to 23 keV; W: 8 to 12 keV—L-x-rays are not useful.
e. Mo target filters used: 30 µm Mo; 25 µm Rh; for thin and thick breasts, respectively (Fig. 8-8)

▪ FIGURE 8-6 A. The actual focal spot size is determined by the electron distribution area incident on the anode. The nominal focal spot size is specified on a reference axis bisecting the field from the cathode to the anode, with 0.3- and 0.1-mm sizes typical. The projected focal spot length increases toward the chest wall and decreases toward the anterior side of the breast (the line focus principle). B. A resolution bar pattern measures overall system resolution, including detector sampling and geometric magnification. For contact mammography using a 0.3 mm focal spot with the pattern 6 cm above the detector plane (1.09× mag), a resolution of 9 lp/mm is resolved. For imaging using a 0.1-mm focal spot with the pattern 35 cm above the detector plane (2.0× mag), a resolution of 13 lp/mm is resolved. (Note: the bar pattern is at 45°, which improves the viewed resolution by up to 40% due to smaller “effective” sampling pitch of the detector array relative to the bar pattern.)

▪ FIGURE 8-7 A. The linear attenuation coefficients of Al, Mo, Rh, and Ag are plotted as a function of energy. B. An unfiltered Mo target spectrum generated at 30 kV (solid green line), and Mo filter attenuation as a function of energy (dashed green line). F. 8-8

▪ FIGURE 8-8 A. Bremsstrahlung spectrum from a Mo target/0.030-mm Mo filter for a 30-kV tube voltage, with characteristic peaks at 17.5 and 19.6 keV. B. Spectrum from a Mo target/0.025-mm Rh filter delivers higher energy x-rays up to K-edge of Rh. F. 8-9
f. Rh target filters: 25 µm Rh; 25 µm Ag for thicker breasts (Fig. 8-9)
g. W target filters: 50 µm Rh; 50 µm Ag; 500 to 700 µm Al. Thicker filters are required to eliminate unwanted L-x-rays in the spectrum (Fig. 8-10A); Al filter is used to achieve higher output rate with higher energy bremsstrahlung x-rays (Fig. 8-10B)
5. Half Value Layer: The half-value layer (HVL) of a mammography x-ray beam is the thickness in mm of sheets of pure Al required to reduce the x-ray beam air kerma by one-half.
a. HVL depends on kV, target material (Mo, Rh, W), filter material (Mo, Rh, Ag, Al), and filter thicknesses typically used—between 0.3 and 0.7 mm Al (Fig. 8-11).

▪ FIGURE 8-9 A. Spectrum from an Rh target and 0.025-mm Rh filter for a 30-kV tube voltage, with Rh characteristic x-rays at 20.2 and 22.7 keV. B. A combination of a Rh target and Mo filter is inappropriate as the resulting spectrum shows that Rh characteristic x-rays are strongly attenuated by the Mo filter at the energies of the Rh characteristic x-rays. F. 8-10

▪ FIGURE 8-10 A. An unfiltered W target spectrum generated at 30 kV with L-characteristic x-rays generated from 8 to 11.5 keV. On same energy scale is a dashed line for attenuation of an Rh filter. B. Filtered W-target x-ray spectra by Rh (0.05 mm), Ag (0.05 mm), and Al (0.7 mm) normalized to the same exposure output. F. 8-11
b. Minimum HVL > kV/100 for mammography (e.g., for 30 kV beam HVL>0.3 mm Al).
c. HVL of breast tissue depends on breast density and kV; typically ranges from 1 to 3 cm tissue thickness.
6. Tube output and output rate: Air kerma in mGy normalized to 100 mAs at a specified distance from the source (focal spot); 50 cm is used in this chapter.
a. Mo and W target output for various filters and thicknesses are shown as a function of kV (Fig. 8-12).

▪ FIGURE 8-11 The HVL (including Lexan compression paddle) versus kV: Mo targets with Mo and Rh filters, and W targets with Rh, Ag, and Al filters. HVLs are an average of several mammography systems at UC Davis Health. The solid lines represent a second-order polynomial fit to the data. F. 8-12

▪ FIGURE 8-12 Tube output (mGy/100 mAs at 50 cm distance from the source with compression paddle) for two clinical mammography units. A Mo target with 0.03-mm Mo and 0.025-mm Rh filter, and a W target with filter thicknesses of 0.05-mm Rh, 0.05-mm Ag, and 0.70-mm Al are plotted. F. 8-13
b. Calibrated output values: X mGy (per 100 mAs at 50 cm); entrance surface air kerma, Z mGy, to the breast for Y mAs at a source-to-breast surface distance, D includes inverse square law distance correction:

7. X-ray tube collimation-detector-light field alignment
a. Beam-limiting devices: chest wall edge of x-ray field extends to edge of receptor
(i) X-ray field/receptor congruence: to not exceed 2% of SID
b. X-ray field/light field congruence (Fig. 8-13)—misalignment (length or width) shall not exceed 2% of SID for anterior-posterior or left-right borders.
c. The chest wall edge of compression paddle: shall not extend beyond the chest wall edge of receptor by greater than 1% SID; vertical edge of compression paddle shall not be visible in the image.
d. Small breast imaging: left and right shift collimation accommodates MLO acquisitions to allow for positioning of the arm and shoulder at the corner of the detector (textbook Fig. 8-15).
 ▪ FIGURE 8-13 Light field to x-ray field and x-ray field to detector congruence and alignment evaluations. Left. Light field projected onto phosphor plate with coins placed at light field edges. Mid left. X-ray field phosphor image coin positions, indicating good congruence. Mid right. Acquired image to determine x-ray field to active detector congruence. Right. Compressed 40-mm attenuator thickness and coin placed at the edge of the compression paddle to evaluate paddle edge alignment and missed tissue at the chest wall in the acquired x-ray image.  F. 8-14 F. 8-14 |
8.2 X-RAY GENERATOR
1. Automatic Exposure Control (AEC): radiation sensors measure transmitted radiation
a. Densest part of the breast targeted to achieve appropriate SNR
b. AEC circuit assembly is detailed in Figure 8-14.

▪ FIGURE 8-14 Automatic Exposure Control (AEC) circuits use several selectable algorithms to determine the optimal exposure to the breast. The basic AEC operation uses the signal measured by the AEC sensor during the exposure in an operator positioned region that is transmitted to a comparator circuit to match a predetermined level that sends a signal to the generator to terminate the exposure. This is commonly known as “Auto-time.” F. 8-16
c. Sensors: for CR, under the detector; for flat-panel, generated by the detector electronics
(i) Manual positioning by the user from posterior to anterior
(ii) Automatic positioning (digital detector) at the highest attenuation in breast
d. Operation: charge accumulates, is amplified, and converted to voltage; compared to reference voltage; when equal, the exposure is terminated
2. AEC algorithms: use compressed breast thickness, kV, tube anode selection (if available), tube filter, and AEC settings on generator control panel as inputs to determine exposure
a. Fully automatic: 100 ms test exposure determines breast penetrability—determines kV, filtration, target (Mo and Rh anodes) to achieve an acceptable exposure time. Most often used in the clinic.
b. Automatic kV: 100 ms test exposure, with preset target and filter
c. Automatic exposure time: with preset target, filter, and kV
3. AEC (SNR) exposure selector: adjustment for increasing or decreasing reference voltage in steps of approximately 15%—“0” is baseline; 1 step increments of 1 step from, for example, -3 to +4 (vendor dependent)
4. Overexposure and backup timer—turns off x-ray exposure after predetermined time; protects from sensor failure, low kV, highly attenuating object in FOV—safety switch to protect patient
5. Underexposure situations
a. Thin and fatty-replaced breasts—possible overexposure because of AEC sensor lag
b. Active sensor measures open-field area—results in noisy images (see Fig. 8-16B in text book)
6. Technique charts: guides to determine kV, mAs, and target-filter (see Table 8-2 in text book)
8.3 COMPRESSION, SCATTERED RADIATION, AND MAGNIFICATION
1. Breast compression: reduces overlapping anatomy, decreases tissue thickness for less geometric blurring, stops inadvertent motion, lowerradiation dose (Fig. 8-15A).
a. Compression paddle—Lexan plate attached to a mechanical assembly (Fig. 8-15B)
(i) Right-angle edge at the chest wall produces a flat, uniform breast thickness
(ii) Alternative: “flex” paddle is spring-loaded on the anterior side; curved paddle.
b. Spot compression: approximately 7-cm diameter region, for aggressive compression (Fig. 8-15C)
c. Compression force (optimal)—111 to 200 newtons (25 to 44 lb)
d. Foot pedal motor-driven adjustment is accompanied with a mechanical adjustment knob
2. Scattered radiation: additive, varying distribution degrades subject contrast, adds quantum noise
a. Scatter to primary ratio (SPR) is a function of breast thickness and field area (Fig. 8-16)
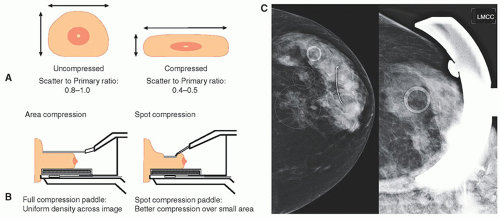
▪ FIGURE 8-15 A. Compression is essential for mammographic studies to reduce breast thickness (less scatter, reduced radiation dose, and shorter exposure time) and to spread out superimposed anatomy. B. Suspicious areas often require “spot” compression to reduce superimposed anatomy by spreading the tissues over a localized area. C. Example image with suspicious finding (left). Corresponding spot compression (digitally magnified) illustrates less tissue overlap (right). F. 8-17

▪ FIGURE 8-16 X-ray scatter reduces the radiographic contrast of the breast image. Scatter is dependent on breast thickness and x-ray field area. The scatter-to-primary ratio is plotted as a function of the diameter of a semicircular field aligned to the chest wall for breast thicknesses of 50% glandular tissue. F. 8-18

▪ FIGURE 8-17 Antiscatter devices commonly employed in mammography include (A) the linear grid of approximately 5:1 grid ratio and carbon fiber interspace material, (B) a cellular crosshatch grid structure made of copper sheet of ˜3.8:1 grid ratio with air interspaces and scatter rejection in two dimensions, and (C) the air gap intrinsic to the magnification procedure. Note: while the illustration depicts 100% scatter rejection by the grid, approximately 15% of scattered x-rays are transmitted. F. 8-19
b. Contrast degradation factor—amount of contrast lost by detection of scatter—subject contrast without scatter—C0; contrast with of scatter, CS

3. Antiscatter grids
a. Transmission: 60% to 70% of primary x-rays; absorption of 75% to 85% of scattered x-rays
b. Linear focused grids: ratios of 4:1 to 5:1, frequencies of 30 to 45/cm (Fig. 8-17A)
c. Cellular grids: copper honeycomb with air interspace, approximately 3.8:1 ratio, achieves 2D scatter compensation (Fig. 8-17B)
d. Grid motion during the exposure blurs the grid structure
e. Short exposures cause most gridline artifacts due to insufficient motion.
f. Increased dose for using grids is about a factor of approximately 2×.
4. Air gap: large fraction of scatter misses the detector.
a. Achieved with magnification (Fig. 8-17C)
b. Anatomic field of view (FOV) is reduced because of magnification.
5. Magnification: improves overall mammography system resolution
a. Breast support platform (magnification stand) positions breast well above detector.
b. Small (0.1 mm) focal spot is required to reduce geometric blurring.
c. No antiscatter grid, compression paddles designed for magnification (Fig. 8-18)
d. Typical geometric magnifications: 1.5×, 1.8×, or 2.0×
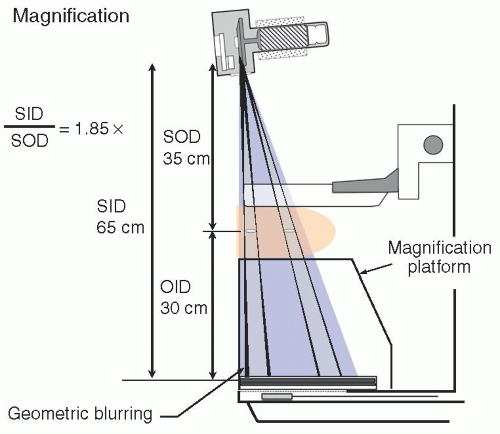
▪ FIGURE 8-18 Geometric magnification. A support platform positions the breast closer to the source focal spot, resulting in 1.5× to 2.0× image magnification. A small focal spot (0.1 to 0.15 mm nominal size) reduces geometric blurring. Effective focal spot size varies along the cathodeanode axis (large to small effective size) and is accentuated with magnification. Best spatial resolution and detail in the image exist on the anode side of the field. SID, source to image distance; SOD, source to object (midplane) distance; OID, object to image distance. F. 8-20
e. Advantages: Increased spatial resolution, reduction of quantum noise and scatter
f. Limitations: geometric blurring, tube current limit: approximately 25 mA; exposure time: approximately 4 s
g. Breast dose is similar to contact imaging—this results from the offset of no grid ↓(reduced dose) versus inverse square distance ↑(increased dose).
8.4 DIGITAL ACQUISITION SYSTEMS
1. Full-field digital mammography (FFDM)
a. Technology: flat panel thin film transistor (TFT) array detector (Fig. 8-19)
b. Detection: indirect and direct x-ray detection (Fig. 8-20)
(i) Indirect—conversion of x-rays to light to charge
(ii) Direct—conversion of x-rays directly to charge
c. CMOS (Complementary Metal Oxide Semiconductor)—crystalline silicon approximately 50-75 µm dexels, uses an indirect mode of x-ray signal acquisition; functionally similar to TFT arrays
d. Computed Radiography (CR)—cassette-based transition technology for digital mammo (no longer used)
e. Benefits (over screen-film mammography)
(i) Wide dynamic range with separation of acquisition and display
(ii) “For Processing” (raw, corrected) images for quantitation, CAD, AI evaluation
(iii) “For Presentation” enhance contrast, skin-line visibility, magnification, edges.
(iv) Lower dose for flat-panel TFT and CMOS detectors; MGD for 4.2 cm breast—approximately 1 to 1.5 mGy relative to 1.8 to 2.2 mGy for screen/film and CR (see dosimetry section)
f. Increased productivity (but not CR): no handling of cassettes, instant image processing
2. Digital tomosynthesis—a method to reduce the problem of anatomical superimposition
a. Projection images acquired over a range of angles generate depth-dependent shifts.
(i) Reconstruction: “shift and add” or filtered backprojection methods (Fig. 8-21)
b. The x-ray tube/detector system acquires projection images over a limited angle arc.
(i) Tomographic angles from ±7.5° (15°) to ±25° (50°)—larger tomographic angles provide better Z-axis resolution (Fig. 8-22).
(ii) Acquisition times from approximately 5 s up to approximately 25 s dependent on tomographic angle range in continuous or “step and shoot” mode
(iii) Many vendors and systems use detector binning mode (2 × 2) dexel output.
(iv) DBT system design parameters are shown in Table 8-3 (in the textbook).

▪ FIGURE 8-19 The flat panel array is a two-dimensional matrix of detector elements lithographed on an amorphous silicon substrate. Each detector element is composed of an electronic switch (the TFT), a charge collection electrode, and a storage capacitor. The gate and drain lines provide the mechanism to extract the locally stored charge by activating gate lines row by row and collecting charge down each column. Charge amplifier and digitizers convert the signals to corresponding digital values for transfer to the digital image matrix. F. 8-21.

▪ FIGURE 8-20 A. TFT flat panel arrays have a common amorphous silicon structure. B. “Indirect x-ray conversion” TFT arrays have a photodiode layer placed on the charge collection electrode, optically coupled to a layer of CsI phosphor. X-ray absorption generates light, and light creates mobile electric charge in the photodiode, collected by the electrode and stored in the capacitor. C. “Direct x-ray conversion” TFT array uses semiconductor layer of approximately 0.5 mm thick, with 10 V/µm electric field. Hole-electron pairs created in semiconductor layer by x-rays migrate to positive and negative electrodes, with minimal lateral spread. A proportional charge is stored on the capacitor. Indirect and direct detectors appear similar, shown by the pictures on the right. F. 8-22

▪ FIGURE 8-21 A. Digital breast tomosynthesis (DBT) images are acquired using low-dose techniques over a limited projection angle, from ±7.5° up to ±25°, with 9 to 25 images comprising the dataset depending on manufacturer. A block and spherical object are illustrated at two depths within the breast B. A simple “shift and add” of the acquired images illustrates the ability to synthesize tomograms with in-focus planes at various depths and blurred underlying and overlying signals. In practice, filtered backprojection algorithms reconstruct planes incrementally at 1 mm depths throughout the breast. F. 8-24
c. Tomosynthesis images are reconstructed approximately every 1 mm plus 2 to 3 images beyond the breast skin on each side; for example, 50 mm compressed breast thickness generates about 55 images in Z plane
d. Image viewing: stacked mode, parallel to detector plane, with 1 mm spacing (Fig. 8-23)
e. Image quality: number of projections affects in-plane resolution and blurring artifacts.
f. Synthetic mammography—realign and create a projection image, like conventional 2D.
(i) Eliminates need for a conventional screening mammogram; reduces MGD by 50%.
(ii) Reduced resolution, some calcification (over) enhancement
g. MGD: approximately 10% to 15% higher than 2D; antiscatter grid is used for some systems.
h. Artifacts: incomplete blurring/suppression of high-density objects, with “halo” signs; anatomy close to focal plane appears larger; truncation artifacts at the reconstructed image periphery; stairstep artifacts with objects unintentionally placed in the beam, such as the shoulder

▪ FIGURE 8-22 DBT z-axis resolution is dependent on the x-ray tube angle and determines the amount of overlying and underlying contributions to the in-focus plane for the tomosynthesis images. A projection image (left) has 100% anatomical overlap. Shown are several manufacturer’s implementations for progressively larger sweep angles up to 50°, with less tissue overlap and improved z-axis resolution (indicated by vertical double-arrow lines). On the right is 180°+ tube rotation achieved with dedicated breast CT, demonstrating no overlap of tissues. F. 8-25
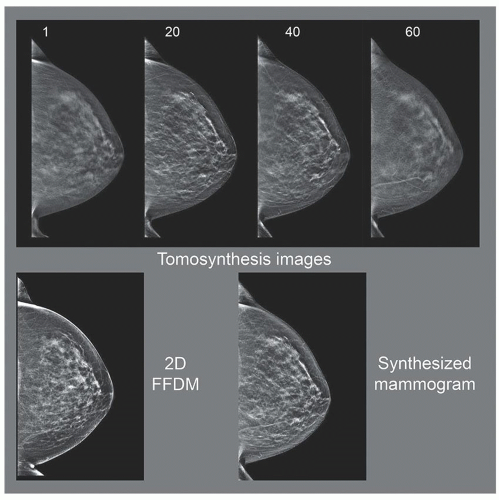
▪ FIGURE 8-23 Top row. Tomosynthesis images are shown for the left cranial-caudal projection at 4 depths (in mm) from the support platform. The overall breast dose is slightly higher than a single projection mammogram. Lower left. 2D full-field digital mammogram (FFDM). Lower right. Synthesized mammogram (from tomosynthesis image acquisition) taken at a different time. This 2D image is often used instead of the 2D FFDM acquisition, and radiation dose to the breast can be reduced by about 50% compared to the combination. F. 8-26
3. Dedicated breast CT—true 3D volume datasets and elimination of superimposition
a. Cone beam CT geometry in horizontal plane (Fig. 8-24) using a flat panel detector
b. Hundreds of low-dose images acquired about the breast position without compression
c. Reconstruction of the 2D images into nonoverlapping voxels in the breast volume
d. Higher kV (˜60 kV) permits lower radiation dose; a scatter grid is not typically used.
e. MGD: like a two-view mammogram—for example, a 4.5 cm compressed breast ×2 = approximately 4 mGy
f. Breast CT with contrast is thought to be largely equivalent to breast MRI.
4. Stereotactic biopsy—systems localize and sample breast lesions in 3D
a. Use: biopsy of microcalcification lesions (breast mass biopsy—ultrasound or MRI)
b. Geometry configurations
(i) Prone table—breast placed through hole in horizontal table (Fig. 8-25)
(ii) Standard mammography system—add-on biopsy device for lesion trajectory/depth
c. Two images acquired ±15° (30° total) from the conventional projection (Fig. 8-26)
(i) Objects closer to the detector shift less than objects further away (toward the focal spot)
d. Depth and trajectory: determined by the location and shift in each image (Fig. 8-26)
 ▪ FIGURE 8-24 Dedicated breast CT. Left. Patient is on the scanner in the prone position with one breast placed at the center of the gantry access port; about 500 projection images are acquired during a 360° rotation of the x-ray tube and detector about the breast. Right. CT tomographic slices are reconstructed in the coronal plane (upper left), with multiplanar reformatting to produce the sagittal (right) and axial (lower left) image planes.  F. 8-27 F. 8-27 |
 ▪ FIGURE 8-25 A stereotactic biopsy system with a prone positioning system is shown. The breast is positioned through the hole onto the detector platform and compressed by an open-access paddle (close-up shown on the right, with the x,y,z coordinate directions indicated). The x-ray tube pivots horizontally about a fulcrum point to acquire digital images at +15° and -15° projections.
 F. 8-28 F. 8-28Related posts:Stay updated, free articles. Join our Telegram channel
Full access? Get Clinical Tree
 Get Clinical Tree app for offline access

|