Breast Ultrasonography
6.1 Technique and Methods
6.1.1 Basic Principles
Breast ultrasonography is a dynamic real-time examination in which image generation is based on the conduction and reflection of high-frequency mechanical sound waves (ultrasound) in the breast tissue. The technique is also known as sonography and is loosely but commonly referred to simply as ultrasound or ultrasound examination). Numerous physical and technical factors play an important role in the formation of an ultrasound image. A wide range of high-performance examination devices are available for everyday clinical practice (▶ Fig. 6.1a).

Fig. 6.1 Sonography unit and transducer position for an ultrasound examination of the breast. (a) Commercially available, high-definition ultrasound device (manufacturer: GE Healthcare, Milwaukee, WI, USA). (b) Typical handling of the transducer with fixation of the base. Movement is carried out from the wrist.
Physical Principles
Modern ultrasound probes (transducers) contain numerous piezoelectric elements or crystals that can produce ultrasonic impulses and receive the returning echo signals. An ultrasound impulse is a mechanical compression wave generated by applying AC voltage to the surface of a piezoelectric crystal, causing it to oscillate. Thus these crystals transform an electrical current into mechanical ultrasound waves. The number of oscillations per unit time is termed frequency, given in hertz. One hertz (1 Hz) equals one oscillation per second, and one megahertz (1 MHz) is thus one million oscillations per second. Medical ultrasound devices work at a sound frequency (f) of 3 to 15 MHz, well above the audible hearing range (which is up to 20 kilohertz).
Sound waves require an elastic medium in which to propagate. They are a continuous, longitudinal transmission of kinetic energy. Particles that are induced to oscillate transmit these oscillations to the neighboring particles, which in turn transmit them on to the next particle. The kinetic energy spreads out continuously in a sine wave manner, so that regions of particle compression and decompression develop at periodic intervals. The distance between two identical phases of a wave (locations of the same particle density) corresponds to the wavelength, λ (lambda).
The velocity with which the kinetic energy is transmitted depends on the density and compressibility of the medium through which the wave passes. Because the particle density in dense tissue is higher than that in soft tissue, the distance between one particle and the next is less and the sound propagation velocity is therefore higher. Sound waves travel faster in solids than in liquids or gases. The velocity (v) with which sound waves travel through the different soft human body tissues, however, is very similar and is calculated to be approximately 1540 meters per second (m/s) (international standard value).
The velocity of a wave is a function of the wavelength and frequency:

where ν = velocity of propagation (m/s); λ = wavelength (m); f = frequency (s−1)
Thus, the higher the frequency, the shorter the wavelength. For the sound frequency applied in breast ultrasonography of 7.5 to 15 MHz, the wavelength is 0.1–0.2 mm. These short wavelengths enable good spatial resolution and the visualization of small structures.
Generation and Transmission of Sound Waves
In breast diagnostics, virtually all ultrasound techniques are based on pulsed sound waves, the so-called pulse–echo principle. A short electrical impulse causes the piezoelectric crystals of the transducer to oscillate, producing the sound impulse. The acoustic pulse is terminated by damping and is of only short duration (ca. 1 microsecond [μs]). In the time between impulses, the piezo element is available to receive the returning ultrasound echoes.
When sound waves encounter the boundary between two different materials with different densities there is a change in the sound propagation velocity and acoustic impedance. The greater the difference in the acoustic impedance of the materials or tissues, the greater the proportion of sound wave energy that will be reflected at the interface rather than transmitted onward. In breast ultrasonography, the oscillations of the piezo element in the transducer are transmitted to the body over a coupling layer that compensates for the impedance (sound resistance) between the oscillator and the skin surface. This minimizes the energy loss involved in transmission of the sound to the breast. Because the impedance differences between tissues within the breast are slight, the sound waves propagate well and only a small proportion of the acoustic energy is reflected at breast structure interfaces at different depths. The mechanical energy of the reflected sound waves returning is transduced into electric current at the piezo element. Because the time between sending and receiving a signal is proportional to the distance between the transducer and the reflecting structure, this information can be converted into an image.
Note
Ultrasound systems send 3,000 to 5,000 ultrasonic impulses per second and receive their reflection as echoes. This information is converted and processed into images fast enough to enable an examination in real time.
Because of the very similar impedances of breast tissue structures, the larger part of the applied acoustic energy is transmitted through interfaces that are encountered, thus remaining available for undergoing further reflection and generating images of deeper structures. However, if the ultrasound meets an interface or a structure with a significantly smaller or larger impedance, such as air, macrocalcifications, or some tumors, then almost all of the sound wave energy is reflected. Posterior to these structures, the sound is extinguished and no image information can be gained there.
Note
Differences in impedance are slight in normal breast tissue. Therefore only a small proportion of the energy of the ultrasound is reflected at any interface and serves to generate the image.
Physical Phenomena
Sound waves propagate optimally if they strike a smooth interface at right angles. Depending on the impedance jump, a greater or lesser portion of the energy is reflected back to the transducer and the other portion travels further on in a straight line, i.e., at the same angle. This situation rarely occurs within the human body. Instead, ultrasonic waves undergo various interactions as they travel through tissue: absorption, reflection, refraction, and scattering.
Acoustic Attenuation
With increasing penetration, there is increased acoustic attenuation. One source of this energy loss is absorption, which is the conversion of acoustic energy into heat. In biological tissues, absorption is approximately linearly dependent on the sound frequency: the higher the frequency, the higher the absorption. Also, deflection of the sound wave occurs at the interfaces of tissue structures with varying density, depending on the difference in impedance, the angle of incidence, and the roughness of the interface surface (reflection, refraction, and scattering). The portions of sound energy that are not reflected back to the transducer and received as echoes are lost to image generation.
Note
The optimal transducer frequency is a compromise between the required penetration depth and the desired spatial resolution.
If the ultrasound strikes an interface at a slanting angle, a small portion of the acoustic energy (a function of amplitude) is reflected back toward the source (transducer) along the direction of incidence. The remaining ultrasound is transmitted into the second medium at an angle different from the angle of incidence (refraction). The angle of refraction depends on the incident angle (the more inclined, i.e., the greater the angle of incidence, the greater the angle of refraction) and on the sound wave velocity in the second medium. If tissue structure interfaces are highly oblique to the sound wave propagation direction, the refraction of the sound wave can be such that it does not penetrate the tissue surface, causing posterior acoustic attenuation—i.e., shadowing, within which there is no image information. This is of practical importance for breast ultrasonography. Using an appropriate examination technique, increasing the transducer pressure (i.e., compressing the breast) can often flatten the tissue interfaces, making them more horizontal to the transducer surface and thereby improving ultrasound transmission and the ultrasound image (see ▶ Fig. 6.4).
Practical Tip
When there is poor sound penetration (due to inhomogeneous parenchyma or scarring), the ultrasound transmission can often be improved by increasing the breast compression using the transducer probe.
Interference
Superimposition of two or more sound waves with different phases can strengthen (constructive interference) or weaken (destructive interference) the combined wave according to the superposition principle. The spatial arrangement of regions of weakening and strengthening is known as the “interference pattern.” This has a significant influence on the appearance of the ultrasonic image impression (its homogeneity). In the ultrasonographic examination of the breast, an inhomogeneous interference pattern can significantly compromise the sensitivity of the examination. Because the interference pattern is determined primarily by the number and arrangement of oblique interfaces in the breast and not by the mammographic density of the parenchyma, the sensitivity of breast ultrasonography can vary, even in women with similarly structured parenchyma on mammography.
Posterior Acoustic Enhancement
Using optimal time gain compensation (TGC), there is a uniformly brighter tissue strip posterior to structures that have less acoustic attenuation than the surrounding parenchyma—as in the case of cysts, for example. This impression of posterior acoustic enhancement arises because the TGC compensates for the normal acoustic attenuation of the neighboring tissue, which increases with increasing depth. Thus the reflected sound signals from regions posterior to a nonattenuating structure are less weakened than the surrounding tissue and appear strengthened.
Reverberation Artifacts
Reverberation occurs when sound waves encounter two highly reflective parallel surfaces, such as the walls of a puncture needle. A portion of the sound wave energy is reflected back and forth between the two surfaces before returning to the transducer and being received as echoes. Because the probe detects prolonged traveling times after repeated reflections and treats these as longer distance of travel, the structure erroneously appears repeatedly at equally spaced intervals with decreasing brightness at deeper levels in the image. The echo that returns to the transducer after a single reflection corresponds to the correct position of the reflecting structure.
6.1.2 Device Adjustments
Display Unit and Documentation
Contrast and brightness can be adjusted according to a gray scale, which is usually displayed at the image border. Optimal adjustment of this parameter is important for being able to utilize the entire grayscale information and to enable a good comparison for later follow-up or for a second opinion.
Signal Enhancement
The brightness of the ultrasound image depends on the power output of the transmitter, amplitude of the received signal, and depth compensation. The higher the emitted sound amplitude and overall gain, the brighter the image. The base setting should be made in the center of the image, where most parenchyma is displayed. With an average power output, the dial or slide controls (TGC) are used to adjust the depth compensation so that superficial connective tissue fibers have the same level of brightness as those at a greater depth, i.e., throughout the image.
Focusing
Most transducers used for breast examinations provide multiple focal zones with variable focal positioning. When a single focus is used, the focus should be set at the level of the anterior to middle third of the breast. In the supine position, most breasts have a depth of 2 to 4 cm. When using multiple foci with two or three zones, covering the area from 0.5 to 3 or 4 cm depth is usually optimal.
Image Scaling
The penetration depth should be set just large enough so that the chest wall is visible on the bottom of the monitor. If the scale is smaller, the screen width will not be optimally utilized. If the scale is larger, the deep tissue structures will be incompletely displayed. Zooming (detail enlargement) is advantageous for targeted imaging of small lesions.
6.1.3 Examination Technique
Positioning
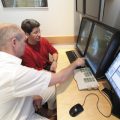
For the ultrasound examination of the breast, the patient should lie supine with the hands folded behind the head (▶ Fig. 6.2). In this position, the breast is distributed over the chest wall and slightly immobilized, facilitating a systematic examination. Acoustic penetration is improved by the flattening of the tissue structures and reduction of the tissue layer thickness. With large breasts that fall to the side, elevating the ipsilateral chest wall with a pillow properly placed under the patient can enable better positioning of the breast. In individual cases, a supplementary examination can be carried out in other positions (for example, in the sitting position) for targeted examination of a tumor that is not palpable in the supine position. Ideally, the ultrasound machine should be positioned across from the examiner, in the direct line of sight (▶ Fig. 6.2).

Fig. 6.2 Orientation of the ultrasound device. Ideally, the ultrasound unit should be in a position that is in the direct line of sight of the examining physician and such that it is possible for the patient to follow the examination on the monitor.
Coupling Gel
To facilitate a systematic and uninterrupted ultrasound examination, the entire breast should be amply coated with coupling gel. This serves to effectively transfer the sound waves from the transducer to the breast by preventing the formation of a layer of air, which would cause an immediate reflection of the sound energy due to the large impedance discontinuity.
Holding the Transducer
The examiner should hold the transducer at the base and guide it using the wrist. For the systematic examination of the breast, the transducer is placed perpendicular to the skin surface (▶ Fig. 6.1b). Normally the weight of the transducer and the hand is sufficient coupling pressure. A greater pressure with compression and flattening of the breast structures is applied selectively as necessary, for areas in which the sound penetration is insufficient. On the other hand, if the coupling pressure is too high, the transducer can displace structures and push them ahead of the transducer. It is even possible to overlook tumors as a result of displacing them out of the image plane. It is best for the comfort of the examiner for them to sit next to the patient at a height that allows the examiner to lay the forearm lightly on her body. In this way, the sense of space and controlled transducer guidance is optimized (▶ Fig. 6.2).
Examination Procedure
Proper technique with systematic guidance of the transducer is important for the reliable detection of small breast tumors. The entire breast is examined with overlapping transducer paths, moving in a back-and-forth pattern with care not to miss any areas. The examiner is free to choose which sectional plane to use, but usually the sagittal plane is preferred. An examination in the transverse plane is usually performed as a supplementary procedure for additional assurance that the examination has been thorough, without any areas having been overlooked (for example, by novice sonographers or in a “second-look” ultrasound examination). The radial plane is usually used specifically as a diagnostic work-up of milk duct changes. To evaluate the retroareolar region, commonly restricted by the development of acoustic shadowing, it is often helpful to tilt the transducer in the appropriate direction and to increase the transducer contact pressure in a controlled manner.
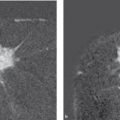
In the dynamic examination, changing the image plane allows assessment of masslike breast structures in three dimensions. A true mass lesion, which can be demarcated from the normal breast structures on all sides, can easily be distinguished from a pseudotumor (▶ Fig. 6.3). In addition, the elasticity of structures and tissue can be assessed by increasing the transducer contact pressure. Soft tissues such as parenchyma and adipose tissue deform when compressed. Malignant tumors, on the other hand, have a firm consistency and can be compressed only little, if at all.

Fig. 6.3 Changing the plane to differentiate a true mass lesion from a pseudotumor. (a) Hypoechic mass lesion in the sagittal transducer position. (b) Turning the transducer shows that the lesion is not circumscribed in three dimensions (pseudotumor).
Practical Tip
Because a lesion in the breast is displaced when the transducer contact pressure is increased, one must take care to examine and document a lesion with and without compression in the same plane.
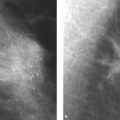
Decreased ultrasound penetration (attenuation) in normal, inhomogeneous parenchyma or posterior to scar tissue can often be improved by increasing the transducer contact pressure. This leads to flattening of the oblique interfaces and a decrease in sound refraction, facilitating the assessment of the ultrasound examination and the differential diagnosis from malignant changes (▶ Fig. 6.4). Carcinomas often have inhomogeneous internal structure and show a posterior acoustic shadow that is not diminished by increasing the transducer contact pressure because of the limited compressibility of the tumor.

Fig. 6.4 Effect of increased transducer pressure on the sound penetration and the image quality in the case of inhomogeneous parenchyma. (a) Normal examination without additional compression using the transducer. (b) Same image section with increased breast compression, showing a visible improvement in the acoustic penetration.
Image Documentation
The stored image should exhibit an image quality that allows evaluation of the findings by a third party. It must include data concerning patient identification, examination date, and the institution where the examination was performed, as well as technical data about the device settings (▶ Table 6.1). As a matter of principle, every focal lesion should be documented in two perpendicular planes. In the case of multiple, similar, benign-appearing lesions, such as simple cysts, a representative sample should be documented. If there are no focal lesions, bilateral representative image sections of the parenchyma and axilla should be documented. These images should convey an impression of the assessability and reliability of the examination.
Documentation | Data |
Written Information on the ultrasound image report | Name and location of the institution |
Examination date | |
Patient’s name and birth date and/or identification number | |
Initials of the examiner | |
Device adjustment (frequency, performance, focal position) | |
Image acquisition | Transducer orientation or plane on a diagram |
In the case of unremarkable findings: bilateral representative cross sections of the parenchyma + axilla | |
In the case of a suspicious lesion: documentation images with and without measurements in two perpendicular planes | |
Lesion localization on a diagram (with indication of the distance to the nipple) |
Practical Tip
It is a good idea to include sonographic image documentation of areas that are suspicious on clinical examination, mammography, or breast MRI, even if no sonographic lesion is verified there. This both documents the absence of a sonographic correlate and demonstrates that adequate care and attention were taken.
Written Documentation
The written documentation of an ultrasound examination should contain both a statement as to the assessability of the examination, as well as a description and assessment of conspicuous findings using standardized evaluation criteria and nomenclature.
6.1.4 Ultrasound Techniques
Brightness Mode
For the production of an ultrasound image, short ultrasonic impulses are transmitted that spread out into the tissue and are reflected back from different depths. Because the time lapse between sending and receiving a signal is proportional to the distance between the reflecting interface and the transducer, the depth of these structures can be calculated. If the amplitude of a reflection is depicted as a point of corresponding brightness, the reflections from multiple ultrasound beam scans can be visualized next to each other to produce a two-dimensional image of the examined organ (▶ Fig. 6.5a). In modern devices, 256 grayscale levels are usually represented. The stronger the signal (greater amplitude), the brighter the corresponding image point. The high image refresh rate enables real-time visualization.

Fig. 6.5 Ultrasound techniques. (a) B-mode. (b) Color-coded duplex sonography. (c) 3D sonography. (d) Panorama image. (e) Elastograph.
Color-Coded Duplex Sonography (Doppler-Sonography)
Measurement of tissue perfusion can be helpful in differentiating between benign and malignant tumors because rapidly growing malignant tumors by their nature usually have increased vascularization. But because proliferative benign changes can also exhibit increased vascularization such measurement cannot allow definitive differentiation.
The Doppler effect is the velocity-dependent change in the received frequency (frequency shift) of the wave from a transmitter or a reflecting object (such as blood cells) that is moving relative to the receiver. In duplex sonography, B-mode sonography (to detect vessels) and pulsed Doppler imaging (to analyze flow in the detected vessels) are combined. Because tumor blood vessels are very small, they are not themselves discernible by sonographic imaging, so this method by itself has no significant utility in tumor diagnosis. However, in color-coded Doppler sonography (or color Doppler sonography), the frequency shifts (due to flow movements) are visualized as colored areas in a defined image section of the B mode image. The color shade encodes the flow direction and the color brightness encodes the velocity of flow. This method enables two-dimensional visualization of blood flow in real-time imaging and the localization of small vessels, which are of importance in tumor diagnosis (▶ Fig. 6.5). Addition of the duplex mode makes it possible to calculate the flow velocity within the visualized vessels and analyze the frequency profile. Because of the limited sensitivity of color Doppler in locating microscopically small vessels and the angle-dependency of the Doppler principle, another method of signal processing has been developed. The power Doppler method encodes only the intensity of the Doppler signal, without providing information on the direction of flow. The advantage of this technique is its high sensitivity: it can make the smallest vessels visible and detect very slow flows. As an example, it can differentiate a thickened cyst with internal echoes from a round, very hypoechoic solid process. Its disadvantages include susceptibility to artifacts caused by the high sensitivity to movement and the inability to quantify measurements.
Contrast-Enhanced Sonography
Echo contrast agents are substances that, after intravenous injection, raise the sonographic reflectivity of blood. After approximately 20 to 40 seconds the contrast material reaches the arterial blood vessels and produces improved visualization of these blood vessels in the color Doppler examination. Like noncontrast Doppler diagnostics, contrast-enhanced sonography is not well suited as a method of detection. Also, because of the short window of opportunity before the contrast medium has passed through the arterial vessels, this method—which is still experimental—only comes into use if needed as a diagnostic work-up in selected problem cases.
Doppler sonography requires the examiner to have extensive experience and sufficient practice. Because it does not provide reliable differentiation between benign and malignant changes, it is advisable to carry out an ultrasound-guided core needle biopsy, if there is any doubt.
3D Sonography
Three-dimensional (3D) ultrasonography is based on the acquisition and processing of numerous, closely spaced two-dimensional (2D) image sections. For this, a specialized probe affords automatic guidance of the transducer and ensures a geometrically correct 3D reconstruction.
3D visualization of breast tumors facilitates the spatial presentation and image interpretation. Its particular advantage, however, is the ability to document the 3D findings and communicate them to other attending physicians, such as the surgeon. In addition, this is the only method that allows reconstruction of the horizontal sectional plane, in which the retraction pattern of malignant tumors is often well visualized. The 3D visualization made possible by volume rendering provides good orientation in cases of multifocal tumor foci and for the exact needle guidance in all planes during interventional procedures (▶ Fig. 6.5c).
Panorama Scan Mode
A panorama scan is a 2D wide image reconstruction in one image plane. The transducer is guided over the region of interest in an appropriate sectional plane, blending multiple images together to form one long image of an entire breast section. This gives a clear graphic survey of the breast anatomy and indicates the full dimensions of any lesions present and their spatial relationship(s) to each other in the imaged plane (▶ Fig. 6.5d).
Real-Time Compound Scan
This image reconstruction technique, also known as Sono CT, combines images that have been generated with various ultrasound incidence angles. In this way, creation of artifacts due to increased or diminished sound transmission is suppressed. Because these artifacts can also be important diagnostic criteria (acoustic enhancement, acoustic attenuation), the compound scan should only be used in conjunction with a simple scan to evaluate suspicious findings.
Automated Volume Scan
An automated system generates continuous ultrasound section images through the entire breast in this examination technique. The examination is performed using a dedicated ultrasound device (ABVS, automated breast volume scanner); the patient must be positioned comfortably, and the transducer, which is attached to a swivel arm, is placed on the breast. Sonographic section images are automatically acquired and can then be used to reconstruct a full-field volume image. For most breast sizes, two to four such volume scans suffice. The automated examination has the advantages that it is a physician-independent examination procedure compatible with a screening situation; that it requires a relatively short imaging time; that it provides coronal section reconstruction and volume visualization; and that it provides standardized documentation. The ultrasound images generated are sent to a workstation, where they can be processed and evaluated at any time by one or more examiners; they are thus easily accessible for a second opinion. Disadvantages include the uncertain inclusion of lateral parts of the breast and the axillary tail due to inadequate placement of the transducer on the breast, and the inability to evaluate the individual physical characteristics of tissues, such as lesion compressibility and plasticity.
Ultrasound Elastography
Malignant tumors usually have a harder consistency and are less compressible than benign tumors and normal breast structures: elastography uses real-time acquisition of the differences in tissue elasticity to distinguish these changes. Two different methods are under test:
Compression by manual transducer movement: Some systems compress the breast tissue by manual oscillation of the transducer toward and away from the chest wall with quick, uniformly intense movements over the lesion being examined. The deformations this causes produce detectable changes in the ultrasound signal that are represented by color coding. To date, only limited reproducibility of the findings has been shown, because of the difficulty of carrying out the procedure.
Shear-wave method: The shear-wave method uses a different technique to measure elasticity. Here, in addition to the ultrasound waves emitted to produce the image, a separate ultrasound impulse is sent out into the tissue, which generates a transverse mechanical (shear) wave. The velocity at which this transverse wave is propagated is dependent on the tissue elasticity, which can be measured and portrayed using color coding. Because this examination is not dependent on the examiner and renders absolute tissue density values in different measurement windows, one would expect the study results to be reproducible. However, it is not uncommon to find benign tumors that are soft, and malignant tumors that are hard; for this reason, preference should be given to the liberal use of ultrasound-guided core needle biopsy, which is simple, cost-effective and reliable (▶ Fig. 6.5e).
6.1.5 Quality Assurance
The German National Association of Statutory Health Insurance Physicians has stipulated the following requirements for the performance of the ultrasound examination of the regional lymph nodes (2012):
Mode: B mode.
Transducer: linear array.
Transducer frequency: ≥7.0 MHz.
Transmit focal setting: electronically variable focal zone for optimal lateral resolution.
Transmission aperture: variable, depending on the chosen focal zone.
Reception amplification: variable time gain compensation (TGC).
Dynamic range: ≥ 60 dB.
Field of view: penetration depth ≥6 cm, width ≥8 cm.
Image refresh rate: ≥15 images/second.
Bit depth: ≥8 bits.
The German Society for Ultrasound in Medicine (DEGUM: Deutsche Gesellschaft für Ultraschall in der Medizin) has formulated concrete requirements for devices and technical specifications:
Device requirements: image quality in clinical use:
128 gray levels.
Good differentiation of breast tissue components (soft tissue differentiation).
Depiction of structural irregularities in breast tissue.
Depiction of tumor border irregularities.
Distinct depiction of cysts larger than 4 mm (higher standard: 2 mm).
Distinct depiction of solid tumors larger than 10 mm (higher standard: 5 mm).
Penetration depth of at least 4 cm with good spatial resolution.
Depiction of a 20-gauge needle in breast tissue along the image plane.
Technical requirements:
Documentation: digital or hardcopy system (multiformat film, video printer, Polaroid).
Transducer frequency >5 MHz or multifrequency transducer (must fulfill quality assurance requirements on phantom tests).
Image refresh rate >12 images/second.
Field of view >3.8 cm.
Incorporated acoustic standoff, if near-field resolution is not sufficient.
Image monitor display: patient identification number, date, transducer, measuring caliber, body marker (or other localization specification, e.g. text), capacity, time gain compensation (TGC), preset, depth scale.
Device safety in accordance with the regulations for the device.
Freehand biopsy or puncture guidance with image screen display (5mm lesions must be accessible at all depths).
Device performance is tested on a phantom and on the basis of breast examinations. Quality control by technical experts should be carried out every 6 months.
6.2 Evaluation
6.2.1 Terminology
The most recent edition of the ACR BI-RADS lexicon incorporated breast sonography and breast MRI alongside mammography and it is recommended that this terminology be used to describe sonographic breast findings.
6.2.2 Tissue Type in Sonography
The sensitivity of any breast examination method will depend on the individual anatomical and/or physiological conditions. Just as for the specifications of density types according to the ACR in X-ray mammography, the sensitivity of the breast ultrasound examination should be assessed and documented for each examination. The ACR established systematic and standardized criteria for X-ray mammography findings in its BI-RADS lexicon, first published in 1999. In the second edition, published in 2003, the ACR established corresponding criteria for the categorization of ultrasound findings, and thereby created a uniform international terminology as a basis for a standardized evaluation. The German Society for Ultrasound in Medicine (DEGUM) has modified this USBI-RADS Iexicon for the German-speaking European regions, incorporating its years of experience with breast sonography.
The echotexture—that is, the echogenicity and homogeneity—of the parenchyma in the sonographic image is the fundamental factor in the reliability of the sonographic examination for the detection of carcinoma of the breast (▶ Table 6.2, ▶ Fig. 6.6). With high echogenicity, a clear, sharp image with good penetration of the parenchyma can usually be acquired. When there is additional fibrosis, however, the acoustic penetration can be impaired to a greater or lesser degree, and the result is an inhomogeneous-appearing image with regions of acoustic attenuation, which can considerably impair the assessability and sensitivity of the examination. In an involuted breast, the ultrasound echogenicity of the breast tissue is lower. It is easier to overlook small, hypoechoic mass lesions without posterior attenuation within such an echotexture than within homogeneous, hyperechoic parenchyma. Fortunately, it is particularly for the involuted breast that X-ray mammography has the highest sensitivity for the detection of breast cancer. The sonography examination report should always include a succinct description of the breast ultrasound composition pattern; this indicates the extent to which the sensitivity of the examination may have been compromised and a lesion missed. When breast cancer cannot be reliably ruled out in cases with reduced sensitivity, further diagnostic examinations may be indicated.
Level | Echotexture | Sensitivity |
1 | Homogeneous, parenchyma equivalent | Very high |
2 | Homogeneous, mixed lipomatous/parenchyma equivalent | High |
3 | Homogeneous lipomatous | Limited |
4 | Inhomogeneous, fibrocystic changes | Significantly limited |

Fig. 6.6 Typical examples of different echo textures in breast sonography. (a) Glandular homogeneous. (b) Mixed lipomatous/parenchyma equivalent. (c) Homogeneous lipomatous. (d) Fibrocystic.
Related posts:


Stay updated, free articles. Join our Telegram channel

Full access? Get Clinical Tree


