In the previous three chapters, we discussed chest imaging for a variety of indications, ignoring one of the most obvious concerns—cardiac ischemia. Among chief complaints to the emergency department, chest pain is the second most common, according to the National Hospital Ambulatory Medical Care Survey, and computed tomography (CT) has diagnostic value in ischemic chest pain evaluation and exclusion of pulmonary embolism and aortic dissection (discussed in detail in Chapter 7 ). CT scanners meeting the technical requirements for cardiac CT are widely available even in remote locations.
In this chapter, we begin with some definitions of “cardiac CT” to provide a basis for understanding its diagnostic capabilities and limitations. We describe the major functions of cardiac CT, including calcium scoring, CT coronary angiography, CT assessment of left ventricular function, and assessment of noncardiac causes of chest pain. We explore controversial areas of relative risk and benefit, comparing CT to other diagnostic modalities and strategies for evaluating ischemia and cardiac function. We specifically consider issues of emergency department length of stay, crowding, and cost for which CT has putative benefits. We weigh these potential advantages against radiation exposure, potential for unnecessary testing (and increased costs), and risk for false-positive test results that may ensue from widespread use of cardiac CT.
What Is Cardiac CT?
Cardiac CT includes a range of protocols with the ability to provide important structural and functional information ( Table 8-1 ). More information comes at a price, not only monetary but also in the form of increased radiation exposure or injected contrast dose, as we describe in detail later. As a consequence, not all information should be acquired in every patient. The emergency physician must carefully consider what information is clinically relevant to determine whether CT is the best test and to guide the choice of CT protocol for a given patient. Before discussing the diagnostic capabilities of CT, let’s consider the evolution of modern cardiac CT, because this sheds light on the choice of CT technique, determined by the clinical information needed.
| Diagnostic Information | Provided by CT? | Also Supplied By |
|---|---|---|
| Presence of coronary artery disease with information on affected heart region | Yes, if ECG gated |
|
| Specific coronary anatomy | Yes, if ECG gated |
|
| Myocardial perfusion | Not yet routine, although experimental techniques exist for both rest and stress perfusion |
|
| Ventricular function or ejection fraction | Yes, if retrospectively ECG gated |
|
| Valvular stenosis or insufficiency | Yes, if retrospectively ECG gated |
|
| Pericardial disease | Yes |
|
| Pulmonary embolism | Yes, if triple rule-out scan |
|
| Aortic dissection | Yes, if triple rule-out scan |
|
| Anomalous coronary artery anatomy | Yes, if ECG gated | Coronary angiography, although with limited sensitivity |
Evolution of Cardiac Computed Tomography
Single-Slice, Nonhelical Computed Tomography
Cardiac CT has evolved dramatically since its inception in the 1970s, broadening the spectrum of clinical conditions that can be evaluated and improving the diagnostic accuracy. Early CT scanners relied on a “single slice” (also called “step and shoot”) technique to acquire images. A patient was positioned on an examination table that moved through the CT gantry, which was equipped with a single x-ray source and detector. The patient was moved into the gantry, table motion was stopped, and a single image slice was acquired with a single rotation of the gantry around the patient. The patient table was then incremented by a small distance and again stopped, and an additional image slice was acquired by another gantry rotation. The process was repeated until a complete set of images spanning the region of interest was acquired.
Limitations of this technique were numerous:
- •
The technique was slow, with each slice taking as much as 3 seconds to acquire. Slow image acquisition led to significant motion artifact in thoracic imaging because of respiratory motion and motion occurring during the cardiac contraction cycle. Resulting images could not be evaluated for fine detail, as is required for imaging of coronary arteries and cardiac valves. Early imaging was thus restricted to larger structures such as the cardiac chambers and great vessels.
- •
Each image slice had a thickness of around 10 mm, so each viewable image represented the summation of anatomic data from a relatively thick axial section through the patient, a limitation called volume averaging . Structures smaller than the slice thickness could not be resolved, again preventing detailed assessment of cardiac anatomy such as coronary arteries, which are typically only 3 to 4 mm in size at their origins.
- •
The step-and-shoot or single-slice method resulted in image data “gaps.” Images were often acquired with spaces intervening between adjacent slices, with the consequence that structures located between image slices were not seen. This gap technique was necessary because the injected contrast bolus would outpace the slow CT scanner if the scanner were programmed to acquire contiguous or overlapping slices. For example, if a scanner acquired a single 10-mm (1 cm) slice every 3 seconds and was allowed to acquire contiguous slices without gaps, a thorax 35 cm in length would require 35 gantry rotations (at 3 seconds each), or 1 minute and 45 seconds—not including the time required for table motion between slices. The injected contrast bolus would have exited the chest long before the CT scanner spanned the structures of interest. The contrast bolus could not be maintained during that entire period without exceeding a safe contrast dose, leading to a risk for contrast nephropathy.
Several key technological innovations occurred by the late 1990s, surmounting many of the limitations of early CT.
Helical (“Spiral”) Computed Tomography and Volume Imaging
First, a new technique was introduced that allowed continuous gantry rotation and image data acquisition while the patient table moved through the CT scanner. This so-called spiral or helical technique allowed acquisition of three-dimensional volumes of image data ( volume acquisition ), without the data gaps created by discontinuous step-and-shoot single-slice scanners. Although many emergency physicians refer to CT pulmonary angiography as “spiral CT,” as if spiral technique were unique to this application, helical acquisitions are now routine for nearly every CT application in most body regions. Nonhelical, step-and-shoot acquisition is occasionally used in special circumstances described later, specifically in prospectively electrocardiogram (ECG)–gated CT for evaluation of coronary arteries.
Volume acquisition presented unique opportunities for complex computer modeling. The previous single-slice axial image acquisition technique offered reasonable image resolution in the axial plane (x- and y-axes). However, if axial image slices were “stacked” in the z-axis (cephalad-to-caudad direction) to create a three-dimensional volume and then “resliced” into coronal or sagittal planes, the resulting reconstructed images offered low quality. This was a result of both the missing data between the original axially acquired images and the relatively thick original slice thickness, which suffered from volume averaging. Coronal and sagittal reconstructions could not evaluate fine detail in the z-axis. In contrast, the new, helically acquired, three-dimensional volumes of data were isotropic—meaning that the pixel resolution in the x-, y-, and z-axes was equal. As a consequence, data could be manipulated extensively after acquisition, allowing detailed multiplanar reconstructions in axial, sagittal, coronal, and oblique planes. In addition, high-resolution three-dimensional reconstructions could be performed. Advances in computing speed from the 1970s to the 1990s were also instrumental in allowing these complex postprocessing algorithms to be performed.
Multidetector (Multislice) CT versus Single Detector (Single-Slice) CT
Another revolutionary diagnostic advance was the introduction of multidetector (sometimes called multislice) CT. The single x-ray detector of early CT scanners was replaced by an array of detectors, with 4, 16, 64, and even 256 detectors routinely available in modern scanners from multiple manufacturers. With multiple detectors simultaneously collecting image data during a helical acquisition, the speed of CT dramatically increased while image resolution was preserved or improved.
Here, it is important to clarify that the number of detectors alone does not determine resolution. Instead, the resolution is determined by the acquired slice thickness, which can be set as low as 0.625 mm even for many older-generation CT scanners with four or fewer detectors. However, acquiring 0.625-mm slices was impractical using single-slice scanners, as the time required to image a body region was prohibitive at this resolution. Consider our earlier example of a 35-cm (350 mm) thorax. A single-slice scanner acquiring contiguous slices 0.625 mm in thickness would require 560 gantry rotations to span the area of interest—for the earliest slow scanners operating at 3 seconds per slice, this would have required 28 minutes.
Slice number for modern scanners refers to the number of detectors, and thus the number of image slices, that can be simultaneously acquired during a single gantry rotation in the course of a helical image acquisition. A 4-slice scanner has 4 detectors and can acquire 4 slices per rotation; a 64-slice scanner has 64 detectors and can acquire 64 slices. The slice thickness to be acquired for each detector can be programmed, and this thickness multiplied by the number of detectors determines the z-axis span of patient anatomy that can be imaged during a single gantry rotation. For example, a 64-slice scanner, operating at maximum resolution (using the minimum slice thickness of 0.625 mm) can image 64 × 0.625 mm—or 40 mm—per rotation. Modern scanners have gantry rotation times under 1 second, so our 35-cm thorax could be completely imaged at maximum resolution in less than 9 seconds. If faster imaging is required, the slice thickness can be increased at the cost of some image resolution. For example, if the slice thickness is increased to 1 mm, a 64-slice scanner can cover 64 mm of z-axis per gantry rotation, and a 35-cm thorax would be imaged in fewer than 5.5 seconds. Such a fast acquisition means that the scanner can readily keep pace with the movement of the injected contrast bolus while acquiring detailed images of small thoracic structures. The extreme speed of 64-slice multidetector helical CT also eliminates many of the motion artifacts that plagued slower CT scanners, including motion artifacts from cardiac and respiratory motion and patient body movement. This, in turn, dramatically improves the diagnostic ability of CT for subtle pulmonary embolism, aortic dissection, and cardiac abnormalities including coronary artery disease. Because of their high spatial resolution and high image acquisition speed, 64-slice CT scanners allow more coronary artery segments to be assessed accurately, according to meta-analyses comparing 4-, 16-, and 64-slice CT. Klass et al. reported that 256-slice CT scanners provide assessment of 98.9% of coronary artery segments, compared with 95.6% for 64-slice CT.
We have simplified the preceding discussion slightly for clarity. Image quality is not determined solely by slice thickness. The CT x-ray tube voltage and current can also be modulated. Higher voltage and current result in more energy, improving the signal-to-noise ratio. This improves image quality, but it does so at the expense of increased patient radiation exposure—a topic that we explore in more detail later in this chapter. The potential benefits of an improved image must be weighed against this risk.
Electrocardiogram Gating
Fast CT imaging with multidetector CT can be modified further with the use of ECG gating. Not all CT scanners have this capability, although most modern scanners do. Without ECG gating, the CT scanner acquires images in a rapid and continuous helical motion, without regard to the phase of the cardiac cycle. Respiratory and cardiac motion occurs, but the speed of the CT acquisition is relied upon to minimize motion artifact. In ECG gating, the acquisition of CT images is timed to coincide with a particular phase of the cardiac cycle. For evaluation of coronary artery patency and course, diastole is the preferred moment of the cardiac cycle for several reasons. First, during late diastole, cardiac motion is minimized. Second, coronary artery perfusion is maximized during diastole, when the aortic valve is closed. Third, like cardiac motion, external compression of coronary arteries by the contracting myocardium is minimized during diastole. This reduces the likelihood of overestimating the degree of coronary artery stenosis. With ECG gating, CT images are typically acquired at a point 75% from the origin of the R–R interval.
ECG gating can be performed prospectively or retrospectively ( Figure 8-1 ), each technique with its advantages and disadvantages. In prospective ECG gating, CT images are acquired solely during an end-diastole, as described earlier. The method requires the software to recognize the R wave and to predict the occurrence of the next QRS complex; consequently, a regular cardiac rhythm is desirable, although software advances allow gating of even moderately irregular rhythms. The technique acquires a frozen snapshot of the heart with minimal motion artifact and is useful for evaluation of coronary arteries and static features of cardiac anatomy. The method requires reverting to the original step-and-shoot acquisition described earlier, rather than using helical acquisition. Multiple detectors are employed to capture numerous image slices (or data volumes) during each end-diastolic period. An advantage of this technique is a significant reduction in radiation exposure, compared with retrospective gating, which is described later. The CT x-ray source is only turned on during the brief moment of an end-diastolic period, so the total time of radiation exposure is substantially shortened, proportionally reducing the radiation dose. A disadvantage of this technique is that images of the heart during other phases of cardiac contraction are not recorded. Consequently, functional evaluation of cardiac contractility (ejection fraction or valvular motion) cannot be performed, and movie images of cardiac contraction cannot be generated.
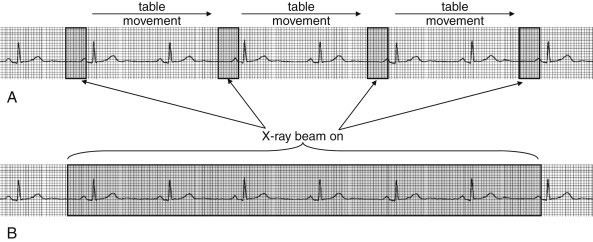
In retrospective ECG gating, images are acquired throughout the cardiac cycle. Acquired image data is encoded with the phase of cardiac contractility based on the ECG. After image acquisition is completed, images representing a particular phase of the cardiac cycle can be viewed as a static study. This allows images representing an end-diastolic period to be isolated, allowing evaluation of coronary arteries. In addition, images throughout the cardiac cycle can be viewed as a video, allowing assessment of cardiac motion and function (so-called four-dimensional imaging because of the ability to observe images through time). Regional wall motion abnormalities representing areas of ischemia or infarction can be identified, just as with echocardiographic images. Valvular abnormalities can be recognized. While the additional information provided by retrospective ECG gating makes it an attractive option, this information comes at the price of a significant increase in radiation exposure relative to prospective ECG gating. In older patients, this radiation exposure may be of limited consequence, but it is a significant concern in younger patients, as discussed later in this chapter.
Prospectively and retrospectively ECG-gated CT provide comparable coronary artery image quality, so the choice of one strategy over the other should weigh radiation dose against the need for functional information, remembering that ejection fraction, wall motion, and valvular mobility can be assessed without ionizing radiation exposure using echocardiography. Retrospective ECG-gated CT remains attractive because it can provide this information, along with coronary artery imaging, in a single diagnostic examination. However, in one study, prospectively ECG-gated CT reduced the radiation exposure by 77% compared with retrospective gating, from 18.1 to 4.2 mSv. New protocols can reduce the radiation exposure from CT further using a technique called dose modulation, which combines features of prospective and retrospective ECG gating. The x-ray source remains on during the entire scan, allowing time-resolved information about cardiac function to be gleaned throughout the cardiac cycle. However, the x-ray tube current is reduced except during the key phase of an end-diastolic period, when high signal-to-noise ratio is critical to imaging of coronary arteries.
Cardiac Computed Tomography Clinical Applications
With this technical background let’s consider the clinical applications of cardiac CT. We review the information provided by various cardiac CT protocols, comparing this information to that provided by other test modalities. In some cases, CT provides the same information as that afforded by one or even multiple alternative tests. In other instances, CT may provide information unavailable from other modalities, even the “gold standard” of cardiac catheterization.
As we briefly mentioned at the beginning of this chapter, CT can be performed for several critical diagnostic functions:
- 1.
Coronary artery calcium scoring
- 2.
Coronary angiography to determine the degree and location of artery stenosis and the presence of anomalous coronary arteries
- 3.
Assessment of structural heart disease (ventricular size and function and valvular and pericardial disease)
- 4.
Assessment of adjacent thoracic structures, including the pericardium, aorta, and pulmonary arteries
Not every CT necessarily addresses all of these functions—the protocol can be varied to provide more or less information, with additional data requiring a higher radiation dose and vascular contrast exposure. Table 8-1 summarizes the diagnostic information provided by cardiac CT in comparison with other modalities.
Let’s consider each of these CT functions in detail.
Coronary Artery Calcium Scoring
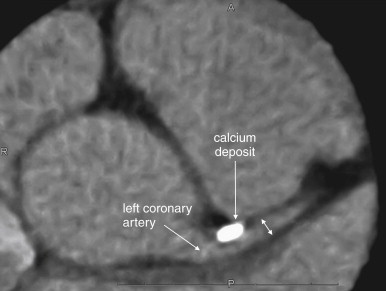
CT can quantify coronary artery calcifications ( Figure 8-2 ). Coronary artery calcium scores gained popularity in the late 1990s and early 2000s as a result of the observation that calcium deposits in coronary arteries correlated with the risk for obstructive coronary artery disease. Calcium deposits are visible without the use of injected contrast and appear bright white on CT. Scores are rated from 0 (no calcifications) to 1000 and greater, with scores greater than 400 denoting significant coronary artery calcium. An advantage of this technique is that it can be used in patients with contraindications to iodinated contrast, such as allergy or renal insufficiency. When coronary artery calcium scores are compared with the presence of coronary artery luminal stenoses detected by CT coronary angiography, a rising coronary artery calcium score is correlated positively with the presence of significant luminal stenosis (greater than 60%). The absence of coronary calcifications is strongly correlated with the absence of significant coronary artery disease.
Unfortunately, coronary artery calcifications are relatively nonspecific and may occur in the absence of luminal stenosis; therefore, they do not readily guide decisions about the need for coronary artery interventions without additional imaging. For example, Ho et al. found that in patients with the highest coronary calcium scores (greater than 1000), the prevalence of significant coronary artery stenosis was only 27%. While the absence of coronary artery calcifications may signify a low risk for significant coronary artery disease, the presence of calcifications is so nonspecific that the use of calcium scores to evaluate a low-risk chest pain population for coronary artery disease would be expected to result in numerous false positives, with the potential for additional expensive and potentially invasive diagnostic and therapeutic procedures. As the American College of Cardiology Foundation/American Heart Association (ACCF/AHA) Expert Consensus Document on Coronary Artery Calcium Scoring notes, 12,13 “The relation of arterial calcification, like that of angiographic coronary artery stenosis, to the probability of plaque rupture is unknown. There is no known relationship between vulnerable plaque and coronary artery calcification.” Nonetheless, the ACCF/AHA 12,13 concluded that in patients with atypical chest pain and a low risk for coronary artery disease, a calcium score of zero can be used to “help in ruling out the presence of obstructive coronary disease,” citing negative predictive values of 96% to 100% in studies of more than 7600 symptomatic patients. The ACC/AHA also noted that coronary artery calcium scores have not been compared extensively head to head with other diagnostic strategies, so the choice of calcium scoring over other strategies must be made with little evidence.
CT Coronary Angiography
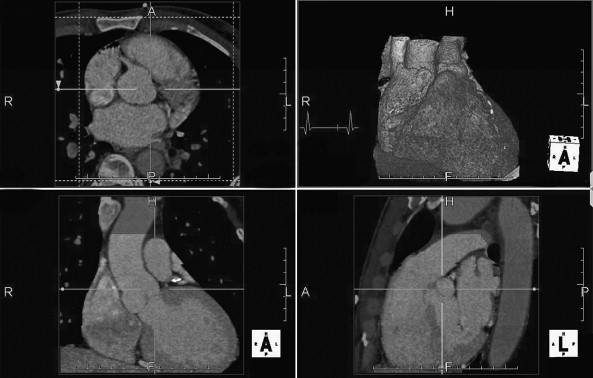
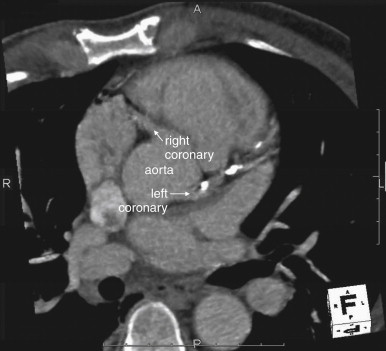
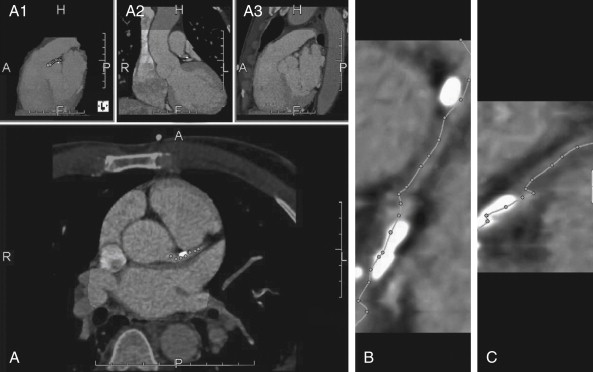
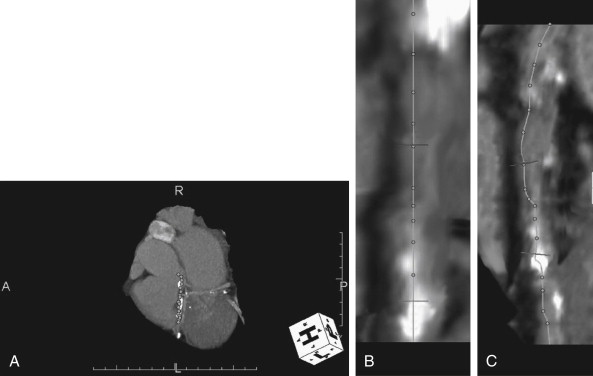
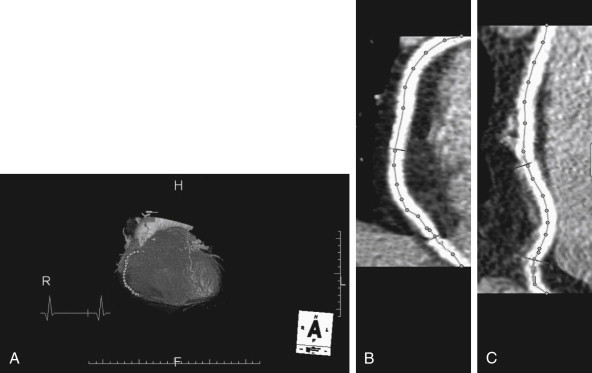
CT coronary angiography with intravenous (IV) contrast improves upon CT coronary artery calcium scoring by allowing measurement of coronary artery luminal diameter in the same way as conventional digital subtraction coronary angiography. The precise location and degree of coronary artery stenosis can be graded, with greater than 50% stenosis being considered clinically significant. CT images are acquired with either prospective or retrospective ECG gating, as described earlier. The images are typically viewed using specialized software, allowing synchronous viewing of axial, coronal, sagittal, and three-dimensional images ( Figure 8-3 ). Software allows the user to plot the course of a coronary artery, select a normal and a stenotic arterial segment for comparison, and perform calculations of the degree of stenosis. Tortuous coronary arteries can be reconstructed in a “straightened” or “curved planar” view to improve visual assessment of the degree of stenosis. Thin-slab maximum intensity projection images (MIPSs) ( Figure 8-4 ) also allow improved assessment of vessels that would be incompletely visualized on a single axial, coronal, or sagittal image because of their oblique or tortuous course. The AHA has defined a standardized 15-segment system of evaluation of coronary arteries, with CT allowing inspection of the main coronary arteries and their major branches from their origin down to a diameter of 1.5 mm. Figures 8-5 through 8-7 depict CT evaluation of coronary artery stenosis.
Mechanism of CT Coronary Angiography in Evaluating Coronary Arteries for Stenosis
Like conventional coronary angiography, CT coronary angiography is a nonstress test. The patency of the coronary arteries is directly assessed, and the patient need not be placed under physiological stress to induce ischemia, unlike modalities such as stress echocardiography, stress nuclear perfusion scanning, stress cardiac magnetic resonance imaging (MRI), and ECG stress testing. Because CT does not risk inducing or worsening existing ischemia or infarction, a patient can undergo CT coronary angiography immediately, even with ongoing symptoms, and without an observation period for serial cardiac biomarker measurement and serial ECGs. Like conventional coronary angiography, the method should be safe even in patients with active ischemia or infarction—though emergency physicians should strive to recognize those patients from factors such as ECG findings without use of CT, because these patients may benefit from rapid conventional coronary angiography with its therapeutic revascularization potential. Many of the putative benefits of CT coronary angiography are based upon its nonstress mechanism, the ability to perform the test immediately, and the consequent ability to discharge patients with normal CT findings without prolonged observation or admission. We discuss some research findings supporting the cost- and resource-effectiveness of CT later. The nonstress capability of CT is not always an advantage. CT may identify stenotic arteries that are not responsible for inducible ischemia, because current CT coronary angiography does not test for abnormal myocardial perfusion during physiological stress. A new but not yet widely available technique called CT myocardial perfusion scanning is discussed later; this can be performed as a nonstress test or with the use of pharmacologically induced stress. Because current CT coronary angiography does not assess the functional perfusion deficit resulting from a stenotic region, it might result in detection of asymptomatic coronary artery disease and lead to unnecessary invasive revascularization procedures—a problem similar to that encountered with conventional coronary angiography. In a study of asymptomatic patients undergoing CT coronary angiography, significant stenoses were found in 16% of nondiabetics and 22% of diabetics. Whether detection and stenting of these asymptomatic lesions would improve mortality is uncertain.
Accuracy of CT
With submillimeter spatial resolution, ECG-gated 64-slice CT can visualize coronary arteries in exquisite detail ( Figures 8-5 through 8-7 ) along much of their course, including 93% to 98% of proximal segments, 86% to 88% of proximal and middle segments, and 65% to 75% of all coronary artery segments. A systematic review found that 64-slice CT was more than 90% sensitive and 88% specific for the presence of significant coronary artery disease in patient-based evaluations. Patient-based refers to studies determining whether a given patient does or does not have coronary artery disease, rather than assessing for the presence of disease in a given vessel or vessel segment. This is a somewhat less stringent standard than a vessel-based comparison, because a CT scan that detects disease in one vessel when multivessel disease is found by conventional coronary angiography (or vice versa) is still credited as reaching the correct diagnosis. However, this is an acceptable standard from an emergency medicine perspective, where the clinically relevant decision point is the presence or absence of significant coronary artery disease in a given patient. The negative predictive value of 64-slice CT coronary angiography is consistently 96% to 100%, whereas positive predictive values range as low as 69% in some studies. The positive likelihood ratio of CT is 8.0, with a negative likelihood ratio below 0.1. Recall that negative likelihood ratios less than or equal to 0.1 are considered strong evidence of the absence of a disease and positive likelihood ratios of 10 or greater are useful to confirm a disease process. Therefore a negative CT coronary angiogram is a useful tool to rule out the presence of clinically important coronary artery disease, whereas a positive CT may require further diagnostic confirmation resulting from lack of specificity.
Measurement of Coronary Artery Stenosis
CT allows quantitative measurement of luminal cross section to determine the percentage of stenosis. This may be more accurate than visual estimates of stenosis that are commonly performed with conventional coronary angiography, a method that has been shown to be inaccurate in determining the physiologic impact of moderate stenoses (<60% stenosis), with both over-estimation and underestimation of severity. CT is nonetheless likely “operator dependent.” In many CT software applications, software calculates the percentage of stenosis automatically—but only after a technician selects the location of the stenotic lesion and a normal coronary segment for comparison. As a consequence, the computer calculations are precise, but their accuracy depends partly on the accuracy of the human technician in selecting the normal and abnormal arterial segments. Sato et al. found that quantitative measures of stenosis from CT coronary angiography were only 79% sensitive but 92% specific for ischemia when a threshold of 70% stenosis was used. If stenosis less than 60% was observed by CT angiography, ischemia was rare. However, the criterion standard in this study was stress 201Tl single photon emission CT, a nuclear perfusion imaging technique that itself is not 100% sensitive or specific. This highlights the difficulty in evaluating new tests for cardiac ischemia, when the new test modality might theoretically be superior to existing standard tests.
How Does CT Coronary Angiography Compare with Noninvasive Stress Testing Modalities in Identifying Ischemia?
Earlier, we described the diagnostic accuracy of CT compared with the criterion standard of conventional coronary angiography. However, in the emergency department, the choice of diagnostic testing generally is not between CT and conventional angiography but between CT and a variety of stress testing modalities, such as stress echocardiography, stress nuclear perfusion testing, and stress cardiac MRI. The accuracy of CT compared with these diagnostic modalities remains in debate ( Table 8-2 ). All are subject to false-positive and false-negative results, resulting in unnecessary invasive procedures and undiagnosed significant disease, respectively. CT provides precise anatomic visualization of the ischemia-related artery, whereas echocardiography, MRI, nuclear medicine studies, and ECG stress testing identify the heart region with inducible ischemia—which generally predicts the stenotic artery. For example, in an ECG stress test, ST segment depression in inferior ECG leads suggests ischemia of the inferior wall of the left ventricle, which is most often supplied by the right coronary artery. In a stress echocardiogram, inferior wall hypocontractility during stress testing would also suggest ischemia and disease of the right coronary artery. CT would directly demonstrate stenosis of this vessel.
| Modality | Sensitivity ∗ | Specificity | Radiation Exposure |
|---|---|---|---|
| Conventional coronary angiography | Gold standard | Gold standard | Median exposure is 3.3 mSv for diagnostic angiography alone |
| CT coronary angiography (64 slice) | 93% | 96% | As much as 19 mSv, depending on technique |
|
|
| None |
| Stress nuclear perfusion scan | 80%-90% | 50%-70% | 10 mSv |
| Exercise stress echocardiography | Varies depending on number of affected vessels: 58%-94% | 70%-88% | None |
| ECG exercise stress testing | 74% | 69% | None |
Stay updated, free articles. Join our Telegram channel

Full access? Get Clinical Tree


