Emergency physicians frequently evaluate patients with complaints requiring brain imaging for diagnosis and treatment. The diversity of imaging modalities and variations of these modalities may be daunting, creating uncertainty about the most appropriate, sensitive, and specific modality to evaluate the presenting complaint. An evidence-based approach is essential, with modality and technique chosen based on patient characteristics and differential diagnosis. In this chapter, we begin with a brief summary of computed tomography (CT) and magnetic resonance (MR) technology. Next, we present a systematic approach to interpretation of head CT, along with evidence for interpretation by emergency physicians. Then, we discuss the cost and radiation exposure from neuroimaging, as these are important reasons to limit imaging. We review the evidence supporting the use of CT and magnetic resonance imaging (MRI) for diagnosis and treatment of emergency brain disorders, concentrating on clinical decision rules to target imaging to high-risk patients. We also consider adjunctive imaging techniques, including conventional angiography, plain films, and ultrasound. By chapter’s end, we consider the role of neuroimaging in the evaluation of headache, transient ischemic attacks (TIAs) and stroke, seizure, syncope, subarachnoid hemorrhage (SAH), meningitis, hydrocephalus and shunt malfunction, and head trauma.
Neuroimaging Modalities
Indications for neuroimaging are diverse, including traumatic and nontraumatic conditions ( Table 1-1 ). The major brain neuroimaging modalities today are CT and MRI, with adjunctive roles for conventional angiography and ultrasound. Plain films of the calvarium have an extremely limited role, as they can detect bony injury but cannot detect underlying brain injury, which may be present even in the absence of fracture.
| Clinical Indication | Differential Diagnosis | Initial Imaging Modality |
|---|---|---|
| Headache | Mass, traumatic or spontaneous hemorrhage, meningitis, brain abscess, sinusitis, hydrocephalus | Noncontrast CT |
| Altered mental status or coma | Mass, traumatic or spontaneous hemorrhage, meningitis, brain abscess, hydrocephalus | Noncontrast CT |
| Fever | Meningitis (assessment of ICP), brain abscess | Noncontrast CT |
| Focal neurologic deficit—motor, sensory, or language deficit | Mass, ischemic infarct, traumatic or spontaneous hemorrhage, meningitis, brain abscess, sinusitis, hydrocephalus | Noncontrast CT, possibly followed by MRI, MRA, or CTA, depending on context |
| Focal neurologic complaint—ataxia or cranial nerve abnormalities | Posterior fossa or brainstem abnormalities, vascular dissections | MRI or MRA of brain and neck; CT or CTA of brain and neck if MR is not rapidly available |
| Seizure | Mass, traumatic or spontaneous hemorrhage, meningitis, brain abscess, sinusitis, hydrocephalus | Noncontrast CT, possibly followed by CT with IV contrast or MR |
| Syncope | Trauma | Little indication for imaging for cause of syncope, only for resulting trauma |
| Trauma | Hemorrhage, mass effect, cerebral edema | Noncontrast CT—if clinical decision rules suggest need for any imaging |
| Traumatic loss of consciousness | Hemorrhage, DAI, mass effect, cerebral edema | Little indication when transient loss of consciousness is isolated complaint |
| Planned LP | Increased ICP | Noncontrast head CT—limited indications |
Computed Tomography
CT has been in general clinical use in emergency departments (EDs) in the United States since the early 1980s. The modality was simultaneously and independently developed by the British physicist Godfrey N. Hounsfield and the American Allan M. Cormack in 1973, and the two were corecipients of the Nobel Prize for Medicine in 1979. Advances in computers and the introduction of multislice helical technology (described in detail in Chapter 8 in the context of cardiac imaging) have dramatically enhanced the resolution and diagnostic utility of CT since its introduction. CT relies on the differential attenuation of x-ray by body tissues of differing density. The image acquisition occurs by rapid movement of the patient through a circular gantry opening equipped with an x-ray source and multiple detectors. A three-dimensional volume of image data is acquired; this volume can be displayed as axial, sagittal, or coronal planar slices or as a three-dimensional image. CT does raise some safety concerns with regard to long-term biologic effects of ionizing radiation and carcinogenesis, which we describe later. The radiation exposure to the fetus in a pregnant patient undergoing head CT is minimal. Most commercially available CT scanners have a weight capacity of approximately 450 pounds (200 kg), although some manufacturers now offer units with capacities up to 660 pounds (300 kg). Portable dedicated head CT scanners with acceptable diagnostic quality and no weight limits are now available.
Noncontrast Head CT
Noncontrast CT is the most commonly ordered head imaging test in the ED, used in up to 12% of all adult ED visits. It provides information about hemorrhage, ischemic infarction, masses and mass effect, ventricular abnormalities such as hydrocephalus, cerebral edema, sinus abnormalities, and bone abnormalities such as fractures. Although dedicated facial CT provides more detail by acquiring thinner slices through the region of interest or by changing the patient’s position in the scanner during image acquisition, general information about the face and sinuses can be gleaned from a generic noncontrast head CT, as described in detail in Chapter 4 on facial imaging. The American College of Radiology recommends acquisition of contiguous or overlapping slices with slice thickness no greater than 5mm. For imaging of the cranial base, the ACR recommends the thinnest slices possible. If multiplanar or three-dimensional reconstruction is planned, slice thickness should be as thin as possible and no greater than 2-3 mm.
Contrast-Enhanced Head Computed Tomography
Contrast-enhanced head CT is usually performed following a noncontrast CT, and the two are then compared. In a contrast-enhanced head CT, IV contrast is injected, usually through an upper extremity intravenous catheter. A time delay is introduced to allow the venous contrast to pass to the brain. Depending on the delay between contrast injection and image acquisition, the resulting CT may be a CT cerebral angiogram (CTA) or a CT cerebral venogram (CTV). The CT data may be reconstructed in any of several planes (typically axial, sagittal, or coronal) or even three-dimensionally. Cerebral perfusion can be mapped with IV contrast, using a technique described in more detail later. Contrast CT is useful for depicting abnormal vascular structures, such as aneurysms or arteriovenous malformations; for demonstrating abnormal failure of filling of vascular structures, such as sagittal sinus thrombosis (akin to demonstrating a filling defect in chest CT for pulmonary embolism); and for demonstrating neoplastic, inflammatory, and infectious processes. These latter abnormalities typically have increased regional blood flow, consequently receive abnormally high levels of vascular contrast agents, and may demonstrate ring enhancement, a circumferential increase in density around a lesion on CT occurring after IV contrast administration.
Magnetic Resonance
MR has been in wide clinical use in the United States since the late 1980s. The modality was coinvented by the American Paul C. Lauterbur and the British physicist Sir Peter Mansfield, who shared the 2003 Nobel Prize in Medicine for their work. MR allows imaging of the brain by creating variations in the gradient of a magnetic field and analyzing the radio waves emitted in response by hydrogen ions (protons) within the field. MR provides outstanding soft-tissue contrast that is superior to that obtained from CT. MR can be performed with or without intravenous contrast agents. Advantages of MRI include the noninvasive nature of the test and its apparent safety in pregnancy. It does not employ ionizing radiation and has no known permanent harmful biologic effects. Traditionally, contraindications have been thought to include the presence of ferromagnetic material within the body, including electronic devices such as pacemakers or metallic debris such as shrapnel, especially in sensitive structures such as the eye or brain. However, there are now more than 230 published prospective cases of patients with pacemakers safely having undergone low-field MRI, so MRI may be an imaging option in these patients. Magnetic effects on tattoos, including first-degree burns and burning sensation, have been reported, although these appear rare and more likely to interfere with completion of MR than to cause significant harm.
Can Emergency Physicians Accurately Interpret Head CT Images? What Are the Potential Benefits to Patients?
Head CT is rapid to obtain, but delays in interpretation could result in adverse patient outcomes if clinical treatment decisions cannot be made in a timely fashion. Surveys of emergency medicine residency programs suggest that, in many cases, radiology interpretation is not rapidly available for clinical decisions and that emergency physicians often perform the initial interpretation of radiographic studies. A study simulating a teleradiology support system estimated the time to interpretation of a noncontrast head CT at 39 minutes, potentially wasting precious time in patients with intracranial hemorrhage or ischemic stroke. The ability of the on-scene emergency physician to interpret the CT could be extremely valuable.
Multiple studies have examined the ability of emergency medicine residents and attending physicians to interpret head CT. A 1995 study showed that in an emergency medicine residency program, although up to 24% of potentially significant CT abnormalities were not identified by the emergency medicine residents, only 0.6% of patients appear to have been mismanaged as a result. Studies have shown that substantial and sustained improvements in interpretation ability can occur with brief training. Perron et al. showed an immediate improvement from 60% to 78% accuracy after a 2-hour training session based on a mnemonic, sustained at 3 months. In the setting of stroke, emergency medicine attending physicians perform relatively poorly in the recognition of both hemorrhage and early ischemic changes, which may contraindicate tissue plasminogen activator (t-PA) administration, with accuracy of approximately 60%. However, neurologists and general radiologists achieve only about 80% accuracy compared with the gold-standard interpretation by neuroradiologists. Undoubtedly, improvements in training are needed, but the pragmatic limitations on the availability of subspecialist radiologists, even with teleradiology, mean that emergency physicians must become proficient first-line readers of emergency CT.
Interpretation of Noncontrast Head CT
Several systematic methods for interpretation of noncontrast head CT have been described. The mnemonic “Blood Can Be Very Bad” has been shown to assist in the sustained improvement of interpretation by emergency medicine residents. The mnemonic reminds the interpreter to look for blood (blood), abnormalities of cisterns and ventricles ( can and very, respectively), abnormalities of the brain parenchyma (be), and fractures of bone (bad).
Broder used the familiar ABC paradigm to drive the assessment of the head CT (see “A Mnemonic for Head CT Interpretation: ABBBC”).
Hounsfield Units and Windows
The density of a tissue is represented using the Hounsfield scale, with water having a value of zero Hounsfield units (HU), tissues denser than water having positive values, and tissues less dense than water having negative values ( Figure 1-1 ). By convention, low-density tissues are assigned darker (blacker) colors and high-density structures are assigned brighter (whiter) colors. Because the human eye can perceive only a limited number of gray shades, the full range of density values is typically not displayed for a given image. Instead, the tissues of interest are highlighted by devoting the visible gray shades to a narrow portion of the full density range, a process called “windowing” ( Figures 1-1 and 1-2 ). The same image data can be displayed in different window settings to allow evaluation of injury to different tissues. In general, head CT images are viewed on brain or bone windows to allow most emergency pathology to be assessed (see Figure 1-2 ).


Bone windows are useful for evaluation in the setting of trauma. By shifting the gray scale to center on the range of densities typical of bone bone windows allow detection of abnormalities such as subtle fracture lines. At the same time, they sacrifice detailed evaluation of structures less dense than bone (brain, cerebrospinal fluid, and blood vessels). Air remains black on bone windows and can be readily identified—for example, intracranial air can easily be seen on bone window settings. Sinus spaces are also nicely delineated on bone windows because of the contrast between air (black) and all other tissues (gray shades).
Brain windows are useful for evaluation of brain hemorrhage, fluid-filled structures including blood vessels and ventricles, and air-filled spaces. The majority of our evaluations will be done using this window setting. On brain windows, bone and other dense or calcified structures (e.g., surgical clips and calcified pineal glands) all appear bright white, and internal detail of these high-density structures is lost.
Right–Left Orientation of Computed Tomography Images
By convention, axial CT images are displayed with the patient’s right side on the left side of the video screen or printed image. The point of view is as follows. Imagine yourself standing at the foot of the CT gantry, gazing toward the patient’s head, with the patient positioned supine. Your left hand is placed on the patient’s right foot. The patient is virtually “sectioned” into slices like a loaf of bread( Figure 1-3 ).

Brain Symmetry
The brain, air and cerebrospinal fluid (CSF) spaces and the surrounding bone are normally symmetrical structures ( Figure 1-4 ; see also Figures 1-7 and 1-19 ). A head CT should be inspected for normal symmetry, as deviation from this norm often indicates pathology ( Figure 1-5 ; see also Figure 1-4 ). If the patient’s head is not centered symmetrically in the CT gantry, the resulting images can create a false sense of asymmetry. It is critical to note that some life-threatening pathological conditions such as diffuse subarachnoid hemorrhage, cerebral edema, and hydrocephalus can have a symmetrical CT appearance, so symmetry does not guarantee normalcy.

Abnormal Asymmetry: Mass Effect and Midline Shift
The compression or displacement of normal brain structures (including ventricles and sulci) by adjacent masses is called mass effect. This displacement may occur due to tumor, hemorrhage, edema, or obstruction of CSF flow, to name but a few common causes. When this effect becomes extreme, shift of brain structures across the midline of the skull can occur, a finding called midline shift. Midline shift can indicate significant pathology, including threatened subfalcine herniation ( Figure 1-5 ), and it should be carefully sought, as it may be more important than the underlying etiology of the shift in determining initial management. The degree of displacement of structures across the normal midline of the brain can be easily measured using digital tools on the picture archiving and communication system (PACS), a computer viewing system. Midline shift may have some prognostic value in determining the likelihood of regaining consciousness after surgical decompression; patients with significant shift, greater than 10 mm, are more likely to benefit from decompression than are those with lesser degrees of shift. Patients with shift of 5 mm or greater are more likely to have neurologic deficits requiring long-term supervision than are those with lesser midline shift. Midline shift is also linked to probability of death after traumatic brain injury. Published guidelines on surgical indications for brain lesions include midline shift as one of several parameters (as shown later), so recognizing and measuring midline shift is important.

Artifacts: Motion and Metal
A brain CT should be examined for artifacts that may limit interpretation, including motion and streak artifact or beam-hardening artifact from high-density structures such as metal ( Figure 1-6 ). Although artifact may degrade the overall quality of the study, useful diagnostic information can often still be gleaned from an imperfect scan. Modern CT scanners acquire images at a very fast rate—a 64-slice CT can scan the entire brain in approximately 5 seconds. As a consequence, CT is less subject to motion artifact than in the past, although significant patient motion may still render images uninterpretable. Just as in standard photographs, motion results in a blurry CT image.

Very dense objects create distortion on CT, called streak artifact. Examples include implanted metallic devices, such as cochlear implants and dental fillings; metallic foreign bodies, such as bullets; and even dense bone, such as occipital bone surrounding the posterior fossa. These artifacts may make it difficult or impossible to identify pathologic changes in the region (see Figure 1-6 ).
A Mnemonic for Head CT Interpretation: ABBBC
A systematic approach to interpretation of head CT is necessary to avoid missing important abnormalities. We review one approach, with a discussion of the normal appearance of the brain. Although a detailed understanding of neuroanatomy will improve your head CT interpretation, our mnemonic avoids significant anatomic detail, as many clinical decisions don’t require this level of sophistication. Table 1-2 gives an overview of the mnemonic, with images illustrating each finding in the figures that follow.
| Assess These Structures… | For Signs of This Pathology |
|---|---|
|
|
| Bones | Fractures |
| Blood |
|
| Brain |
|
|
|
A Is for Air Spaces
Our mnemonic starts with A, for air-filled spaces in the head. The normal head contains air-filled spaces: the frontal, maxillary, ethmoid, and sphenoid sinuses and the mastoid air cells ( Figure 1-7 ). Opacification of an air space may occur because of fluids such as pus, mucus, or blood; mucosal edema; or because of tumor invasion of the space. In the setting of trauma, opacification of an air space may indicate bleeding into that space, raising suspicion of a fracture of the surrounding bone ( Figure 1-8 ). In the absence of trauma, opacification may indicate sinus infection or inflammation, although this is a nonspecific finding that may require no treatment in the absence of symptoms.


Normal air spaces appear black on either brain or bone windows, because air has the lowest Hounsfield density, negative 1000 HU. The frontal, maxillary, ethmoid, and sphenoid sinuses are normally air-filled, with no thickening of mucosa or air–fluid levels. The mastoid processes are normally spongy bone filled with tiny pockets of air, the mastoid air cells. If these air spaces become partially or totally opacified with fluid, this is easily recognized as a gray shade. Dense bone surrounding the small mastoid air cells creates a “bloom artifact” that can obscure the actual air spaces when viewed on brain windows, making assessment for abnormal fluid more difficult. This is minimized by viewing this region using bone windows. Abnormal fluid appears gray on this setting as well. The relatively small ethmoid air cells are also best-assessed for fluid using bone windows. For larger air-spaces, bloom artifact is minimal and brain or bone windows will usually reveal fluid. Recognizing abnormalities of normally air-filled structures requires some basic knowledge of their normal location and configuration (see Figure 1-7 ). Box 1-1 summarizes abnormalities of sinus air spaces, which are discussed in more detail later.
Sinus Trauma
Facial fractures are discussed in more detail in the dedicated chapter on facial imaging ( Chapter 2 ). In trauma, fractures through the bony walls of sinuses result in bleeding into the sinus cavity. While the trauma patient remains in a supine position, this blood accumulates in the dependent portion of the sinus, forming an air–fluid level visible on CT. Previously existing sinus disease may be visible as circumferential sinus mucosal thickening, rather than as an air–fluid level. Inspect the sinuses carefully for air–fluid levels, as these may indicate occult fractures. In trauma, opacification of sinuses should be considered evidence of fracture until proven otherwise, as the fracture itself may be hard to identify ( Figures 1-8 and 1-9 ). The ethmoid sinuses are small and may be completely opacified by blood in the event of fracture. Opacified ethmoid sinuses should increase suspicion of a medial orbital blowout fracture. Air–fluid levels in the maxillary sinus may be associated with inferior orbital blowout fractures, because the inferior wall of the orbit is the superior wall of the maxillary sinus. The frontal sinus is less easily fractured, as its anterior and posterior plates are thick and resistant to trauma. Fracture of the anterior wall of the frontal sinus is relatively less concerning, requiring plastic surgery or otolaryngology consultation. Fracture of the posterior wall of the frontal sinus is a potential neurosurgical emergency due to communication of the sinus space with the CSF. Look for intracranial air whenever frontal
- •
Window setting: Bone windows helpful for smaller air-space evaluation.
- •
CT Appearance: Normally air filled (black), no air–fluid levels
- •
Significance
- ○
Air–fluid levels or opacification in the setting of trauma may indicate fracture.
- ○
In the absence of trauma, air–fluid levels or mucosal thickening may be too sensitive and should not necessarily be equated to bacterial sinusitis in the absence of strong clinical evidence.
- ○
Mastoid opacification without trauma may indicate mastoiditis when clinical signs and symptoms are present.
- ○

Sinus Infections
In the absence of trauma, sinus mucosal thickening and air–fluid levels may be normal findings. They should not be used to make a diagnosis of bacterial sinusitis in the absence of strong clinical evidence, as they are nonspecific and may occur in allergic sinusitis or even asymptomatic patients. The mastoid air cells are not normally fluid filled, and in the presence of mastoid tenderness and erythema, their opacification on CT is evidence of mastoiditis ( Figure 1-10 ). Sinus infections are discussed in more detail in Chapter 2 , Imaging the Face.

B Is for Bone
The first B in our mnemonic is for bone. Following trauma, bony fractures should be suspected, although they are often of less clinical significance than any underlying brain injury. Abnormalities of bone including acute fractures are best identified on bone windows. Defects in the cortex of bone may indicate fracture, but these must be distinguished from normal suture lines ( Figure 1-11 ). Comparing the contralateral side to the side in question may help to distinguish fractures from normal sutures. Air–fluid levels within sinuses following trauma are likely blood resulting from fracture (see Figures 1-8 and 1-9 ). Pneumocephalus (air within the calvarium) may also be present and may provide an additional clue to fractures communicating with sinus spaces or the outside world ( Figures 1-12 and 1-13 ). Air may take the form of large amorphous collections abutting the calvarium or small black spheres within hemorrhage associated with the fracture.


When a fracture is identified, look carefully for associated brain abnormalities using brain windows. Inspect for any of the types of hemorrhage described later. Look for soft-tissue swelling outside the calvarium overlying the fracture.
B Is for Blood
The second B in our mnemonic is for blood. A brain CT should be carefully inspected for the presence of subarachnoid, epidural, subdural, and intraparenchymal blood using brain windows. Multiple hemorrhage types may coexist. On noncontrast head CT, acute hemorrhage appears hyperdense (brighter or whiter) compared with brain tissue. As time elapses, blood darkens, indicating lower density. This is likely due to a number of factors, including the absorption of water by hematoma, changes in oxidation state, and the dispersion of blood within the subarachnoid space. As discussed later, the sensitivity of CT to detect subarachnoid hemorrhage is thought to decline as time elapses from the moment of hemorrhage. Debate exists about the accuracy of CT in dating blood.
Hemorrhage can occur in any of several spaces within or around the brain. The shape of blood collections on CT depends on the anatomic location, as described in the sections that follow.
Subarachnoid Hemorrhage
SAH is blood within the subarachnoid space, which includes the sulci, Sylvian fissure, ventricles, and basilar cisterns surrounding the brainstem ( Figure 1-14 ).

Fresh SAH appears white, although the appearance varies depending on the ratio of blood to CSF. CT is believed to be greater than 95% sensitive for SAH within the first 12 hours but to decline to 80% or less after 12 hours. SAH may result from trauma or may occur spontaneously after rupture of an abnormal vascular structure such as an aneurysm. When looking for SAH, inspect the entire subarachnoid space, including the sulci, ventricles, Sylvian fissure, and cisterns for blood. Because subarachnoid blood may diffuse into adjacent regions, it may defy the guideline that hemorrhage and other abnormalities disturb normal brain symmetry. In other words, large amounts of SAH, including hemorrhage into cisterns, may actually result in a symmetrical-appearing head CT. Beware of this possibility when inspecting the brain for abnormalities. Familiarity with the black appearance of normal CSF spaces (see Figure 1-32 ) can help to avoid confusion. CSF spaces are reviewed in detail later with the “C” in our mnemonic. However, two CSF spaces deserve special mention here with respect to SAH. The suprasellar cistern lies just above the sella turcica (home of the pituitary gland) at the level of the brainstem. This cistern usually is CSF-filled and has the appearance of a symmetrical black “star.” When filled with blood, it appears as a symmetrical white star (see Figure 1-14 ). The quadrigeminal plate cistern is usually visible on the same axial CT slice and has the appearance of a black “smile” when filled normally with CSF. When filled with subarachnoid blood, it becomes a white “smile.”
As time elapses from the moment of hemorrhage, blood will diffuse through the subarachnoid spaces, like a drop of food coloring dropped into a glass of water. Thus a bright white punctate finding on head CT is not
- •
Appearance: White on brain windows
- •
Location: Localized or diffuse
- ○
Sulci
- ○
Fissures
- ○
Ventricles
- ○
Cisterns
- ○
- •
Shape: Assumes shape of surroundings
- •
Pearl: Suspect increased ICP, look for signs of diffuse edema
- •
Pearl: Look for abnormal white “star” sign and “smile” sign from SAH in suprasellar and quadrigeminal plate cisterns
Epidural Hematoma
Epidural hematoma (EDH) is a collection of blood lying outside the dura mater, between the dura and the calvarium. It is almost always a traumatic injury, commonly resulting from injury to the middle meningeal artery. Because blood is extravasating from an artery under high pressure, rapid enlargement of the hematoma may occur, leading to significant mass effect, midline shift, and herniation. The common CT appearance is a biconvex disc or lens, collecting in the potential space between the calvarium and the dura mater. This shape occurs because the more superficial aspect of the EDH conforms to the curve of the calvarium, while the inner aspect expands and presses into the dura. The dura is usually tethered to the calvarium at sutures, so EDHs usually do not cross suture lines on CT. EDHs may cross the midline, because there are no midline sutures in the frontal and occipital regions. The usual location of an EDH is temporal, although EDHs occasional occur in other locations. Transfalcine herniation may occur with EDHs, so the midline of the brain should be carefully inspected on CT for midline shift or compression of the lateral ventricle. The swirl sign, described as a bright white vortex or “swirl” within the EDH, has long been considered a finding of active bleeding and should be interpreted as a sign of continued expansion, although recent studies have questioned the prognostic significance of this finding. Figures 1-15 and 1-16 show several examples of EDHs, with the classic findings described earlier. Interestingly, the volume of hematoma has not been shown to correlate with preoperative neurologic status or 6-month postoperative status. Box 1-3 summarizes findings of EDH.

- •
Lenslike or biconvex disc shape
- •
Temporal location, with associated depressed temporal bone fracture
- •
No crossing of suture lines
- •
Mass effect with midline shift
- •
Swirl sign (heterogeneous appearance suggesting active bleeding)
- •
Elevated intracranial pressure, with small ventricles and no visible sulci

Indications for Surgery in Epidural Hematoma
Published criteria for surgical evacuation of an acute EDH include volume greater than 30 cm 3 (regardless of Glasgow Coma Score, or GCS). Many PACS toolkits allow automated computation of volumes from two-dimensional datasets by measuring the thickness of a structure or outlining it. For patients with a GCS greater than 8 and no focal deficit, an EDH smaller than 30 cm 3 , less than 15 mm thick, and with less than 5 mm of midline shift can be managed nonoperatively. Anisocoria with a GCS below 9 is an indication for surgery, regardless of EDH size.
Subdural Hematoma
Subdural hematoma (SDH) ( Figures 1-17 and 1-18 ) is a collection of blood between the dura mater and the brain surface. SDHs usually occur from traumatic injury to bridging dural veins, although a history of trauma is not always found. SDHs may be self-limited in size due to the lower pressure of venous bleeding, but they can become enormous, causing significant mass effect, midline shift, and herniation. They may also rebleed after an initial delay, resulting in expansion. Moreover, they are frequently markers of significant head trauma, and patient outcomes may be compromised by associated diffuse axonal injury (DAI) (described later) or edema. The typical CT appearance of an SDH is a crescent, with the convex side facing the calvarium and the concave surface abutting the brain surface. The shape of SDHs results from their accumulation between the dura and the brain surface. Because they lie between the dura and the brain, they are not restricted by attachment sites between the dura and the calvarium at sutures. Consequently, SDHs may cross suture lines. Moreover, each cerebral hemisphere is wrapped in its own dura, so SDHs typically do not cross the midline but instead may continue to follow the brain surface into the interhemispheric fissure.

- •
Crescent shape
- •
Crossing of suture lines
- •
Mass effect with midline shift
- •
Elevated intracranial pressure (ICP), with small ventricles
- •
No visible sulci (due to effacement from elevated ICP)

The color may vary depending on the age of the SDH (see Figure 1-18 ). Fresh subdurals are typically brighter white (or lighter gray) than the adjacent brain. Older
- •
CT Appearance: Variable white to gray on brain windows
- •
Location: peripheral to brain, variable but usually temporal region
- •
Shape: Biconvex disc or lens
- •
Pearl: Does not cross suture lines
- •
White swirl sign means active bleeding
- •
Significance: May cause mass effect and herniation
- ○
Look for midline shift
- ○
Look for effacement of ventricles and sulci
- ○
- •
Surgical indications : 15-mm thickness or 5-mm midline shift
Indications for Surgery in Subdural Hematoma
Published criteria for surgical evacuation of an acute SDH include thickness greater than 10 mm or midline shift greater than 5 mm, regardless of GCS. Surgery may be indicated with smaller SDHs and lesser degrees of shift in patients with a GCS score less than 9, based on intracranial pressure (ICP), pupillary findings, and worsening GCS.
Intraparenchymal Hemorrhage
Intraparenchymal hemorrhage ( Figures 1-19 and 1-20 ), or hemorrhage within the substance of the brain matter, may occur in trauma or spontaneously, perhaps as a complication of hypertension. The appearance is generally bright white acutely. The size may vary from punctate to catastrophically large, with associated mass effect and midline shift. For intraparenchmyal hemorrhage, mass effect such as midline shift or ventricular effacement should be assessed. Signs of increased ICP should be identified. Particularly for smaller punctate hemorrhages, care must be taken not to mistake hemorrhage for normal benign calcifications of the pineal gland, choroid plexus, and meninges, or vice versa. Calcifications can usually be distinguished from hemorrhage as the former remain bright white on bone windows. In addition, if the density is measured with PACS tools, calcifications have very high density, near +1000HU, while hemorrhage has a density around +40 to +70HU. Pineal gland and choroid plexus calcifications also have stereotypical locations ( Figure 1-21 ) that aid in their recognition. Calcifications are shown in Figure 1-21 .


Indications for Surgery in Parenchymal Hemorrhage
Published criteria for surgical treatment of traumatic intraparenchymal hematoma are complex. They include size greater than 20 cm 3 with midline shift greater than 5 mm, cisternal compression, or both if the GCS score is 6 to 8. Lesions greater than 50 cm 3 in size should be managed operatively, regardless of the GCS score.
B Is for Brain
The third B in our mnemonic is for brain. Brain abnormalities include neoplastic masses, localized vasogenic edema, abscesses, ischemic infarction, global brain edema, and DAI.
Masses
Masses are best delineated on CT with IV contrast or on MRI. However, noncontrast CT can demonstrate a variety of masses if they are of sufficient size. In some cases, the mass itself may not be seen, but secondary findings such as mass effect, calcification (see Figure 1-21 ), or vasogenic edema ( Figure 1-22 ) (see the discussion in the next section) may occur. IV contrast is useful in detecting masses because they are generally extremely vascular and thus enhance in the presence of contrast material. On noncontrast CT, masses may be denser than surrounding brain if they are calcified. Examples are meningiomas, which are often seen as midline structures emanating from the falx cerebri.

Vasogenic Edema
Malignant primary brain neoplasms or metastatic lesions often appear hypodense (darker or blacker) compared with normal brain. This appearance is typical of localized
- •
Appearance: Variable white to gray on brain windows
- •
Location: peripheral to brain or interhemispheric; variable location around brain perimeter
- •
Shape: Crescent
- •
Pearl: May cross suture lines
- •
Significance: May cause mass effect and herniation
- ○
Look for midline shift
- ○
Associated with other brain injuries, look for effacement of ventricles and sulci
- ○
- •
Surgical indications : 10-mm thickness or 5-mm midline shift
Vasogenic edema must be differentiated from infarction, which may also cause a hypodense appearance. Vasogenic edema does not need to conform to a normal vascular territory within the brain, whereas hypodensity associated with ischemic stroke does. Vasogenic edema responds to treatment with dexamethasone, whereas steroids are not indicated for other forms of cerebral edema such as traumatic edema do not. In fact, a multicenter randomized controlled trial of corticosteroid therapy in patients with traumatic brain injury showed an increased risk of death and severe disability from steroid use.
As described earlier, midline shift associated with a mass should be carefully assessed during inspection of the brain on brain windows.
Abscesses
Abscesses may be visible on noncontrast CT as hypodense regions ( Figure 1-23 ), occasionally with air within them. This appearance may be nonspecific, and a differential diagnosis including toxoplasmosis, mass with vasogenic edema, or central nervous system lymphoma should be considered, depending on the patient’s clinical scenario. Abscesses, toxoplasmosis, neurocysticercosis ( Figure 1-24 ), and masses all may undergo ring enhancement, an increase in density around a lesion after administration of IV contrast ( Box 1-5 ). This reflects increased blood flow in the vicinity of the lesion, as well as leaky vascular structures that allow extravasation of contrast in the region.


Ischemic Stroke and Infarction
Ischemic stroke accounts for 85% of strokes. It is potentially one of the most important indications for head CT and is an area in which the interpretation of CT by emergency physicians might play the greatest role by shortening the time to diagnosis. One obvious reason is the 3-hour or 4.5-hour window for administration of IV t-PA—an intervention that is still fiercely debated in the emergency medicine community and that has been reviewed elsewhere.
Understanding CT findings of acute ischemic stroke is important—for those who do not believe in
- •
Increased brightness (Hounsfield units) after IV contrast administration
- •
Seen in
- ○
Infection
- ○
Inflammation
- ○
Neoplasm
- ○
Vascular lesions
- ○
A complex cascade of events occurs to cause the evolving appearance of ischemic stroke on head CT. Initially, at the moment of onset of cerebral ischemia, no abnormalities may be seen on head CT—thus, this is one of the most difficult diagnoses for the emergency physician, as a normal CT may correlate with significant pathology. Studies have shown emergency physicians to be relatively poor at recognizing early ischemic changes, which we review here ( Table 1-3 and Box 1-6 ).
| Type of Change | Percentage |
|---|---|
| Any change | 31% |
| GWMD loss | 27% |
| Hypodensity | 9% |
| CSF space compression | 14% |
| GWMD loss > ⅓ MCA territory | 13% |
| Hypodensity > ⅓ MCA territory | 2% |
| CSF space compression > ⅓ MCA territory | 9% |
How Early Does the Noncontrast Head CT Indicate Ischemic Stroke?
Analysis of the National Institute of Neurological Disorders and Stroke (NINDS) data shows that early ischemic changes are quite common in ischemic stroke, occurring in 31% of patients within 3 hours of stroke onset, in contrast to the widely held belief that ischemic strokes become visible on CT only after 6 hours. Some findings may occur immediately, such as the hyperdense middle cerebral artery (MCA) sign, while other findings may require time to elapse, with the gradual failure of adenosine triphosphate (ATP)–dependent ion pumps and resulting fluid shifts.
Hyperdense Middle Cerebral Artery Sign
The hyperdense MCA sign is a finding of hyperacute stroke, indicating thrombotic occlusion of the proximal MCA. This may be present on the initial noncontrast head CT immediately following symptom onset, since the finding does not require the failure of ion pumps and fluid shifts that lead to other ischemic changes on head CT. Because
- •
Hyperdense MCA sign
- •
Loss of gray–white differentiation
- ○
Insular ribbon sign
- ○
Cortical sulcal effacement
- ○
- •
Ischemic focal hypoattenuation
- ○
MCA territory
- ○
Basal ganglia
- ○
Use your knowledge of the location of the patient’s neurologic deficits to direct you to the likely side of the lesion, which will be on the contralateral side. Then use the normal symmetry of the brain to help you identify this abnormality. A related finding, the MCA “dot” sign, has been validated by angiography and found to be a specific marker of branch occlusion of the MCA. This sign appears as a bright white dot in the sylvian fissure on the affected side. Figure 1-25 shows the hyperdense MCA sign.

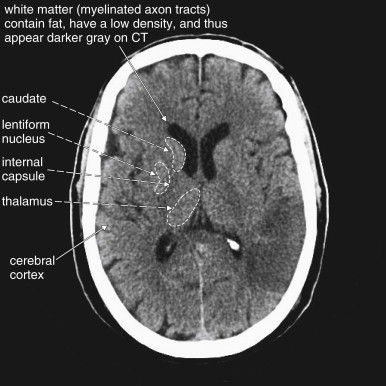
Gray–White Differentiation
Understanding this finding of stroke requires a brief and simple review of neuroanatomy. Gray matter is brain tissue without myelin—examples include the cerebral cortex, lentiform nucleus, caudate, and thalamus. White matter is composed of myelinated axons in brain tissue—rendered white on gross pathologic section by the high lipid content of the myelin sheath. Recall from our earlier discussion of Hounsfield units that lower density on CT means a darker color—low-density fat appears a darker gray than does higher-density water. Thus, the higher fat content of white matter makes it appear darker on CT. In other words, on a normal head CT, gray matter is whiter and white matter is grayer. Figure 1-26 shows the normal gray–white matter boundary.

Loss of Gray–White Matter Differentiation
In an ischemic stroke, as brain tissue consumes ATP and is unable to replenish it, ATP-dependent ion pumps stop working. Ions equilibrate across membranes, and fluid shifts occur. Gray matter gains fluid, lowering its density, and as it does, its density becomes more similar to that of white matter. White matter also gains fluid, increasing its density slightly. Since differences in density are the reason that these tissues look different on CT, as their densities converge, their appearances become more similar, and it becomes more difficult to discern where gray matter ends and white matter begins. This change is called loss of gray–white matter differentiation, and it is an early finding of ischemic stroke, occurring within 3 hours after onset of ischemia. Figures 1-27 and 1-28 show an abnormal gray–white matter boundary.


Insular Ribbon Sign (Loss of Insular Ribbon)
The insula (or insular cortex) is a thin ribbon of gray matter tissue that lies just deep to the lateral brain surface, separating the temporal lobe from the inferior parietal cortex. On CT, it is visible as the tissue layer lining the Sylvian fissure. This region is subject to early ischemic changes in the form of loss of gray–white matter differentiation, often called the insular ribbon sign or loss of the insular ribbon, as this area becomes less distinct.
Hypodensity in Ischemic Stroke
Ischemic brain looks hypodense, or darker than normal brain in the same anatomic region. This change occurs for the same general reasons as does loss of gray–white differentiation. As neurons deplete stores of ATP, cytotoxic and vasogenic edema both occur. Ion gradients run back toward equilibrium, and water shifts into gray matter, making it less dense relative to normal tissue. The appearance of an infarct becomes progressively more hypodense over the first several days to weeks of an ischemic stroke. Again, this finding can occur as an early change within 3 hours of symptom onset. Figures 1-27 through 1-30 show examples of hypodensity. Figure 1-31 shows the progressive hypodensity of an ischemic stroke over several days.


Hypodensity of Ischemic Stroke Versus Vasogenic Edema of Masses
Hypodensity in an ischemic stroke follows a vascular distribution, whereas hypodensity caused by vasogenic edema around a mass need not respect vascular territories.
Are Ischemic Changes a Contraindication to t-PA?
Early ischemic stroke findings were not used as exclusion criteria in the NINDS trial, which required only the absence of hemorrhage on initial head CT. However, multiple studies following NINDS have shown an increased risk of intracranial hemorrhage, bad neurologic outcomes, and death in patients with early ischemic changes on head CT. Ischemic changes are relative contraindications to t-PA administration, and their presence may suggest that greater than 3 hours have elapsed from symptom onset, in which case systemic t-PA may be contraindicated. In addition, the Food and Drug Administration, American Heart Association, and American Academy of Neurology specifically recommend against administering t-PA if early signs of major infarction are present, because of increased risk of intracranial hemorrhage. MCA infarction greater than one third of the MCA territory predicts increased bleeding risk if t-PA is given, and it was poorly detected by radiologists, neurologists, and emergency physicians in past studies. In addition, the greater the extent of ischemic changes on CT, the higher the risk of bleeding, as demonstrated in the second multinational European Cooperative Acute Stroke Study (ECASS-II).
The many noncontrast CT findings of ischemic stroke may seem too much to hope to remember, and their clinical relevance may appear unclear. A few simple rules can make sense of this. First, a normal head CT is perhaps the most likely finding if the patient presents within 3 hours of symptom onset. In this setting, the most important job of the emergency physician in interpreting the head CT is to rule out hemorrhage. Second, in the presence of significant unilateral neurologic abnormalities, the hyperdense MCA sign should be sought. Third, early changes such as loss of gray–white differentiation and hypodensity should be identified, again using the patient’s clinical symptoms to direct you to the likely abnormal side of the brain. These early changes may imply either an earlier time of onset than suggested by the history or a massive stroke in progress.
Cerebral Edema
Diffuse cerebral edema is an abnormality of the brain, but it is manifest through compression of CSF spaces. It can logically be evaluated under B or C in our mnemonic. Cerebral edema can result from many pathologic processes, including trauma, anoxic brain injury, carbon monoxide poisoning, and systemic fluid and electrolyte abnormalities. The appearance is therefore not diagnostic of the underlying etiology. As the brain swells, several visible changes occur on noncontrast CT. CSF spaces become collapsed as they give way to the increasing volume of solid brain tissue. As a result, the lateral ventricles become slitlike and ultimately become obliterated. In addition, the sulci become effaced as the gyri swell. The normal rim of CSF surrounding the brain disappears. The cisterns surrounding the brainstem become compressed, and risk of herniation rises. Moreover, as the ICP rises, the cerebral perfusion pressure falls
As ICP rises, blood flow to the brain decreases unless a compensatory rise in blood pressure occurs:
( cerebral perfusion pressure ) = ( mean arterial pressure ) − ICP
Diffuse Axonal Injury
DAI is the widespread shearing of long axons that occurs as the result of deceleration injury. Common clinical scenarios include high-speed motor vehicle collisions and falls from great height. This injury is not typical of blows to the head or penetrating brain injury. The CT appearance is nonspecific: normal in the hyperacute phase, often followed by cerebral edema over hours to days. Punctate intraparenchymal hemorrhage may occur as well. Often, other traumatic brain injury will be evident, such as SDH or EDH.
The prognosis is poor, and resolution of CT findings may not equate with clinical improvement. MRI is thought to be more diagnostic.
Related posts:

Stay updated, free articles. Join our Telegram channel

Full access? Get Clinical Tree


