Fig. 15.1
Fifty-nine-year-old patient with regional akinesia after a large infarct in the lateral wall of the left ventricle. Note thinning of the lateral wall (arrowheads) during end-diastole (Panel A, four-chamber view) and end-systole (Panel B, four-chamber view). Panel C shows the colored bull’s eye plot of wall motion in mm and Panel D shows wall thickening in percent
In normal ventricles, left ventricular free wall thickness increases by more than 40% during systole (normokinetic myocardium) with a slightly smaller increase in the thickness of the ventricular septum. In patients with ischemic or nonischemic heart disease, wall motion abnormalities can be observed. Hypokinesia is defined as a systolic wall thickening of less than 30%, and akinesia as wall thickening of less than 10%. Dyskinesia is defined as outward myocardial motion during systole, usually in association with systolic wall thinning, and aneurysms are defined as distinct areas of abnormal left ventricular diastolic contour.
Wall motion abnormalities are systematically evaluated and reported using the 17-segment model of the AHA (see Chap. 3). Each segment can be assigned a score on the basis of its contractility as assessed visually (normal = 1, hypokinesia = 2, akinesia = 3, dyskinesia = 4, and aneurysm = 5). A wall motion score index can be calculated to semiquantitatively describe the extent of regional wall motion abnormalities:
Normally contracting left ventricular myocardium has a wall motion score index of 1 (17/17 = 1). The evaluation of wall motion abnormalities can be performed automatically or semiautomatically on dedicated cardiac CT workstations (see Sect. 15.5).
If a myocardial segment with wall motion abnormalities is seen, the myocardium should be evaluated for morphologic abnormalities. Common causes are chronic myocardial infarcts/scars or acute ischemia in patients with acute chest pain. While myocardial infarcts show hypoperfusion (hypodense zones), thinning of the myocardium (<5 mm) or calcification, acute ischemia results in territorial perfusion defects due to hypoperfusion (Chap 19). Other reasons for hypokinetic, akinetic, or dyskinetic segments are cardiomyopathies or myocarditis. A common pitfall is left bundle branch block, which consistently leads to dyssynchronic movement of the anterior and inferior septal segments and does not indicate myocardial disease (Fig. 15.2). Paradoxical septum movement may be as well be seen on cine images in patients with left bundle branch block.
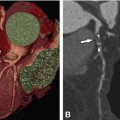
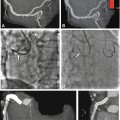
Fig. 15.2
Left-bundle branch block resulting in paradoxical movement of the anteroseptal segment in a 45-year-old female patients presenting with atypical angina pectoris. Results are shown in the short axis for CT (Panels A–C), magnetic resonance imaging (Panels D–F), and echocardiography (Panels G–I) and for cineventriculography in the left anterior oblique projection (Panels J–L). The diastolic images are shown in the first column for all techniques (Panels A, D, G, and J) while midsystolic images are shown in the middle column (Panels B, E, H, and K) without any wall-motion abnormalities. At endsystole (right column), all techniques show paradoxical outward motion and thinning of the anteroseptal segment (dyssynchrony, arrows, Panels C, F, I, and L), whereas all other segments exhibit further systolic inward motion. This is best seen on cine movies and is typical for left-bundle branch block but should not be mistaken for true dyskinesia. Conventional coronary angiography and coronary CT angiography did not show coronary artery stenosis in this patient
To summarize, although recent technical developments have improved the capabilities of CT, temporal resolution is still lower than that of cardiac MRI. Hence MRI should be preferred as first-line imaging modality in clinical practice. However, if retrospective ECG-gated datasets are available for coronary CT angiography, comprehensive evaluation of regional wall motion abnormalities or global left ventricular function may have added value.
15.2 Clinical Use of Cardiac CT
Current cardiac CT should not be used as first-line imaging modality for evaluation of left ventricular function because it involves radiation exposure. Cardiac MRI or echocardiography should be preferred for primary evaluation of right and left ventricular function. MRI is regarded as the gold standard method with the highest reproducibility.
Cardiac CT has the advantage that the datasets acquired for coronary CT angiography using retrospective ECG gating can also be used for evaluating cardiac function. No additional injection of contrast agent or exposure to further radiation is necessary. Because of the importance of global as well as regional cardiac function for a patient’s individual prognosis and further clinical management, we thus strongly encourage to perform cardiac function analysis in all patients undergoing coronary CT angiography if datasets are acquired with conventional retrospective ECG gating.
15.3 Adjustment of CT Examination Protocols for Evaluation of Cardiac Function
15.3.1 Contrast Bolus Design
For evaluation of cardiac function, it is recommended to adjust the contrast agent injection protocol. Homogeneous enhancement of the right ventricle is desirable for better delineation of the interventricular septum. If a single bolus is injected for arterial phase at high flow rate (~5 ml/s), followed by a saline chaser, as commonly used for coronary CT angiography, most of the contrast agent will have left the right ventricle by the time the scan is taken. Hence, the interventricular septum and the right ventricle will not be delineated. If contrast bolus timing is suboptimal, e.g., if the injection time is too long, and/or if the bolus volume is too large, the right ventricle will appear inhomogeneous and show streak artifacts hampering image quality.
As mentioned before in Chap. 8, whenever assessment of cardiac function is required, biphasic injection of the contrast agent or injection of a mixture of contrast agent and saline have shown to improve image quality by providing low but homogeneous contrast attenuation of the right chambers. Streak artifacts, resulting from persisting flow of contrast agent, impair segmentation of the right chambers using fully automated software tools and degrade image quality of the right coronary artery. Therefore, the attenuation of the right chambers should be as homogeneous as possible.
Vrachliotis et al. describe a biphasic injection protocol including a first phase bolus of contrast at high flow rate (100 ml at 5 ml/s) and a second phase at decreased flow (30 ml at 3 ml/s), resulting in an overall contrast agent volume of 130 ml. This protocol allows triple rule-out because it ensures rather homogenous enhancement in the coronary, aortic, and pulmonary vasculature as well as in the right ventricle using 64-row CT.
15.3.2 ECG-Gating Techniques
Retrospective ECG gating is required for assessment of cardiac function, which permits the acquisition of multiphase datasets over the entire cardiac cycle. ECG-dependent tube current modulation can be applied, resulting in diagnostic images in most cases despite higher image noise during systole.
Prospectively EGG-triggered datasets (“step-and-shoot”) preclude evaluation of cardiac function if the padding window is placed at end-diastole.
The recently introduced prospective ECG-triggered adaptive sequential scan mode, with additional tube current modulation throughout the cardiac cycle enables estimation of cardiac function parameters and may provide a reasonable alternative in patients with stable heart rates.
15.3.3 Image Reconstruction
Reconstruction of the multiphase dataset covering the entire cardiac cycle should be performed in 5% or 10% steps from 0 to 90% of the RR interval. For detailed information on how to generate multiphase datasets on the different scanners, please see Chap. 9.
We recommend reconstructing a slice width of 1 mm (overlap, 70%) to ensure highest spatial resolution and highest accuracy of measurements; however, one needs to keep in mind that multiphase datasets produce large amounts of images. If one experiences difficulties in uploading large datasets, slice thickness may be increase to 1.5–2 mm to reduce the number of images.
Most of the commercially available workstations provide tools for automated detection of the maximum end-systolic and end-diastolic volumes. Using these tools, it is generally possible to automatically identify systole and diastole and reduce data volume and analysis time.
15.4 Definition of Cardiac Function Parameters
A large number of cardiac function parameters exist. Table 15.1 presents clinically relevant parameters, which can be calculated with all commercially available postprocessing workstations equipped with cardiac software packages. Table 15.2 lists other important cardiac parameters, which can be evaluated depending on the ECG-gating technique (retrospective or prospective ECG gating) and the specific workstation used.
Table 15.1
Clinically relevant cardiac function parameters
Parameter | Unit | Description |
|---|---|---|
End-diastolic volume (EDV) | ml | Largest volume of the left ventricle during any cardiac phase. An increase in venous return to the heart increases the EDV, which stretches the muscle fibers and increases the preload. This leads to an increase in ventricular contraction in order to eject the additional blood, resulting in a higher SV |
End-systolic volume (ESV) | ml | Smallest volume of the left ventricle during any cardiac phase |
Stroke volume (SV) | ml/stroke | Blood volume ejected during systole (SV = EDV − ESV) |
Ejection fraction (EF) | % | Percentage of blood in the left ventricle ejected during systole (EF = SV/EDV × 100%) |
Cardiac output (CO) | l/min | Blood volume ejected from the heart per minute (CO = heart rate × SV/1,000). CO is regulated principally by the oxygen demand of the body cells and is increased during infection and sepsis and decreased in cardiomyopathy and heart failure |
Table 15.2
Parameter unit description
Parameter | Unit | Description |
|---|---|---|
Myocardial volume (MV) | Ml | Volume of myocardium of the left ventricle (inclusion or exclusion of the papillary muscles depending on the workstation) |