Chapter Outline
Cardiac Imaging Techniques, 78
Plain Radiograph Interpretation, 78
Angiography, 81
Magnetic Resonance Imaging, 83
Computed Tomography, 85
Ultrasound, 87
Congenital Heart Disease, 88
General, 88
Algorithm, 89
Acyanotic CHD With Increased Pulmonary Vascularity, 91
Acyanotic CHD With Normal Pulmonary Vascularity, 95
Cyanotic CHD With Decreased Pulmonary Vascularity, 97
Cyanotic CHD With Increased Pulmonary Vascularity, 100
Aorta, 104
Pulmonary Artery, 106
Situs Anomalies, 106
Other, 108
Acquired Heart Disease, 110
Differential Diagnosis, 119
Cardiac Imaging Techniques
Plain Radiograph Interpretation
Normal Plain Radiograph Anatomy
Posteroanterior View ( Fig. 2.1 )
Right cardiac margin has three segments:
- •
Superior vena cava (SVC)
- •
Right atrium (RA)
- •
Inferior vena cava (IVC)
- •
Left cardiac margin has four segments:
- •
Aortic arch (AA) (more prominent with age)
- •
Main pulmonary artery (PA) at level of left main stem bronchus
- •
Left atrial appendage (may not be visible in normal hearts)
- •
Left ventricle (LV)
- •
RV is usually not seen in frontal projection
- •

Lateral View ( Fig. 2.2 )
Anterior cardiac margin has three segments:
- •
Right ventricle (RV) is in apparent contact with sternum
- •
Main PA
- •
Ascending aorta
- •
Posterior cardiac margin has two segments:
- •
LV
- •
Left atrium (LA)
- •
Other anatomic landmarks:
- •
Trachea, bronchi
- •
Right PA en face anterior to carina
- •
Aortopulmonary window (triangle between aorta and PA)
- •

Oblique Views ( Fig. 2.3 A–B )
Right anterior oblique (RAO) and left anterior oblique (LAO) views are mainly used in coronary angiography and ventriculography. These views rarely add any diagnostic information in routine clinical practice. RAO view does not show calcified mitral or tricuspid valve.


Radiographic Approach to Intensive Care Unit (ICU) Radiographs
- 1.
Patient data present?
- 2.
Date and time of examination are essential to report
- 3.
Postsurgical? If so, what type of surgery?
- 4.
Appliances: intravascular, catheters, endotracheal tube, tubes, drains, etc. New appliances? Any catheters removed or repositioned?
- 5.
Cardiac, mediastinal size and shape?
- 6.
Pneumothorax present?
- 7.
Lung disease: progression/regression?
- 8.
Most important: any change from previous radiographs?
Pearls
- •
Always obtain end-inspiratory radiographs; varying lung volumes in inspiratory radiographs will change the apparent extent and distribution of alveolar fluid.
- •
Positive end-expiratory pressure (PEEP) ventilation may underestimate airspace consolidation. PEEP decreases vascular mediastinal width.
- •
Quality of portable radiograph is often suboptimal because:
Exposure time is longer than with routine radiographs; this, along with the inability to often suspend respiration, causes indistinct vascular margins, which should not be mistaken as interstitial edema.
Patient positioning suboptimal
Anteroposterior (AP), not posteroanterior, position
Patient is semierect
Small pleural effusions not readily detectable
Pulmonary vascularity may be “cephalized”
Varying tube-film distance
Varying cardiac/mediastinal silhouette
- •
Technique
Lower (80–90) peak kilovoltage (kVp) than normal (120–140)
Variable daily density (exposure occurs at toe of HD curve): inadequate display of retrocardiac and mediastinal structures
Endotracheal Tube (ET)
Inflated cuff should not bulge tracheal wall. Tip of ET should be above the carina and below thoracic inlet:
- •
Neutral neck: 4–6 cm above carina
- •
Flexed neck: moves tip inferiorly by 2 cm
- •
Extended neck: moves tip superiorly by 2 cm
Complications of ET placement:
- •
Misplacement: atelectasis secondary to bronchial obstruction
- •
Tracheomalacia occurs above cuff pressures of 25 cm H 2 O
- •
Tracheal rupture; radiographic findings include:
Pneumothorax
Pneumomediastinum
Subcutaneous emphysema
- •
Tracheal stenosis
- •
Dislodged teeth
- •
Laceration of nasooropharynx
Nasogastric (NG) Tube
Tip with end holes should be located in stomach.
Complications
- •
Placement in airway
- •
Gastric and/or duodenal erosion
Swan-Ganz Catheter
Tip should be located in left or right PA, within 1 cm of hilum. There should be no loops in RA, RV (may cause arrhythmias).
Types
- •
Swan-Ganz catheter for measurement of wedge pressure
- •
Swan-Ganz catheter with integrated pacemaker (metallic bands visible)
Complications
- •
Pulmonary infarct
- •
Pulmonary hemorrhage
- •
PA pseudoaneurysm
- •
Infection
Intraaortic Balloon Pump (IABP)
Tip should be located just distal to the takeoff of the left subclavian artery (LSA) and be 2–4 cm below aortic knob. Inflation may be seen during diastole.
Complications
- •
CVA (position too high)
- •
Renal or mesenteric ischemia (position too low)
- •
Aortic dissection
- •
Limb ischemia
- •
Infection
- •
Note initial positions of electrodes as they may migrate
Epicardial Pacing Wire ( Fig. 2.4 )
Wires are typically anchored in the anterior myocardium; some slack may be left in pericardium. Multiple wires may be present. Wires exit through anterior chest wall.

Automatic Intracardiac Defibrillation Device
Older systems: rectangular or ovoid antenna around RV and LV; newer systems: intraventricular electrodes.
Types of Automatic Implantable Cardioverter Defibrillator (AICDs)
- •
New models have pin sensors.
- •
Old models have a spring.
Central Venous Lines
Tip should end in the SVC below the anterior first rib. Always rule out pneumothorax. Left-sided course of the line is indicative of left-sided SVC draining into coronary sinus. Signs of impending catheter perforation (hemothorax, pneumothorax) include:
- •
Position of the tip against the vessel wall
- •
Sharply curved catheter tip
- •
Infection, thrombosis
Pacemaker ( Fig. 2.5 )
Typical location is in the apex of RV. May be located in atrial appendage for atrial pacing and in coronary sinus for atrial LV pacing.

Complications
- •
Displacement of electrodes
- •
Broken wires (rare with modern pacemakers)
- •
Twiddler syndrome: rotation of pulse generator because of manipulation in a large pacemaker pocket
- •
Perforation
- •
Infection
- •
Venous thrombosis, vascular obstruction
Chest Tubes
Side port (interruption of radiodense band) must be within thoracic cavity, otherwise there may be a leak. The tip of the tube should not abut the mediastinum.
Complications
- •
Residual pneumothorax
- •
Side port outside the thoracic wall
Prosthetic Cardiac Valves
Tissue Valves
No anticoagulation necessary; early breakdown
Heterografts
Porcine valves
- •
Carpentier-Edwards valve
- •
Hancock valve
- •
Bovine valves
- •
Ionescu-Shiley valve (presently not used)
- •
Homografts
Aortic in setting of endocarditis
Autografts
Native pulmonary valve, aortic valve
Mechanical Valves ( Fig. 2.6 )
More durable than tissue valves but require anticoagulation
Caged ball
- •
Starr-Edwards valve (presently not used)
- •
McGovern-Cromie (presently not used)
- •
Smeloff-Cutter valve (presently not used)
- •
Caged disk
- •
Beal valve (presently not used)
- •
Tilting disk
- •
Bileaflet: St. Jude Medical valve
- •
Single leaflet: Björk-Shiley valve (presently not used)
- •
Medtronic-Hall
- •
LilleheiKaster: later becomes Omniscience
- •
Transcatheter aortic valve
- •
Edwards Sapien
- •
Medtronic CoreValve
- •


Angiography
Cardiac Angiography
Technique for Left Ventriculography
- •
Femoral approach (increasing use of radial artery approach)
- •
Pigtail for ventricular injections
- •
Straight end-hole catheter for pressure measurements
- •
36–45 mL (3- to 4-second injection) at 15 mL/s
Evaluation
- 1.
Cardiac chamber size
- 2.
Wall motion
- 3.
Ejection fraction (EF)
- 4.
Valvular stenosis, regurgitation, or shunts
Ejection Fraction
EF = ( EDV − ESV ) EDV = Stroke volume EDV
Wall Motion Abnormalities ( Fig. 2.7 )
- •
Hypokinesis
- •
Akinesis
- •
Dyskinesis

Coronary Angiography ( Fig. 2.8 )
Judkins catheters (6 Fr, groin) are the most commonly used catheters. Right and left Judkins catheters have different shapes.

Contrast Medium
- •
Hand injection: 7–9 mL for left coronary artery (LCA), 4–6 mL for right coronary artery (RCA)
- •
Low-osmolar contrast agents are usually used.
- •
Hyperosmolarity leads to electrocardiographic (ECG) changes.
- •
Citrate in contrast medium may cause hypocalcemia.
- •
3000 U heparin IV; reversed by 350 mg of protamine
Complications
- •
Hematoma
- •
Arrhythmia
- •
Vasovagal reaction
- •
Contrast reaction/renal failure
- •
Acute myocardial infarction (AMI) <1%
- •
Stroke <1%
- •
Coronary air embolus
- •
Coronary artery dissection
- •
Perforation/dissection of aorta
- •
Femoral artery aneurysms
Interpretation
Steps in evaluation of coronary angiograms:
- 1.
Which artery is being opacified?
- 2.
Which projection (LAO or RAO)?
- 3.
Stenosis present? If yes, grading of stenosis
- 4.
Also evaluate for filling defects, occlusions, collaterals, coronary cameral fistulas
- 5.
Ventriculogram; analyze:
- •
Wall motion
- •
EF
- •
Presence of mitral regurgitation?
- •
Filling defects from thrombus and masses
- •
- 1.
Coronary Angiogram ( Fig. 2.9 A–D )
RCA
- •
Conus artery
First branch of RCA
Runs anteriorly
- •
Sinoatrial (SA) nodal artery
Branch of RCA in 40%–55%
- •
Muscular branches
- •
Acute marginal branch
- •
Posterior descending artery
- •
Atrioventricular (AV) nodal artery
Branch of RCA in 90%
- •
Posterolateral ventricular branches
- •
LCA
- •
Left anterior descending (LAD)
Longest vessel
Only vessel that extends to apex
Septal branches
Diagonal branches
- •
Left circumflex artery (LCx)
Left atrial circumflex
Marginal branches
- •


Projections ( Fig. 2.10 )
LAO view projects the spine to the left (relative to the heart [i.e., on the right side of the image]). RAO projects the spine to the right (relative to the heart [i.e., to the left side of the image]).

Different projections (LAO, RAO) and angulations (caudal, cranial) are required to visualize all portions of the coronary arteries. Most commonly, the following projections are obtained:
- •
LAO with cranial angulation
- •
AP cranial or caudal angulation
- •
RAO cranial or caudal angulation
- •
Lateral (rarely used)
Although AP views are good for visualizing left main arteries, they are not as useful as RAO and LAO views because arteries overlie the spine.
Dominance
This refers to the artery that ultimately supplies the diaphragmatic aspect of the interventricular septum (IVS) and the LV.
- •
85% of patients have right-sided dominance: RCA is larger than LCA and gives rise to the AV nodal artery.
- •
10% of patients have left-sided dominance: LCA is larger than RCA and gives rise to the AV nodal artery.
- •
5% of patients have a balanced coronary artery tree (codominant): two posterior descending arteries are present, one from the left circumflex and one from the RCA.
Pitfalls
- •
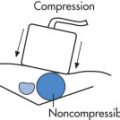
Intramyocardial bridge: LAD enters deep into the myocardium and may be compressed during systole; appears normal in diastole.
- •
Spasm of coronary arteries may be catheter induced (spasm can be provoked with ergot derivatives during angiography).
- •
Totally occluded arteries/bypasses may escape detection.
- •
Orifice stenoses can be missed if aortic injection not performed.
- •
Inadequate opacification: need to see contrast reflux into aorta
Veins
- •
Epicardial veins accompany arteries and drain into coronary sinus.
- •
Thebesian venous system drains directly into all heart chambers.
Magnetic Resonance Imaging (MRI)
Cardiac Magnetic Resonance (MR) Is Tailored Extensively Depending on the Indication
- •
“White blood”: gradient echo (SSFP/FIESTA [fast imaging employing steady-state acquisition]); balanced steady-state free precession (SSFP) is optimal for cine cardiac imaging. Advantages of SSFP include highest SNR efficiency, high blood myocardial contrast, very fast, and can be gated. Signal depends on T2/T1, hence fluid and blood appear bright.
- •
“Black blood”: double inversion recovery fast spin echo (half-Fourier-acquired single-shot turbo spin echo [HASTE]/SSFSE), nulls signal from flowing blood
- •
ECG-gated bright-blood cine imaging: wall and valve motion, and gold standard method for volumetry—stack of short-axis slices (EDV, ESV, EF)
- •
Delayed-enhancement cardiac MRI (DE-CMRI): 10–30 min delay after gadolinium (Gd), assessment of myocardial viability, inflammation, fibrosis
- •
First-pass perfusion imaging: modality with highest spatial resolution perfusion imaging, often done at rest and with regadenoson/dobutamine/adenosine stress
- •
Dobutamine stress cine-MRI detects hypokinesia and akinesia comparable with echo, but with higher resolution and diagnostic accuracy; also as real-time technique (using parallel imaging for acceleration) that does not require ECG gating. Regadenoson is safer and easy to administer in comparison with dobutamine and adenosine.
- •
T2 imaging to detect myocardial edema
- •
- •
MR venogram: pulmonary vein ablation planning for atrial fibrillation
- •
Flow quantification: phase contrast sequences
- •
Arrhythmogenic RV dysplasia: black blood fast spin-echo images, fat-suppression techniques to confirm fat infiltration
- •
Standard axes:
Short axis: RV, LV
Horizontal long-axis (4-chamber): RA, RV, LA, LV
Vertical long-axis (2-chamber): LA, LV
- •
Other views:
LVOT/aortic root: ascending aorta, aortic valve
3-chamber: LA, LV, right ventricular outflow tract (RVOT), left ventricular outflow tract (LVOT), aortic valve, MV (rheumatic heart disease)
Magnetic Resonance (MR) Coronary Angiography
Tremendous advances in MR coronary angiography during the past decade have demonstrated promising potential for noninvasive diagnosis of coronary artery disease (CAD). The in-plane image resolution of current coronary artery MRI techniques is about 0.5 mm, which is sufficient for detection of stenoses in large coronary arteries and venous grafts after bypass surgery but inadequate for accurate detection of disease in smaller branches of the coronary vasculature.
- •
Fast gradient-echo sequences are commonly used (TR <10 ms, TE <3 ms)
- •
Multislice 2D sequences are commonly used for breathhold sequences. 3D sequences are commonly used for nonbreathhold sequences (using navigator correction for respiratory motion).
- •
Fat saturation is used to suppress epicardial coronary fat.
- •
Newer phased-array, parallel imaging coils have increased signal-to-noise ratio (SNR).
- •
The scans are triggered to overcome cardiac motion, and this is done in one of three ways:
Prospective triggering: the QRS complex “triggers” the execution of the next imaging sequence. The search for the next trigger event is initiated after completion of the sequence part. Consequently, a single measurement can cover more than one cardiac cycle, and this can prolong the total acquisition time.
Retrospective gating: data are acquired continuously during the cardiac cycle. This is the method of choice for studies of cardiac function, because the complete heart cycle is covered during data acquisition. During the measurement, each acquired raw data line receives a time stamp. The trigger event is used to reset the time stamp to 0. At the end of the measurement, raw data can be resorted based on the time stamps, and images are reconstructed with a user-definable temporal resolution (by temporal interpolation). Additionally, arrhythmia rejection can be enabled excluding data acquired outside a user-definable heart cycle range.
Pulse-triggering: because of the delay of the pulse wave with respect to the ventricular contraction and because of its wider signal peak, pulse-triggering is not as reliable as the ECG. Usually the data are acquired over multiple heart cycles. This requires a breathhold to avoid blurring. To acquire data without breathhold, so-called navigator techniques are available that monitor the motion of the diaphragm, thus allowing for data acquisition in a particular phase of the respiratory cycle.
- •
Gated, segmented k-space acquisition is commonly used.
- •
Spiral imaging is an alternative imaging modality that samples k space along trajectories that start at the center of k space and spiral outward. This scheme is a more natural sampling pattern that has high sampling densities near the center of k space, where the power spectrum of the image is generally highest.
- •
Low-dose nitrate (coronary vasodilatation) or β-blocker pretreatment (to slow down heart rate) is still used.
- •
Currently, cardiac MRI is used in the clinical setting for the following purposes:
- 1.
Assessment of anatomy in congenital malformations and shunt quantification
- 2.
To detect LV myocardial scar and evaluate for cause of newly diagnosed heart failure/cardiomyopathy
- 3.
Imaging of intracardiac masses such as thrombi and tumors (e.g., atrial myxoma, rhabdomyosarcoma, metastatic disease)
- 4.
Assessment of morphology and wall motion in cases when echocardiography is not diagnostic (20% of echocardiography is not diagnostic owing to insufficient image quality [e.g., in obese patients or patients with emphysema])
- 5.
First-pass perfusion measurements for assessment of myocardial ischemia. Myocardial viability: late-enhancement MRI (10–30 min after Gd injection); “bright is dead”
- 6.
Pharmacologic stress cine-MRI to detect stress-induced ischemia
- 7.
To provide a road map for pulmonary vein isolation procedure in patients with atrial fibrillation
VENDOR-SPECIFIC SEQUENCE NOMENCLATURE
Sequence Type
Siemens
GE
Philips
Hitachi
Toshiba
Spin echo
SE
SE
SE
SE
SE
Turbo/fast spin echo
TSE
FSE
TSE
FSE
FSE
Single-shot TSE/FSE
HASTE
Single-shot FSE
Single-shot FSE
Single-shot FSE
FASE
Gradient echo
GRE
GRE
FFE (fast field echo)
FE
Field echo
Spoiled GRE
FLASH
SPGR
T1-FFE
RF spoiled SARGE, RSSG
Field echo
Coherent GRE
FISP
GRASS
FEE
Rephased SARGE
Field echo
SSFP
PSIF
SSFP
T2-FFE
Time-reversed SARGE
True FISP
True FISP
FIESTA
Balanced FFE
Balanced SARGE
True SSFP
FASE , Fast advanced spin echo; FE , fast echo; FFE , fast field echo; FIESTA , fast imaging employing steady-state acquisition; FISP , fast imaging with steady-state precession; FLASH , fast low-angle shot; FSE , fast spin echo; GRASS , gradient-recalled acquisition in steady state; GRE , gradient echo; HASTE , half Fourier acquisition single-shot turbo spin echo; PSIF , reverse fast imaging with steady-state precession; RF , radiofrequency; RSSG , radiofrequency-labeled; SARGE , spoiled steady-state acquisition rewinded gradient echo; SE , spin echo; SPGR , spoiled gradient-recalled; SSFP , steady-state free precession; TSE , turbo spin echo.
- 1.
- •
A combined diagnostic session of cine-MRI for morphology and function, first-pass perfusion MRI, and late-enhancement MRI to assess viability is feasible in less than 1 hour and answers the most relevant clinical questions.
Computed Tomography (CT)
CT Angiography of Coronary Arteries
Cardiac cycle is 800 ms and varies according to the heart rate; ideal temporal resolution for imaging should be <50 ms. Temporal resolution is defined as the window within the cardiac period where CT data are acquired. Acquisition may occur during a single heartbeat or multiple heartbeats, with gantry rotation being the primary determinant. The high temporal resolution of multidetector CT makes it useful for cardiac imaging, including coronary calcium scoring and functional assessment of the heart.
Currently, cardiac CT is used in the clinical setting for the following purposes:
- 1.
To rule out CAD in patients with acute chest pain
- 2.
Preoperative assessment of coronary arteries before cardiac surgery
- 3.
Assessment of congenital malformation
- 4.
Assessment of infective endocarditis
- 5.
Pretranscatheter aortic and pulmonic valve replacement for device sizing and procedure planning
- 6.
To provide a road map for pulmonary vein isolation procedure in patients with atrial fibrillation
Technique
As the number of slices increased from 4 to 64 slices and beyond, major changes have occurred within the detector geometry and the necessary postprocessing algorithms. Based on oblique x-ray projections of thin collimated slices, gantry design necessitates the use of special 3D back-projection algorithms to correct for artifacts arising from the cone beam geometry. Whereas 16-slice scanners acquire 16 parallel projections within a single rotation, new multidetector computed tomography (MDCT) allows either for 64 or more parallel slices based on newly designed and widened detector arrays or for overlapping projections based on flying focal spots along the z axis. This improves spatial resolution and reduces image artifacts. Thin-slice collimations are now in the range of 0.5 to 0.625 mm at a maximum gantry rotation speed of 0.25 s/360 degrees. This further speed up in gantry rotation allows for a higher temporal resolution, which is of the essence in functional assessment of the heart and also in respect to image quality at different heart rates ( Fig. 2.11 ).
| ECG Triggering (Prospective) | ECG Gating (Retrospective) | |
|---|---|---|
| Benefits |
|
|
| Drawbacks |
|
|

Optimization of Image Quality
- •
Cardiac CT scans are ECG triggered. Similar to MRI, the triggering can be prospective or retrospective.
- •
Retrospectively, ECG-gated data acquisition provides coverage of the full cardiac cycle, which reduces artifacts. The choice of a +460% image reconstruction window is appropriate for calcium scoring.
- •
The length of diastole shortens with an increase in the heart rate. The use of new faster gantry speeds up to 0.33 s/360 degrees also provides better image quality at higher heart rates, although this might also be in systole.
- •
Insufficient breathholding or slightly different positions of the heart at subsequent heart beats are artifacts that can be more difficult to control.
Coronary CT Angiography
The improved spatial resolution of 64-slice scanners leads to less pronounced blooming artifacts of coronary calcifications and coronary stents (especially along the z axis). This allows for an improved delineation of calcified and noncalcified plaques.
| Detector row | 64 | 64 × 2 | 96 × 2 | 128 | 256 | 320 |
| Rotation speed (s) | 0.35 | 0.28 | 0.28 | 0.27 | 0.28 | 0.35–0.275 |
| Z-axis detector coverage (cm) | 4 | 3.8 | 5.7 | 8 | 16 | 16 |
| Detector thickness (mm) | 0.625 | 0.6 | 0.6 | 0.625 | 0.625 | 0.5 |
Coronary Calcium Scoring
- •
CT examinations are performed without contrast agent administration and therefore display only calcified components of plaque at a fixed Kv of 120.
- •
Only appropriate in asymptomatic patient for risk stratification
- •
Tissue densities ≥130 HU are set as the attenuation level corresponding to calcified plaque (traditional Agatston calcium score).
- •
An alternative and preferred method of determining the calcium score is by quantifying the actual volume of plaque (total calcium volume score [CVS]).
- •
Both calcium scoring algorithms can be applied to fast multidetector CT images and provide a measure of total coronary plaque burden.
- •
Quantitative assessment of coronary artery calcifications is still performed using 3-mm slices according to definition, although modern MDCT scanners scan at much thinner collimations.
Radiation Exposure
- •
Cardiac CT for coronary imaging is increasingly used. Advances in scanner technology have facilitated a significant decrease in radiation dose.
- •
Submillisievert doses are possible if dose reduction strategies are appropriately used for ≥64-slice scanner: predetermination of type of gating, limiting z-axis coverage, breast displacement for female patients, suitable IV access and use of iterative reconstruction techniques. Some vendors allow arrhythmia rejection technique and use of lower Kv (such as 70 Kv) techniques which help to reduce the dose further.
Ultrasound (US)
M-Mode US ( Fig. 2.12 )
M-mode = motion mode = 1D echocardiography. Part of routine cardiac echo. It is more exact than 2D imaging because of higher resolution and sampling rates. Pitfalls: sometimes it is difficult to get the transducer exactly in a 90-degree angle to long axis, mandatory for LV dimensions. Structures with broad surfaces perpendicular to the beam reflect well. The transducer is swept through three zones:

Zone 1
- •
Measurement of systolic and end-diastolic LV diameter allows calculation of fractional shortening (FS), which is an approximation of the EF and estimates LV function.
- •
Measurement of LV wall and IVS wall thickness
- •
Pericardial effusion may be detected and quantified.
Zone 2 ( Fig. 2.13 )
- •
Anterior mitral leaflets (AMLs) and posterior mitral leaflets (PMLs) are identified.
- •
Mitral valve (MV) excursion (measured from D to E) is an index of MV mobility and inflow volume.
- •
EF slope: represents the rate of mid-diastolic posterior excursion of the AML; the EF slope is an index of MV inflow.

Zone 3
- •
Aorta and aortic valve (rhomboid structure) are seen.
- •
Measurement of LA
Two-Dimensional (2D) Cardiac US
There are four common views: ( Fig. 2.14 )
- •
Long-axis view
- •
Short-axis view
- •
Apical view
- •
Suprasternal notch view

FIG. 2.14
- •
Long-Axis View ( Fig. 2.15 )
Transducer is in the third or fourth intercostal space so that the beam is parallel to a line from the right shoulder to the left flank. Image is oriented so that the LA and LV are posterior and the LA and aorta are left.

Short-Axis View ( Fig. 2.16 )
Transducer is in the third or fourth intercostal space, but the beam is perpendicular to the long-axis view. Several levels are usually scanned, from cephalad to caudad: great arteries, plane of MV, and plane of papillary muscles (MPM [posteromedial papillary muscle] and LPM [anterolateral papillary muscle]). Image is oriented so that MPM is at 8 o’clock and LPM is at 4 o’clock.

Apical View ( Fig. 2.17 A–B )
Apical Four-Chamber View
Patient is in left lateral decubitus position. Transducer is at maximum point of impulse. Image is oriented so that RV and LV are anterior and LV and LA are on the right.


Apical Two-Chamber View (RAO View of the LV) ( Fig. 2.18 )
Transducer is at maximum point of impulse and directed in a plane parallel to the IVS. Image is oriented so that LV is anterior.

Suprasternal Notch View
Transducer is in the suprasternal notch with inferior and posterior beam angulation. Image is oriented so that the ascending aorta is on the left and the descending aorta is on the right.
Doppler
Continuous wave and pulsed wave Doppler are frequently used to assess stenosis or insufficiency of valves. One example is to decide if AS requires surgery (cut-off pressure gradient 50 mm Hg). Another important application for Doppler is evaluation of diastolic dysfunction.
Color Doppler
Capitalizing on the Doppler effect, Doppler echocardiography displays the direction and velocity of blood flow. It facilitates assessment of stenotic and insufficient valves and cardiac shunts (atrial septal defect [ASD], ventricular septal defect [VSD]) and estimation of pressure gradients across stenotic valves.
Congenital Heart Disease
General
Incidence
Overall incidence of all anomalies is approximately 1% of newborns. The most common structural defects are bicuspid aortic valve and mitral valve prolapse (MVP), most of which are asymptomatic.
| Frequency | |
|---|---|
| Most Common Congenital Anomalies (All Age Groups; Bicuspid Aortic Valve and MVP Excluded) | |
| Ventricular septal defect | 30% |
| Atrial septal defect | 10% |
| Tetralogy of Fallot | 10% |
| Patent ductus arteriosus | 10% |
| Coarctation of aorta | 7% |
| Transposition of great arteries | 5% |
| First Month of Life (Serious Clinical Problems, High Mortality) | |
| Hypoplastic left heart | 35% |
| Transposition of great arteries | 25% |
| Coarctation | 20% |
| Multiple serious defects | 15% |
| Pulmonary atresia/stenosis | 10% |
| Severe tetralogy of Fallot | 10% |
Approach ( Fig. 2.19 )
Evaluate five structures on the chest radiograph:
- •
Pulmonary vascularity
- •
Chamber enlargement
- •
Situs
- •
Side of AA
- •
Bone and soft tissue changes
- •

Pulmonary Vascularity
Normal vascularity
- •
Right main PA = same size as trachea at level of AA
- •
Peripheral arteries (seen on end) = same size as adjacent bronchus
- •
Pulmonary arterial overcirculation (shunt vascularity): common in CHD, less common in acquired heart disease (AHD)
Pulmonary venous hypertension (PVH) (edema) grades:
- •
Grade 1: Vascular redistribution (10–17 mm Hg)
- •
Grade 2: Interstitial edema (18–25 mm Hg)
- •
Grade 3: Alveolar edema (>25 mm Hg)
- •
Pulmonary arterial hypertension (PAH)
- •
Large main PA
- •
Usually normal hilar arteries
- •
Eisenmenger pulmonary vasculature
- •
Combination of shunt and PAH
- •
Aneurysmal hilar arteries
- •
Calcified vessels (rare)
- •
Cyanosis: there are no definitive signs to predict cyanosis by plain radiograph; however, as a rule of thumb, cyanotic patients (right-to-left [L-R] shunt) have small PAs, and the main PA segment may not be visible or is concave.
Chamber Enlargement
Lateral view is more helpful in young children:
- •
LA enlargement
Posterior displacement of esophagus during barium swallow
Posterior displacement of left mainstem bronchus (LMB)
Double density sign: density of enlarged LA behind right heart
- •
LV enlargement: posterior displacement behind IVC
- •
RV enlargement: filling of retrosternal clear space
- •
PA view; criteria for cardiomegaly:
- •
Cardiothoracic index >0.55
- •
Situs
- •
Liver or IVC determines on which side the RA is located.
- •
Tracheobronchial tree: right mainstem bronchus (RMB) has a more vertical angle than LMB.
- •
Incidence of CHD in situs inversus: 5%
Algorithm
Classification ( Fig. 2.20 )
The radiographic classification of CHD relies mainly on clinical information (cyanosis) and plain radiograph information (pulmonary vascularity).

Acyanotic CHD With Increased Pulmonary Vascularity
Common: L–R shunt where pulmonary flow is greater than aortic flow; the shunt can be located in:
IVS
- •
VSD
- •
Atrium
- •
ASD
- •
Large vessels
- •
Patent ductus arteriosus (PDA)
- •
Aorticopulmonary window (uncommon)
- •
Other
- •
Endocardial cushion defect (ECD)
- •
Partial anomalous pulmonary venous connection (PAPVC)
- •
Acyanotic CHD With Normal Pulmonary Vascularity
Normal pulmonary vascularity is associated with either outflow obstruction or valvular insufficiency before onset of congestive heart failure (CHF):
Outflow obstruction
- •
Coarctation of aorta
- •
Interruption of aortic arch (IAA)
- •
AS
- •
Pulmonic stenosis
- •
Valvular insufficiency (rarely congenital)
Corrected transposition of great arteries (L-TGA) (isolated)
Cyanotic CHD With Decreased Pulmonary Vascularity
Decreased pulmonary vascularity because of obstruction of pulmonary flow. In addition, there is a R-L shunt because of an intracardiac defect.
Normal heart size
- •
Tetralogy of Fallot
- •
Fallot variants
- •
Tricuspid atresia
- •
Increased heart size
- •
Ebstein anomaly
- •
Pulmonary stenosis with ASD
- •
Pulmonary atresia
- •
Cyanotic CHD With Increased Pulmonary Vascularity (Admixture Lesions)
Common denominator of these lesions is that there is an “admixture” of systemic and pulmonary venous blood (bidirectional shunting). The mixing of venous and systemic blood may occur at the level of:
Large veins
- •
Total anomalous pulmonary venous connection (TAPVC) (ASD is also present.)
- •
Large arteries
- •
Truncus arteriosus (TA) (VSD is also present.)
- •
Multiple
- •
Transposition of great arteries (TGA) (VSD, ASD, or PDA is also present.)
- •
Ventricle
- •
Single ventricle (VSD is present.)
- •
Double-outlet right ventricle (DORV) (VSD is present.)
- •
CHD With PVH/CHF
- •
Cor triatriatum
- •
Mitral stenosis
- •
Hypoplastic left heart syndrome (HLHS)
- •
Coarctation of the aorta
- •
Cardiomyopathy
- •
Primary endocardial fibroelastosis
- •
Anomalous ICA
- •
Obstructed TAPVC
Increased incidence in females: ASD, PDA, and Ebstein anomaly
Increased incidence in males: AS, coarctation, pulmonary/tricuspid atresia, hypoplastic left heart, TGA
Use of Imaging Modalities for Evaluation of CHD in Pediatric and Adult Populations
Chest Radiograph
- •
Determine to which of the four categories a CHD belongs (based on pulmonary vascularity and cardiac contour abnormalities).
- •
Abdomen: determine situs
- •
Bones: certain CHDs are associated with osseous abnormalities such as 11 ribs or hypersegmented sternum (Down syndrome).
Ultrasound
- •
Often allows diagnosis of a specific disease entity
Cardiac CT
- •
To determine coronary anatomy, assess complex anatomy and postoperative complications and redosternotomy
- •
Suitable for patients who cannot undergo MRI
Cardiac MRI
- •
To assess complex anatomy and postoperative complications
- •
Shunt quantification and assessment of myocardium
Angiography
- •
Confirmation of diagnosis
- •
Pressure measurements
- •
Oxygenation
- •
Intervention
Acyanotic CHD With Increased Pulmonary Vascularity
Ventricular Septal Defect ( Fig. 2.21 )
Second most common congenital cardiac anomaly

Types
- •
Membranous, 80%
- •
Muscular, 10%
- •
AV, 5%
- •
Conal, 5% (mostly supracristal)
Clinical Findings
- •
Small to moderate defects are initially asymptomatic.
- •
Large defects lead to CHF at 2–3 months of age.
- •
75% close spontaneously by age 10.
- •
3% of patients develop infundibular stenosis.
- •
Eisenmenger syndrome (elevated pulmonary resistance leads to increased right-sided pressures) may develop in long-standing large defects; the end result is a R-L shunt with cyanosis.
Hemodynamics ( Fig. 2.22 )
- •
Blood flow from LV through IVS into RV
- •
Redundant flow: LV → VSD → RV → PA → LA → LV

Radiographic Features
Because of the variation in size of VSD, the radiographic features are variable and may range from normal cardiac size and pulmonary vessels to large RV, LV, and LA.
CXR findings
- •
Small VSD: normal CXR
- •
Significant shunt (Q pulm /Q aorta >2): enlargement of heart, PAs, and LA
- •
Eisenmenger physiology
Enlarged PAs
Cardiac and LA enlargement may decrease RVH
Peripheral PAs become constricted (“pruning”)
Calcified PA (rare)
- •
US is the diagnostic method of choice.
Angiography is commonly performed preoperatively (pressure measurement, oxygenation).
Cardiac CT and MRI useful for shunt quantification and in cases where US is limited (e.g., apical or inlet type VSDs and prepercutaneous closure planning)
Treatment
Expectant in small asymptomatic VSD because there is spontaneous closure in infancy, 30%
Surgical therapy (patch) in patients with CHF, pulmonary hypertension (HTN), or progressive worsening
Atrial Septal Defect ( Fig. 2.23 A–B )
Most common congenital cardiac anomaly


Types ( Fig. 2.23 C )
- •
Ostium secundum type: most common, 60%
- •
Ostium primum ASD: part of the ECD syndromes, 35%
- •
Sinus venosus defect (at entrance of SVC): always associated with PAPVC anomalous venous return, 5%
- •
Unroofed coronary sinus (rare)
Associations ( Fig. 2.24 )
- •
Holt–Oram syndrome: ostium secundum defect
- •
Lutembacher syndrome: ASD and mitral stenosis
- •
Down syndrome: ostium primum defect

Clinical Findings
- •
May be asymptomatic for decades because of the low atrial pressure; even large defects are much better tolerated than VSD or PDA.
- •
Female preponderance
- •
May present with pulmonary hypertension
Hemodynamics
- •
Blood flows from LA to RA
| Right Side | Left Side | |
|---|---|---|
| Atrium | Enlarged | No change |
| Ventricle | Enlarged | No change |
| Vasculature | Increased | Aorta no change |
Radiographic Features ( Fig. 2.25 )
Plain radiograph
- •
RA, RV, and PA enlargement; no LA enlargement (different from VSD)
- •
The AA appears small (but in reality is normal) because of the prominent pulmonary trunk and clockwise rotation of heart (RV enlargement).
- •
US
- •
Imaging modality of choice for diagnosis
- •
Angiography
- •
Useful for identifying associated anomalous pulmonary veins
- •
Cardiac CT and MRI
- •
Useful for sizing the defect before percutaneous closure, Qp/Qs flow quantification and identification of associated anomalies such as anomalous pulmonary venous drainage.
- •

Patent Ductus Arteriosus
In the fetus, a PDA represents a normal pathway of blood flow.
- •
Fetal circulation: flow from PA to aorta as intrauterine bypass of nonaerated lungs
- •
PDA closes functionally 48 hours after delivery.
- •
PDA closes anatomically after 4 weeks.
Highest incidence of PDA occurs in premature infants (especially if hyaline membrane disease is present) and in maternal rubella; females > males
Clinical Findings
- •
Most are asymptomatic.
- •
Large defects lead to CHF at 2–3 months of age.
Hemodynamics
There is an L–R shunt because the pressure in the aorta is higher than in the pulmonary circulation.
| Right Side | Left Side | |
|---|---|---|
| Atrium | No change | Enlarged |
| Ventricle | No change | Enlarged |
| Vasculature | Enlarged | Aorta enlarged |
Radiographic Features
- •
Small PDA: normal CXR
- •
Increased pulmonary vascularity
- •
Enlargement of LA, LV
- •
Eisenmenger physiology may develop in long-standing, severe disease.
- •
All the above features are identical to those seen in VSD; specific features to suggest PDA are:
- •
Unequal distribution of pulmonary arterial blood flow, especially sparing of left upper lobe
- •
Enlargement of aorta and AA
- •
PDA may be seen as faint linear density through the PA (occasionally calcifies).
- •
Cardiac CT helps in determining precise location and size as a roadmap before percutaneous closure.
- •
Treatment
- •
Indomethacin (inhibits PGE 1 , which is a potent dilator of the duct); successful in 60% of infants
- •
Ligation of ductus through left thoracotomy
- •
Catheter closure with umbrella device
Endocardial Cushion Defect (ECD) ( Fig. 2.26 )
Forty percent of ECD patients have trisomy 21 (Down syndrome).

Types
- •
Partial AV canal (ostium primum defect ± cleft in anterior mitral or septal tricuspid leaflets)
- •
Transitional AV canal (ostium primum defect, cleft in both AV valves, defect in superior IVS)
- •
Complete AV canal (ostium primum defect, cleft in both AV valves, large defect in IVS: either common AV valve or separate mitral and tricuspid valves)
Clinical Findings ( Fig. 2.27 )
- •
Partial canals may be asymptomatic; both the degree of mitral insufficiency and the shunt through the ASD determine the clinical picture.
- •
Complete AV canal consists of large L–R shunts (ASD, VSD), mitral insufficiency, and CHF.