Fig. 16.1
Posterior view of all four cardiac valves (drawing) during systole with opening of the aortic and pulmonic valve (Panel A) as well as during early diastole (Panel B). Also shown are the left and right coronary artery arising from the left and right sinus of Valsalva, respectively, the posterior noncoronary sinus of Valsalva, and the great cardiac vein with the coronary sinus opening into the right atrium
The standard views for evaluation of the aortic valve and the mitral valve are summarized in Table 16.1. Please see also Chaps. 3 and 10 for details on anatomy and image interpretation.
16.2 CT Examination Technique
For evaluation of valvular morphology, at least one cardiac phase is necessary (e.g., for imaging of the bicuspid valve, the end-diastolic phase is sufficient). Hence, low-dose techniques such as prospective ECG gating can be used for evaluation of morphology. Also, aortic regurgitation can be assessed on static end-diastolic phases.
For evaluation of valvular function, CT data need to be acquired during the entire cardiac cycle. To date, retrospective ECG gating is the mode of first choice. ECG tube current modulation (with ~20% tube current reduction during systole) can be applied in the conventional mode, but leads to an increase in image noise, which can reach nondiagnostic levels, especially in morbidly obese patients. Special care needs to be taken when adjusting scan parameters for tube current modulation in obese patients (e.g., by tube current or tube voltage elevation). Very recently introduced prospective scan modes using dual-source and wide-area detector CT allow expansion of the scan window during the entire cardiac cycle, hence evaluation of cardiac function has become feasible.
A biphasic contrast agent injection protocol is advantageous over a monophasic injection for optimal timing of the contrast bolus to ensure right ventricular enhancement and adequate evaluation of all four cardiac valves and cardiac regional and global function. If only the aortic and mitral valves need to be assessed, a monophasic bolus injection as commonly applied for coronary CT angiography is appropriate.
16.3 Valvular Heart Disease
16.3.1 Aortic Stenosis
Degenerative aortic stenosis is very common with a prevalence of 2–5% in the elderly population >65 years. The pathomechanisms are similar to those in coronary heart disease, involving a degenerative process leading to aortic valve calcification and developing slowly during a lifetime. Rheumatic disease can cause aortic stenosis as well. Rarely, subaortic stenosis, defined as the presence of a congenital subaortic annulus membrane leading to narrowing of left ventricular outflow tract, may be present. These thin membranes are often well visualized by cardiac CT, and appear as hypodense flap-like lesions below the annulus.
Transthoracic echocardiography is the clinical reference modality to establish the diagnosis of aortic stenosis, based on measurement of transvalvular pressure gradients and calculation of the aortic valve orifice area using the Doppler-velocity time integral (continuity equation). This formula has some limitations and its accuracy for hemodynamic estimation of the effective aortic valve orifice is limited, e.g., in the presence of low-flow, low-pressure gradient aortic stenosis, or in case of reduced cardiac output. In addition, other factors such as eccentricity of left ventricular outflow tract (LVOT) influence these measurements. In contrast, the anatomic (= geometric) aortic valve area obtained directly from cross-sectional imaging techniques such as cardiac CT (Fig. 16.2) or magnetic resonance imaging (MRI) is not affected by external factors and flow phenomena. Several studies, with more than 300 patients enrolled, showed a high correlation of CT with transthoracic echocardiography. The size of the aortic valve area is used to classify the severity of aortic stenosis as mild, moderate, and severe (Table 16.2). Images should be reconstructed at early/mid systole, which is the time point of maximal aortic valve opening, and depicted at 10–25% of the RR-interval pending on a patient’s individual heart rate. Importantly, the phase with the best image quality should be selected for final sizing of the AVA. The best phase is also somewhat variable among various scanner generations. CT scanners with highest temporal resolution are advantageous for optimal image quality without motion artifacts during systole. The views for evaluation of the aortic valve are shown in Fig. 16.3 and listed in Table 16.1. Multiplanar reformations should be applied, and left coronal oblique views, three-chamber views, and cross-sectional oblique axial views of the aortic valve should be reconstructed.
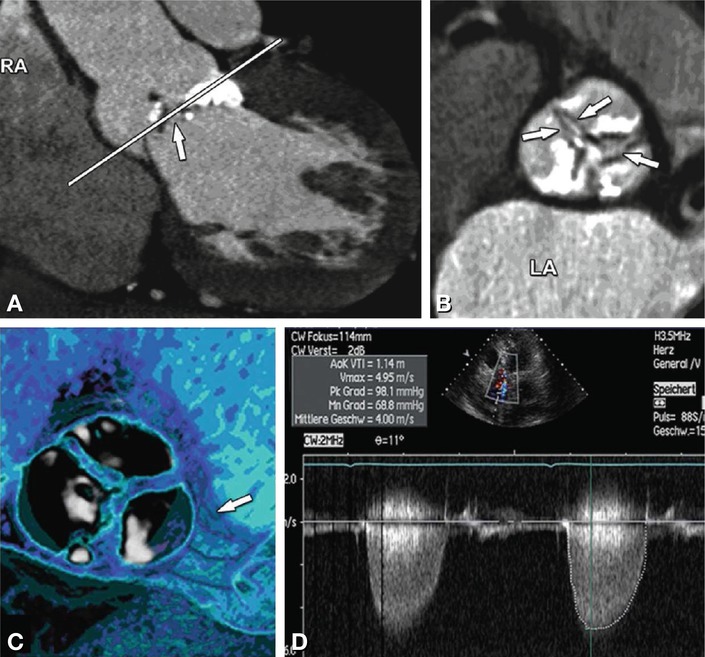
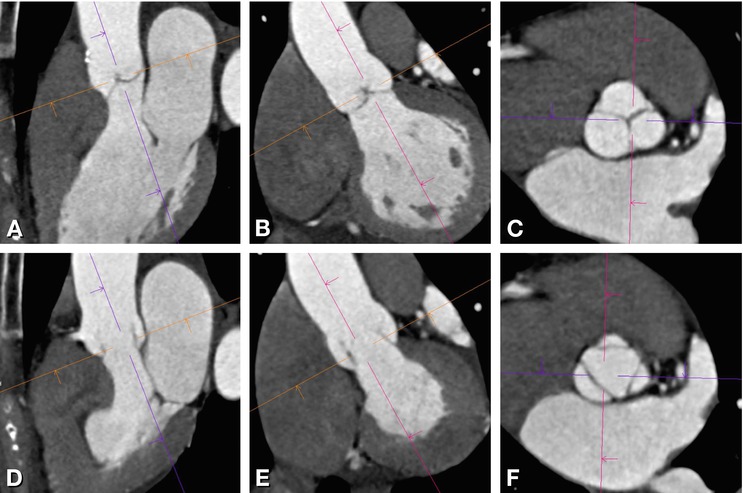

Fig. 16.2
Tricuspid aortic valve with severe calcification and stenosis. Left coronal oblique view of aortic root (Panel A). The white line in Panel A indicates the position of the cross-sectional image of the aortic root (Panel B) which allows measurement of the inner aortic valve orifice area (delineated with arrows). The calcifications are also nicely shown in a three-dimensional volume rendering (Panel C) with the arrow pointing at the left coronary ostium. Transthoracic echocardiography (Panel D) shows increased velocity of 4 m/s and transvalvular pressure gradient (PK Grad peak gradient, Mn Grad mean gradient) over the aortic valve. RA right atrium, LA left atrium
Table 16.2
Staging of aortic stenosis (AS)
Classification | Staging | AVA |
|---|---|---|
AS I | Mild | >1.5 cm2 |
AS II | Moderate | 1.0–1.5 cm2 |
AS III | Severe | <1.0 cm2 |
Severe critical | <0.7 cm2 |

Fig. 16.3
Three standard views of the aortic valve during end-diastole (above) and mid-systole (below). Three-chamber view (Panel A) left coronal oblique (Panel B), and cross-sectional axial oblique (Panel C), reconstructed with double-oblique multiplanar reformations during end-diastole and during mid-systole (Panels D–F)
The following clinical applications for measurement of the aortic valve area are useful: first, in patients referred for coronary CT angiography, if valve calcification is present, the aortic valve area may be measure because these patients may have aortic stenosis or just non-stenotic valve calcification. Second, patients who require a second imaging modality for accurate sizing of the aortic valve area, e.g., in case of pending cardiac surgery, and/or if echocardiography has inherent limitations such as in low-flow low-gradient aortic stenosis. In these patients, CT can also yield information about the presence of coronary artery disease, left ventricular function, and the size of the aortic annulus. Left ventricular function is a valuable predictor of outcome in severe aortic stenosis. Accurate sizing of aortic root dimensions is required especially before minimally invasive aortic valve replacement or percutaneous transcatheter valve implantation.
16.3.2 Bicuspid Aortic Valve
CT can also identify bicuspid or tricuspid valve morphology (Fig. 16.4). The aortic valve can be congenitally bicuspid (without or with a fused raphe) or develop a secondary degenerative bicuspid shape due to calcification and adhesions. This information is of interest in clinical practice for cardiac surgeons to define the surgical approach (valve replacement versus possible surgical reconstruction) or to define further patient management. Congenital bicuspid valves are prone to developing dysfunction (regurgitation or stenosis), hence those patients may need to be followed up closer.
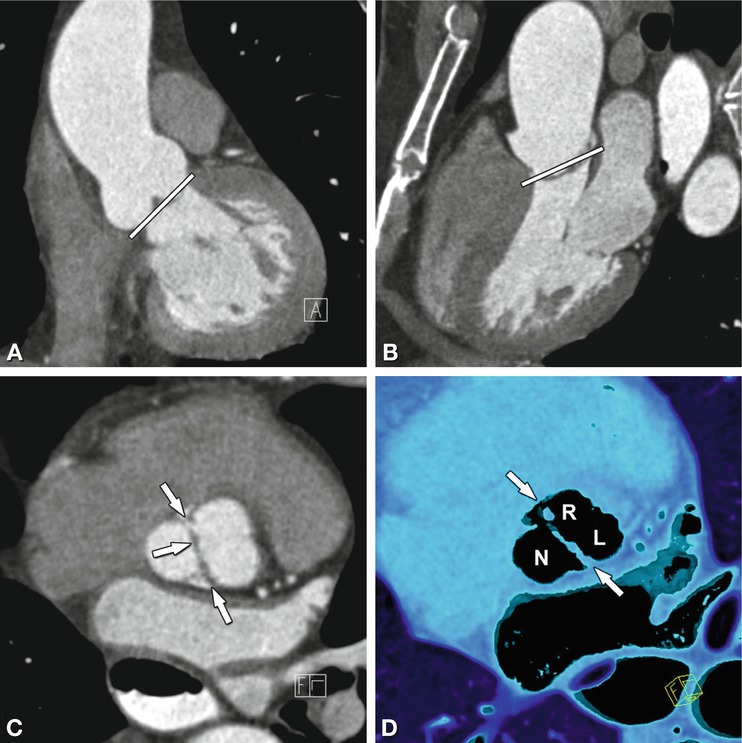

Fig. 16.4
Congenital bicuspid aortic valve reconstructed from standard views of the aortic valve during diastole. Panels A is a left coronal oblique and Panel B a three-chamber view. The line on Panels A and B indicates the plane of Panel C. Panel C is a cross-sectional axial oblique view and Panel D a corresponding volume rendering showing a bicupsid aortic valve consisting of two cusps only (“linear sign”, arrows) during diastole. The left (L) and right (R) coronary cusp are fused (Panel D) and there is no raphe
16.3.3 Aortic Valve Calcification
CT allows quantification of aortic valve calcifications by using the same commercially available software as for coronary artery calcium scores. The aortic valve calcium score provides independent prognostic information in patients with asymptomatic aortic stenosis. Moreover, an aortic valve calcium score cut-off of 1,100 Agatston units is associated with a high likelihood of aortic stenosis. Thus all patients referred for nonenhanced coronary calcium scoring, in whom aortic valve calcification is an incidental finding, should be referred for transthoracic echocardiography for further evaluation.
16.3.4 Aortic Regurgitation
The onset of aortic regurgitation (AR) is either acute or chronic. Whilst acute aortic regurgitation is seen in fulminant infective endocarditis or ascending aortic dissection involving the valve, chronic aortic regurgitation can develop on the basis of several underlying diseases, the most common being aortic root dilatation and aneurysm formation (Fig. 16.5) as well as degenerative or rheumatic disease.
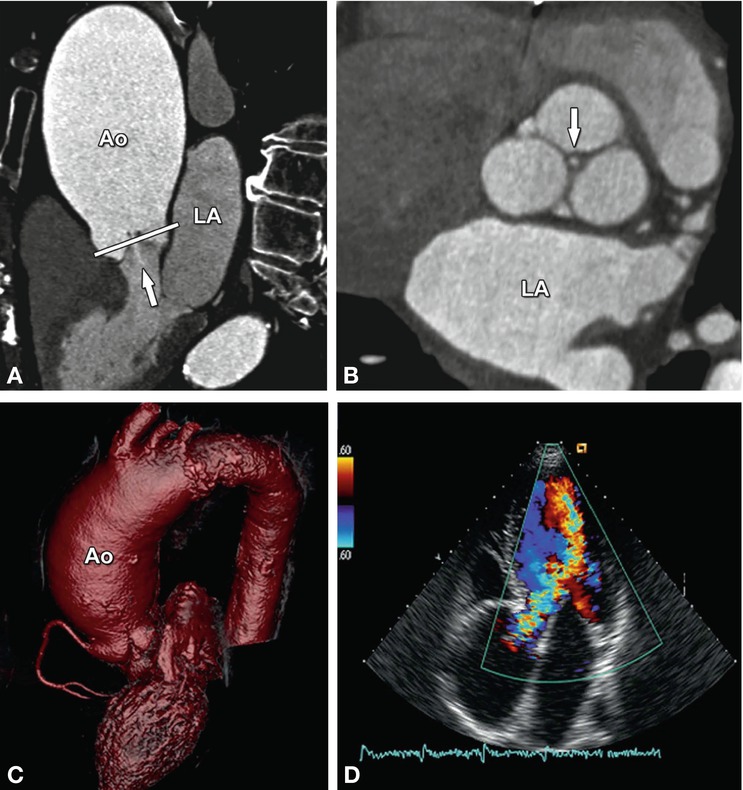

Fig. 16.5
Aortic regurgitation due to ascending aortic (Ao) aneurysm. The three-chamber view (Panel A) shows incomplete closure of the aortic leaflets during diastole with a regurgitant jet downstream into the left ventricular outflow tract (arrow). The white line in Panel A indicates the position of the cross-section through the aortic root (Panel B). This cross-section shows central valvular leakage (arrow, aortic regurgitant orifice area). The ascending aortic aneurysm is shown in a three-dimensional volume rendering in (Panel C) and the corresponding echocardiography (Panel D) shows a Doppler regurgitation jet (“vena contracts”) towards the left atrium. LA left atrium
In patients with aortic regurgitation, cardiac CT allows visualization of the anatomic regurgitant orifice area. This area can be seen as central valvular leakage area, reflecting an incomplete co-adaption of cusps (Fig. 16.5


Stay updated, free articles. Join our Telegram channel

Full access? Get Clinical Tree


