Outline
Topic 10, Figure 359
- 1.
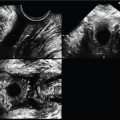
Fig. 359 . Topic: Anal Sphincter Complex (ASC) Color Power Doppler Pulse Repetition Frequency Settings.

Fig. 359
Pulse repetition frequency (PRF) indicates the number of ultrasound pulses emitted by the transducer over a designated time frame. It is typically measured as cycles per second or hertz (Hz). The PRF is operator dependent. When using Color Power Doppler, the PRF knob should not be set too low, otherwise image pixels will demonstrate a “blush” to the entire color box, misgauging “flow” where there is none (screen left). Contrarily, if the PRF is set too high, real vascularity will not be present on an image at all, which will underestimate the presence of any vessels and will certainly underrepresent abnormal vascularity (screen right). When the PRF is set appropriately, clear presence of real abnormal flow will be seen (gold arrow).
Case 166, Figure 360
- 2.
Though the presence of the correctly placed intrauterine device (IUD) is easy to visualize, there is a wide variability in actual IUD location when comparing exams. Figs. 360–362 are each a different IUD case.
Fig. 360 is a 3D volume set using a 6–12 MHz endovaginal (EV) transducer with a rendered image of a recently placed IUD. Answer the following with a Yes or No.
- a.
Is the stem located centrally? _____
- b.
Are the arms contained within the endometrial cavity? _____
- c.
Is the uterus retroverted? _____
- d.
Is the center reference point seen on all planes with the green line of reference (LOR) at the appropriate place to optimize the IUD on the rendered image? _____

Fig. 360
- a.
Case 167, Figure 361
Fig. 361 is a 3D volume set using a 5–9 MHz EV transducer of a postpartum patient who is highly anxious that her recently placed IUD may not be present. Answer the following.
- e.
Where is the center reference point placed on the volume set to assess the IUD placement? _____
- f.
Is the IUD placed centrally? _____
- g.
To what on the C plane are the green arrows pointing? _____

Fig. 361
- e.
Case 168, Figure 362
- 3.
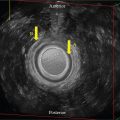
Fig. 362 is a 3D volume set on a patient with pelvic discomfort since her IUD was placed. The rendered image has been removed. Which of the following is where the center reference point is placed on the volume set?
- a.
It is placed to the right of the midline (ML) central cavity within the right submucosal myometrium.
- b.
It is placed to the left of the ML central cavity within the left submucosal myometrium.
- c.
It is placed within the central endometrial cavity.
- d.
It is placed within the intramural myometrium anterior to the endometrium.

Fig. 362
- a.
- 4.
Fig. 362 . Is the IUD placed centrally within the endometrial cavity?
- a.
Yes
- b.
No
- c.
Cannot tell from these images
- a.
Case 169, Figures 363–365
- 5.
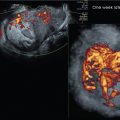
Figs. 363–365 are images, using a 5–9 MHz EV transducer, of a 33-year-old patient found to have pelvic fullness at her annual exam.
- a.
Which ovary has a normal parenchymal echo pattern? _____
- b.
Which ovary has abnormally increased size? _____
- c.
Which ovary has normal follicular appearance? _____
- d.
Which ovary has an irregular contour? _____

Fig. 363

Fig. 364

Fig. 365
- a.
- 6.
Color Power Doppler hypervascularity is well visualized on Figs. 364 and 365 of the right ovary. The resistive index at this area (not shown) was 0.71. Is hypervascularity increased at the intraovarian parenchyma or at the hilum? _____
- 7.
Of the following, which is the least likely diagnosis for this appearance?
- a.
Ovarian carcinoma
- b.
Polycystic ovarian syndrome
- c.
Dysgerminoma tumor
- d.
Sertoli–Leydig cell tumor
- a.
Case 170, Figure 366
- 8.
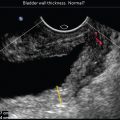
Fig. 366 is a mid-uterine transverse image of the lower uterine segment using a 4–8 MHz EV transducer. Which of the following is the most likely etiology for the appearance at the red arrow?
- a.
Anterior subserosal leiomyoma
- b.
Cesarean section scar
- c.
Large endometrial polyp
- d.
Septate uterus
- e.
Intramural degenerated leiomyoma

Fig. 366
- a.
Case 171, Figures 367–370
- 9.
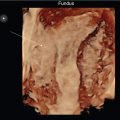
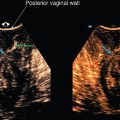
Figs. 367–370 are transperineal images, using a 6–12 MHz EV transducer, of a 63-year-old patient referred for suspected rectal prolapse that was thought to be compressing the distal vagina anteriorly. Pelvic floor 3D imaging is typically created from a transperineal sweep performed in what plane (the place where the original sweep is placed on the A, B, C volume set).
Fig. 367 . In this case, what plane is the A plane?
- a.
Coronal
- b.
Sagittal
- c.
Transverse

Fig. 367
- a.
- 10.
Fig. 367 . Identify the location of the center reference point (CRP) that is seen on all three orthogonal planes.
- a.
Distal urethra
- b.
Distal vagina
- c.
Mid-urethra
- d.
Anal angle of the anal sphincter complex
- a.
- 11.
The structures of this volume set to which the arrows are pointing on Figs. 367–370 would be described in terms of:

Fig. 368

Fig. 369

Fig. 370
Size and shape: Fig. 367 . There is an oval-shaped structure that consists of two adjacent components (between gold lines). The hypoechoic trapezoidal-shaped anterior aspect (red arrow) measuring 10 mm and a more hyperechoic oval-shaped posterior aspect (blue arrow) measuring 18 mm together create an oblong heterogeneous structure.
Echo pattern: All echo comparisons are relative, and in difficult cases like this, the examiner must be careful to appreciate anatomic variations from normal. Since the overall abnormality is heterogeneous (between gold lines), compare the anterior aspect to relative structures and the posterior aspect to relative structures; therefore, the echo pattern is isoechoic where adjacent to the vagina (red arrow) and isoechoic to the bulging central mucosa at the inferior posterior aspect of the bulge (blue arrow). The green arrow points to the connection between the normal central mucosa and the inferior bulge to which it is connected.
Origin: The origin of the mass structure appears to be rectal with the anterior hypoechoic aspect thought to represent the bulging distal internal anal sphincter (IAS) folded over itself and the posterior hyperechoic aspect representing the bulging central mucosa folded over itself (see between the gold lines on Fig. 367 ).
Fig. 368 represents measurements of the anteroposterior diameter of the posterior urethral wall/anterior vagina. Are the measurements symmetric? Yes or No? _____
- 12.
The green LOR on the 3D volume set is brought down to the area of interest on Figs. 368–370 . The CRP is also moved from the mid-urethra on Fig. 367 to this IAS/central mucosa interface on Fig. 368 , better delineating it on all three orthogonal views. Is there a rectal prolapse? Yes or No? _____
Case 172, Figures 371–375
- 13.
Figs. 371–375 are those of a 17-year-old with spina bifida who had a recent ultrasound exam and a diagnosed adnexal mass. This follow-up was performed 6 weeks later. The patient is not sexually active. Figs. 371 and 372 demonstrate transabdominal views of normal ovaries, though the bladder was only partially full.