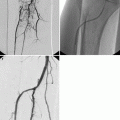
Fig. 13.1
MDCTA images. Volume-rendered (a) and maximum-intensity projection (b) post-processed CTA images show a bypass between the femoral arteries (white arrow) in a 67-year-old patient. Also visible is the presence of an endovascular stent graft in the abdominal aorta and common iliac arteries
In the first- and second-generation scanner (sequential scanner), the scan volume was covered in a stepwise manner: The table, after acquiring an axial section, was moved and the next scan was performed. The most important limitation of this type of scanning technique was that it was extremely slow. A major improvement in the CT technology was the incorporation of continuously rotating X-ray tubes with a single-detector row longitudinally positioned in the gantry. This was the introduction of third-generation geometry (spiral CT). With these scanners, an X-ray tube and a detector array rotate synchronously and continuously around the patient, and it became possible to acquire volume data of the patient. This technique is the basis of CTA because it allows rapid and continuous imaging of a large volume so that the contrast enhancement is present only in the arteries and not in the veins.
In 2001 the introduction of 16-slice CT scanners finally allowed isotropic CT scanning with the ability to produce 1,000 images in less than 15 s. As compared to 4-detector-row scanners, performance of 32- to 64-detector-row scanners has increased more than 20 times owing to more detector rows and faster rotation speed. A recent important improvement in the CT technology is the introduction of the dual source CT (Wintermark et al. 2008a; Fishman 2003).
Nowadays, isotropic voxels, high spatial and temporal resolution, and use of fast contrast material injection rate and post-processing tools improved sensitivity and specificity of MDCTA. This technique allows full vascular imaging in a few seconds from the aorta to the circle of Willis. For instance, examination of the whole length of the carotid arteries from the aortic arch to the circle of Willis requires only a 2-s scan time with a 128-detector-row CT (64 × 0.6 mm, pitch of 1.33, 0.33-s rotation time).
13.2.1.2 Principles
CT is an X-ray technique in which an X-ray source rotates around an object and the X-ray passes through the object from various directions. The X-ray attenuation along each of the many paths through the object is analyzed by a mathematical image reconstruction (inverse Radon transformation) to calculate the local attenuation coefficient at each point within the acquisition volume. After this phase the local attenuation coefficients are normalized to yield CT numbers for every point of the matrix. At the end of the process, these CT numbers are converted into shades of grey.
In the use of the MDCTA, a fundamental step is to understand the scanning parameters. It is possible to identify three major categories: (1) acquisition parameters, (2) derivative parameters, and (3) reconstruction parameters. The acquisition parameters are the following: number of active detector rows, section collimation, rotation time, table feed per rotation, pitch factor, scan length, tube voltage, and tube load. Among these the section collimation is extremely important: it is determined by the total width of the acquired volume in the center of the scan field divided by the number of sections. The derivative parameters are the following: table speed (which is determined by the ratio of table feed and rotation time) and scan duration (measured in seconds and determined by the ratio of scan length and table speed). The reconstruction parameters are the following: field of view (FOV), matrix size, reconstruction filter, section thickness, and reconstruction interval. The FOV determines which part of the data will end up in the images, and the matrix size is the limiting factor for spatial resolution. Decreasing the matrix can reduce spatial resolution, but a very large matrix size cannot increase resolution beyond the inherent system resolution.
13.2.1.3 Image Processing
The latest generation of CT systems allows for isotropic imaging, and as a consequence, the distinction between transverse and in-plane resolution is gradually becoming a historical remnant, and the traditional axial slice is losing its clinical predominance. In fact it is now replaced by interactive viewing manipulation of isotropic volume images. Image processing and three-dimensional reconstruction of diagnostic images represent a necessary tool for depicting complex anatomical structures and understanding pathological changes in terms of both morphology and function.
In studying the vascular system with MDCT, it is possible to use different post-processing techniques. Projectional methods project a 3D volume into a bidimensional plane: multiplanar reformations (MPR), maximum-intensity projection (MIP), and minimum-intensity projection (MinIP). The perspective methods display a 3D virtual model with techniques that aim to reproduce the perspective of the human eye: shaded surface display (SSD) and volume rendering (VR).
The maximum-intensity projection (MIP) (Fig. 13.2) technique simulates rays that are traced from the radiologist through the object to the display screen, and only the relative maximum value detected along each ray path into the selected slab is considered in the algorithm of visualization; in this technique, only the voxel with the highest CT number is displayed, depending on the voxel position along the projecting ray (Prokop et al. 1997). With MIP it is possible to obtain images similar to digital subtraction angiography (DSA), but with this technique, there are some artifacts that radiologists need to be aware of: in particular a high density structure (e.g., calcification) may obscure information from intravascular contrast material. Therefore, mural plaque calcifications may obscure the lumen and may lead to an overestimation of the degree of luminal stenosis.
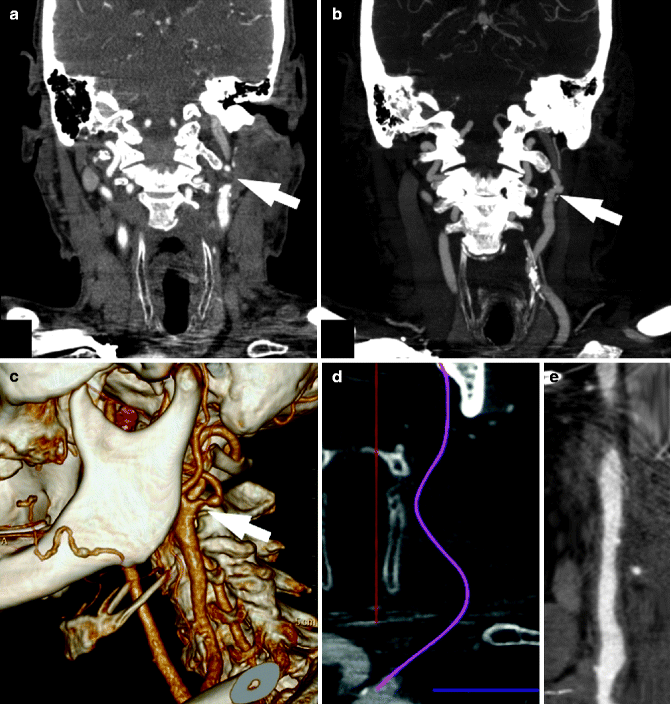

Fig. 13.2
MDCTA post-processing techniques. CTA images in a 74-year-old patient who suffered a left transient ischemic attack. Different post-processing techniques demonstrated the presence of the stenosis in the left internal carotid artery (white arrow). Multiplanar reconstruction (a), maximum-intensity projection (b), volume rendering, (c) and curved planar reconstruction (d, e)
Multiplanar reformations (MPR) (Fig. 13.2) provide images that can be oriented in every spatial direction by using arbitrary chosen views; this technique is mainly used for quantitative lumen analysis because it can depict the lumen shape.
Curved plane reconstruction or CPR (Fig. 13.2) is another two-dimensional post-processing method that shows the cross-sectional profile of a vessel along its length (Calhoun et al. 1999; Rankin 1998; Rubin et al. 1995). This technique is frequently used in the analysis of vessels because they commonly have curvilinear morphology that oblique reformations cannot capture. Some authors consider CPR a variation of MPR.
Volume rendering (VR) (Fig. 13.2) incorporates all CT raw data to produce high-quality three-dimensional images. The purpose of VR algorithms is to represent and analyze volume data in a realistic way by integrating a series of axial CT sections into a form that is easier to interpret than the original images.
13.2.2 Magnetic Resonance
13.2.2.1 Introduction
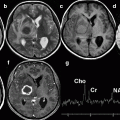
In recent years, MR has become a fundamental method to evaluate vascular pathology. With the use of different acquisition techniques, it is possible to obtain information to quantify, identify, and characterize the pathology that affects the vessels (Fig. 13.3). In particular, in the last decade, significant progress has been made towards noninvasive detection of vulnerable atherosclerotic plaques using MR angiography (MRA) (Saam et al. 2007; Briley-Saebo et al. 2007). This imaging technique does not involve ionizing radiation and enables visualization of the vessel lumen (Choudhury et al. 2002; Yuan et al. 2001). The first application of MR to the vascular system started in the mid-1980s (Alvarez et al. 1986; Wehrli et al. 1986), and in the last years, there have been significant improvements thanks to the increase of the magnetic field strength (from 0.3 to 3 T and more), the development of coils dedicated to carotid artery analysis (surface coils), the creation of advanced sequences for the data acquisition (black-blood techniques, time of flight), and the use of contrast material that improves the visualization of the vessel lumen.
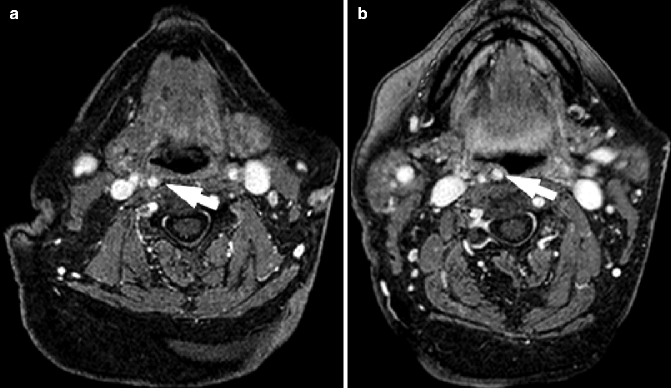

Fig. 13.3
MRI of carotid arteries. MRI of a 71-year-old patient who suffered right amaurosis. Images show the right internal carotid artery (white arrow). These images clearly show the anatomical course of the neck vessels
The first MRA method, phase-contrast MRA was quickly followed by (2D) and 3D time-of-flight (TOF) MRA. TOF MRA has been widely adopted for an array of clinical indications but is relatively insensitive to slow flow and is associated with long scan times and signal voids, all of which can lead to poor-quality imaging and overestimation of stenosis. More recently, contrast-enhanced (CE) MRA has been introduced. CE-MRA produces high-quality images in a very short time and may alleviate some of the drawbacks associated with TOF MRA.
Since atherosclerotic disease affects the entire arterial system, it is desirable to extend coverage, allowing concomitant assessment of the arterial system from the carotid arteries to the distal runoff vessels. The implementation of “bolus chase” techniques extended coverage to encompass the entire runoff vasculature, including the pelvic, femoral, popliteal, and trifurcation arteries. It is important to underline that MRA, however, is sensitive to artifacts caused by slow and turbulent flow associated with high-grade stenosis. For reliable diagnostic results, physicians and radiologists must be familiar with the different acquisition techniques.
13.2.2.2 Principles
MRI has emerged to be one of the major noninvasive methods for the evaluation of the vascular system. Most imaging of the vessel analysis by MRI has been performed on 1.5 T scanners. Recently, 3.0 T scanners and their resulting high-resolution images have opened the field of vascular imaging to new potentials. MR imaging of the vascular bed is possible using non-contrast MRA and contrast MRA:
Non-contrast MRA with Time-of-Flight Sequences
Time-of-flight sequences are gradient-echo sequences acquired perpendicularly to the longitudinal axis of the vessels with extremely short repetition times (TR): the resulting difference in spin saturation between the moving protons in blood (unsaturated) and stationary tissues (completely suppressed) creates the “in-flow enhancement” that produces the angiographic effect used for ToF imaging (Fig. 13.4). To achieve the maximum possible difference in signal intensity between blood and stationary tissue and to avoid venous enhancement, TR should be calibrated based on flow velocity. Additional saturation pulses can be adopted to further suppress the intrinsic signal of these structures. It is possible to acquire ToF sequences by using 2D or 3D k-space sampling. Three-dimensional k-space sampling is known as MOTSA (multiple overlapping thin slab acquisitions), and it seems to be more accurate for the detection and grading of stenosis. One of the main limitations of ToF sequences is that at the site of tighter stenosis, blood flow may become turbulent, with slow-moving protons producing dephasation effects with unpredictable signal loss within vessel lumen, leading to stenosis overestimation.
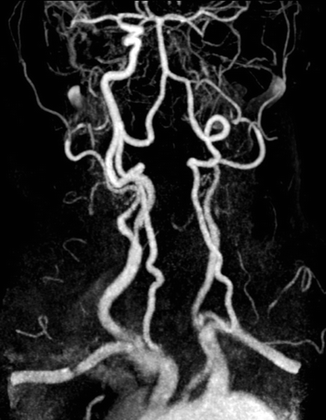

Fig. 13.4
MR Time of Flight (TOF). MRI in a 71-year-old patient who suffered right amaurosis. Image clearly depicts the arterial vascular system of the neck and the absence of the left internal carotid artery, from its origin to the circle of Willis
Contrast-Enhanced MRA with T1-Weighted 3D Gradient-Echo Sequences
CE-MRA is based on the principle of shortening the T1 relaxation time of blood by intravenously injecting Gd-chelate contrast agents. This causes a significant difference in signal intensity between flowing blood and stationary tissue at heavily T1-weighted arterial phase imaging, leading to the high signal intensity of blood on post-Gd T1-weighted sequences.
The magnitude of vascular enhancement depends on the concentration of contrast agent within the vascular bed during acquisition, and ideally imaging should be performed at the peak of vascular enhancement, when a maximum difference between signal intensity of the target vessel and the surrounding overlapping structures exists. An important difference of CE-MRA compared to ToF is that CE-MRA is less flow sensitive and therefore does not overestimate the degree of luminal stenosis as can happen in ToF sequences. The most relevant limitation of CE-MRA in the imaging of carotid arteries is that the arterial phase acquisition must be limited in duration to avoid the rapid onset of jugular enhancement, thus imposing relevant constraints to spatial resolution (Nederkoorn et al. 2003; Lenhart et al. 2002).
13.2.3 Ultrasonography
13.2.3.1 Introduction
Ultrasonography is globally accepted as the standard imaging modality for first-line diagnosis of vascular pathology in all major vascular beds ranging from the carotid arteries to the arteries of the lower extremities. This high-resolution, noninvasive technique is readily available, rapidly applicable, and can be performed at relatively low cost (Fig. 13.5). High-frequency linear transducers (>7 MHz) are ideal to achieve high spatial resolution, whereas lower-frequency linear transducers (<7 MHz) are preferred for Doppler examinations and analysis of central vessels like the aorta.
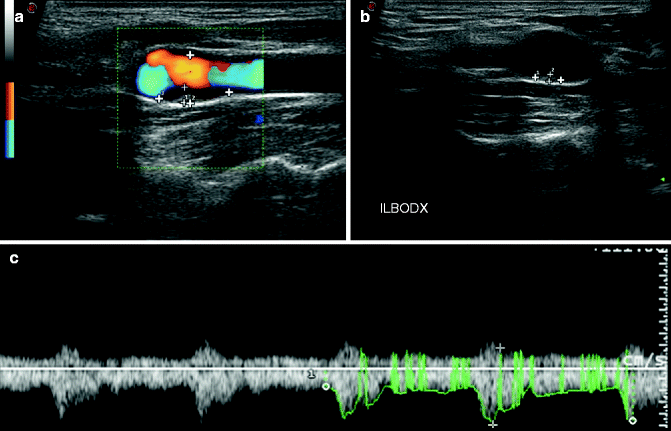

Fig. 13.5
Ultrasound. Images demonstrate the presence of a small heterogeneous plaque in the right ICA (a, b). In panel c the spectra are given
It has been widely demonstrated that ultrasound is a good screening technique even though some relevant limitations persist, in particular for the quantification of stenosis, including high operator and center variability, artifacts arising from calcifications, and difficulties in distinguishing subtotal occlusion from total occlusion.
13.2.3.2 Principles
Ultrasonography of the carotid arteries is the modality of choice for triage, diagnosis, and monitoring of the pathology affecting peripheral vessels. This is an operator-dependent examination that requires a good understanding of Doppler physics and hemodynamic physiology. In fact the accuracy, sensitivity, and specificity of carotid ultrasound hinge on following standard guidelines and practicing meticulous scanning techniques because there are several pitfalls that may mislead the operator to falsely interpret color and spectral Doppler findings.
Two main type of analysis can be performed by ultrasound: Doppler ultrasound and B-mode (morphological) ultrasound. The Doppler analysis evaluates the velocity of the flowing blood and is very useful in analysis of the atherosclerotic disease of carotid arteries as well as of iliac, femoral, popliteal, and tibial arteries. In this kind of exam, the angle theta affects the detected Doppler frequencies. In particular in the carotid artery analysis, at a Doppler angle of 0°, the maximum Doppler shift will be achieved since the cosine of 0° is 1. Conversely, no Doppler shift (no flow) will be recorded if the Doppler angle is 90° since the cosine of 90° is 0. It is possible to visualize the Doppler frequencies in a morphological way by using the color Doppler. In the analysis of the vascular system, and in particular for carotid and vessels of the lower extremities, Doppler is very useful because it allows quantification of the blood velocity. B-mode ultrasound is mainly used for the analysis of the carotid artery where identification and characterization of the plaque represent an important step in defining the risk of cerebrovascular event.
One of the most used applications of ultrasound is the identification and quantification of the so-called intima-media thickness, which is considered a measurable index for the presence of atherosclerosis (Fig. 13.6).
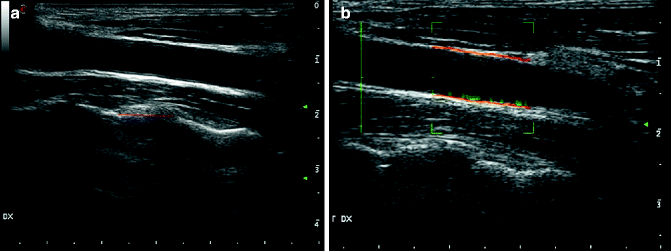

Fig. 13.6
Intima-media thickness. Intima-media thickness in a 36-year-old patient (a); panel b shows an automated system for automatically detecting the intima-media thickness
13.2.4 Other Techniques
Digital subtraction angiography (DSA) (Fig. 13.7) was considered the gold standard imaging reference for the evaluation of vascular pathology. However, its diagnostic role has been widely criticized for the limited number of views, costs, and the small but definite risk of complications. Nowadays in most institutions, where adequate CT and/or MR technology is available, the diagnostic use of DSA is limited to a small number of cases in which there is no agreement between two or more noninvasive tests. Instead, DSA procedures are only performed when endovascular treatment is needed.
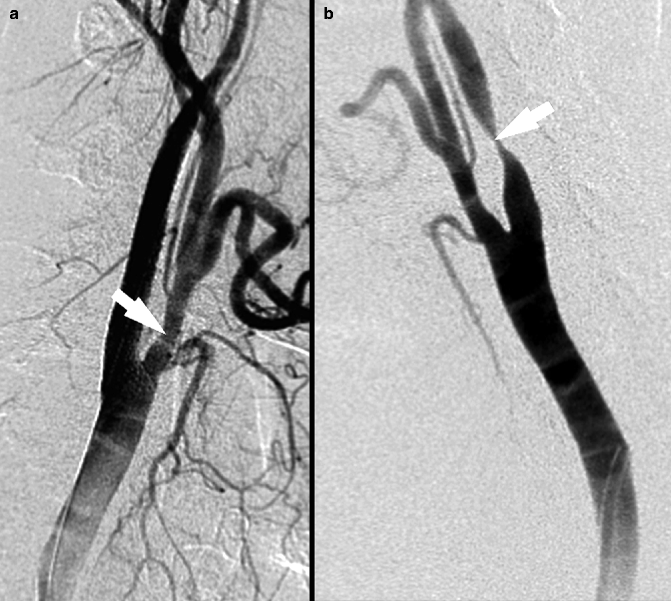

Fig. 13.7
Digital subtraction angiography images. In panel a 30 % NASCET stenosis is visible; panel b shows a NASCET stenosis of 80 %, arrows indicates point of maximum stenosis
Recently, other techniques have emerged that allow identification and characterization of pathology that may affect the body vessels. In particular positron emission tomography (PET) and optical coherence tomography (OCT) should be cited. In recent years a variety of studies have been performed with the intent to assess the diagnostic potential of 18F-FDG PET in the quantification of plaque inflammation: based on the assumption that unstable, inflamed plaques are infiltrated by lymphocytes and macrophages and that this latter cell population can absorb 18F-FDG from the interstitial spaces, 18F-FDG PET can be used to directly detect plaque inflammation in various anatomic locations (Tawakol et al. 2006).
Molecular imaging is a new and revolutionary field. The development of multimodal, multifunctional nanoparticles, in particular when imaging the carotid arteries, is a growing field which can help our understanding of the underlying disease processes and which might help to improve the treatment of vascular diseases. During the development of atherosclerosis, complex interactions take place at the molecular and cellular level, with various atherosclerosis-related biomarkers present at different stages of the disease progression.
Currently, a number of molecular markers have been evaluated for molecular imaging of atherosclerosis. These markers are known components of atheromas in animal models with advanced atherosclerosis. Because of the limited imaging contrast from most of these biomarkers, external contrast agents that target certain biomarkers are introduced for different imaging modalities. Molecular imaging is used mainly in carotid artery plaque analysis because it allows one to study and characterize in vivo the presence and activity of a number of molecules and cells related to the atherosclerotic disease and inflammation process.
OCT is an optical signal acquisition method that can produce three-dimensional images with micrometer resolution from optical scattering media. OCT is an interferometric technique and typically uses near-infrared light. This technique has been used in cardiology to help diagnose coronary artery disease (Tahara et al. 2010; Guagliumi et al. 2010; Guagliumi and Sirbu 2008)
13.3 Imaging of Carotid Arteries
13.3.1 Introduction
Carotid atherosclerosis is one of the major causes of ischemic stroke, one of the most common causes of death and disability in the world (Sacco et al. 2006). The microscopic alterations of the initial phase of this disease start during childhood, but usually carotid plaques remain asymptomatic until an advanced pathological stage is reached. In the 1980s and 1990s, the degree of carotid artery stenosis was considered the only determinant factor for treatment, while at present several other factors are considered potentially important markers for future cerebrovascular events, including plaque composition, presence and state of the fibrous cap, intra-plaque hemorrhage, plaque ulceration, and plaque location (Seeger et al. 1995; Saba et al. 2007a; Saam et al. 2006; Kullo et al. 1998).
Advanced plaque imaging techniques allow analysis of plaque morphology and its characteristics as well as the presence of plaque complications such as ulceration, hemorrhage, and thrombus. The ability to identify plaques that are more prone to fragment and embolize is now vital for the early diagnosis, prevention, and treatment of stroke and neurological side effects.
13.3.2 Imaging Diagnostic Flow Chart
The choice of a specific imaging modality to assess the carotid artery depends mainly on the clinical indication for imaging and the skills available in individual centers. In the past DSA was the most used imaging method for patients with suspected carotid artery pathology, but recently, with the development of noninvasive imaging techniques, DSA is less frequently used (Saba and Mallarini 2009a). In 2008, authors proposed that for patients with a high likelihood of vascular disease, CTA may represent an appropriate first exam (Jaff et al. 2008; Libby 1998), whereas in patients with a low likelihood of vascular disease, ultrasound should be used. If pathology in the carotid arteries is found, CTA as well as MRA can be used to confirm the diagnosis and to accurately determine the precise degree of stenosis and to characterize the plaque composition. DSA is rarely necessary and only used in cases of severe multiple vessels disease, for which assessment of flow direction and collateral patterns may be important or when the image quality of noninvasive procedures is considered to be nondiagnostic.
13.3.3 From Stenosis Degree to Vulnerable Plaque
In the past, the degree of luminal stenosis in the carotid artery has been used as a direct measure of atherosclerosis severity (Fig. 13.8). However, studies in the coronary arteries showed that low stenosis degree may also lead to myocardial infarction (Jaff et al. 2008; Libby 1998; Fuster et al. 1990) and similar results were obtained in the carotid arteries (Lovett et al. 2004a, b). Since low-grade arterial stenosis can lead to cerebrovascular events, it appears important to look beyond the degree of stenosis at plaque morphology and composition.
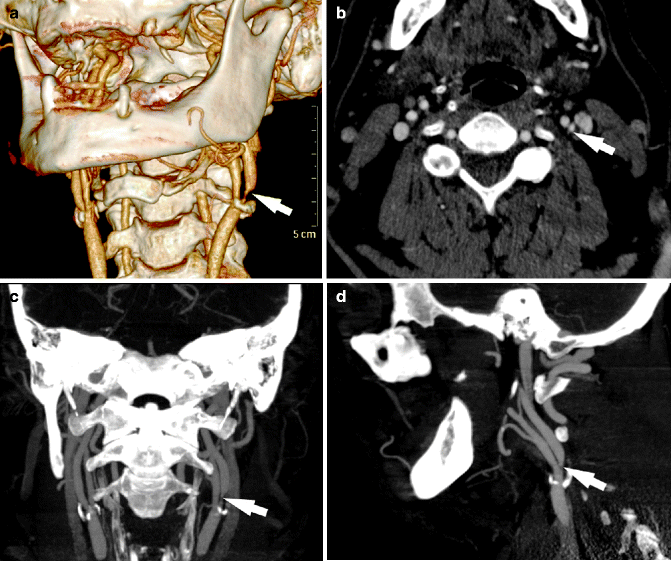

Fig. 13.8
CTA stenosis detection. CT angiography in a 71-year-old patient who suffered a right transient ischemic attack. Volume rendering (a), axial (b), and maximum-intensity projection (c, d) images show a 75 % NASCET stenosis, arrows indicate point of maximum stenosis
Therefore, the concept of vulnerable plaque was introduced into surgical, histopathological, and imaging communities, referring to atheromas containing large necrotic cores covered by a thin or disrupted fibrous cap with a high tendency to rupture, embolize, and induce thrombus formation (Naghavi et al. 2003). Usually, major atherosclerotic alterations occur at the outer wall of the proximal segment and sinus of the internal carotid artery in the region of the lowest wall shear stress. In contrast, plaque thickness is lowest at the side of the flow divider at the junction of the internal and external carotid arteries where wall stress is the highest (Hardie et al. 2007).
13.3.4 Carotid Artery Stenosis Quantification
The degree of stenosis is considered one of the most important parameters in the choice of the therapeutic option. In fact higher grades of carotid stenosis are associated with an increased risk of stroke. Three major methods for measuring carotid artery stenosis have been proposed: the North American Surgery Carotid Endarterectomy Trial (NASCET), the European Carotid Surgery Trial (ECST), and the Carotid Surgery Index (CSI) (North American Symptomatic Carotid Endarterectomy Trial Collaborators 1991; European Carotid Surgery Trialists’ Collaborative Group 1998; Executive Committee for the Asymptomatic Carotid Atherosclerosis Study 1995). These methods evaluate the degree of stenosis as the percentage reduction in the linear diameter of the artery. There are differences in the evaluation of the degree of stenosis among NASCET, ECST, and CSI, and values derived from these methods are not equal: it is always important to specify which classification is being used. NASCET is calculated by using the ratio between the lumen diameter at the site of the stenosis and the normal lumen diameter distally in a non-diseased reference segment. ECST is calculated as the ratio between the lumen diameter at the stenosis and the total carotid diameter at the same location. CSI is calculated by using the ratio between the lumen diameter at the site of the stenosis and the normal lumen of the proximal common carotid artery multiplied by 1.2.
To quantify the degree of the stenosis, both NASCET and ECST measurements have to be performed on a plane exactly perpendicular to the carotid axis. Saba et al. demonstrated that NASCET and ECST show a strong correlation and that interobserver and intraobserver agreement values are high for both NASCET and ECST (Saba and Mallarini 2010a, b). Moreover NASCET, ECST, and CSI can be converted into each other with good results.
In the evaluation of carotid artery stenosis, ultrasound, CTA, and MRA are widely used. Nowadays, ultrasound is commonly performed to screen patients with possible carotid artery disease, but the accuracy of ultrasound echo-color Doppler is moderate if the purpose is the determination of the degree of stenosis (Eliasziw et al. 1995). In some institutions, the only diagnostic imaging test used for selecting patients for carotid endarterectomy is ultrasound, but this approach may lead to critical errors and has been widely criticized (Eliasziw et al. 1995; Polak et al. 1993; Goodson et al. 1987; Dawson et al. 1993).
Nowadays, CTA probably represents the best imaging method to quantify carotid artery stenosis: its sensitivity is comparable to angiography, but it is associated with fewer risks (Sameshima et al. 1999; Verhoek et al. 1999). In particular CTA sensitivity for stenosis between 70 and 99 % in internal carotid artery, using DSA as reference standard, can reach excellent results.
MRA has become widely used as a noninvasive diagnostic imaging modality for carotid artery stenosis quantification because it avoids the radiation and iodinated contrast exposure associated with CTA, and has a good sensitivity in the detection of the degree of stenosis (sensitivity of 93 % and a specificity of 88 %) associated with excellent potential to characterize plaque composition and morphology (Yucel et al. 1999). ToF is a very simple technique to image carotid arteries by using MRI, but it overestimates the degree of stenosis. CE-MRA offers better results, compared to ToF, but suffers one limitation: the inherent risks of administering the contrast material.
Recently new concepts have been proposed to quantify arterial stenosis in the atherosclerotic carotid artery; in particular with the introduction of MDCTA, thanks to its high spatial resolution (with isotropic voxels of 1 mm), a new direct millimeter method has been proposed by Bartlett and colleagues (Bartlett et al. 2006a, b, 2007) to overcome limitations of the classical percent methods like NASCET, ECST, and CSI. The authors showed that threshold values of 1.4–2.2 mm can be used to evaluate for moderate stenosis (50–69 % according to NASCET) with a sensitivity of 75 % and a specificity of 93.8 %, whereas a diameter of 1.3 mm corresponds to 70 % stenosis with a sensitivity of 88 % and a specificity of 92 %. The use of a direct millimeter method for the quantification of the carotid artery stenosis represents a very interesting option because it is possible to avoid cumbersome calculus and because the direct millimeter method overcomes the use of ratio-percent methods. Saba and Mallarini (2010b) confirmed the observations of Bartlett by showing that simple millimeter measurement of stenosis can reliably predict NASCET-type, ECST-type, and CSI-type percent stenosis.
13.3.5 Carotid Artery Plaque Characterization
It has been clearly demonstrated that diseased carotid arteries can contain large amounts of atherosclerotic mass without significant luminal narrowing due to compensatory outward remodeling of the artery (Toussaint et al. 1996). Thus, imaging methods that can reliably depict the lumen and the wall are needed to quantify the atherosclerotic plaque burden. For this reason it may be important to look beyond the degree of stenosis and try to determine plaque characteristics. By using CTA plaque has been differentiated into three categories, including fatty, mixed, and calcified lesions (Fig. 13.9), according to the Hounsfield unit (HU) measured in the plaque. In this classification, fatty (soft) plaques are those with a density value <50 HU, mixed plaques have density values between 50 and 119 HU, and calcified plaques have a density >120 HU. It has been demonstrated that HU measurements in the center of fibrous-rich regions and lipid core are significantly different, and it has been suggested that very hypodense regions (<30 HU) in the center of atherosclerotic carotid plaque are associated with the presence of a lipid core (e.g., lipid, hemorrhage, or necrotic debris). It is important to underline that fatty plaques at CTA are often associated with the presence of a lipid core, once thought to be an inert deposition of lipid, but now known to be a highly biologically active area. In carotid plaque analysis, two main parameters should be evaluated: morphology and composition. The plaque morphology can be classified into normal, irregular, or ulcerated (Fig. 13.10). Rothwell et al., by using DSA, demonstrated that irregular morphology is associated with the presence of cerebrovascular events (Rothwell et al. 2000). A plaque ulceration has been defined as “an intimal defect larger than 1,000 μm in width, exposing the necrotic core of the atheromatous plaque” (Saba et al. 2007b, c). It is important to identify this condition because ulcerated carotid plaques are associated with a higher risk of stroke or transient ischemic attack. Kim et al. (2000) demonstrated that the presence of ulceration alone is an important risk for neurological symptoms and a high-grade stenosis, combined with plaque ulceration, results in an increased risk of stroke. The NASCET study showed that in the group of patients who received medical therapy, 30 % of the patients who had a severe carotid stenosis associated with an ulcerated plaque suffered an ischemic cerebral event within 2 years, while only 17 % of patients with severe stenosis but no ulcerated plaques had an ischemic cerebral event within 2 years (European Carotid Surgery Trialists’ Collaborative Group 1998). Among the imaging techniques, DSA was not sufficiently reliable for detecting ulcers in the carotid plaque (the sensitivity was 74 % and the specificity was 46 %) (Randoux et al. 2001; Walker et al. 2002), whereas MDCTA showed optimal results with a sensitivity of 93 % (Saba et al. 2007b); the presence of heavily calcified plaque limits CTA in the detection of ulcers (Schwartz et al. 1992; Cumming and Morrow 1994). Also, MRI showed good results in detecting plaque ulceration (Alvarez-Linera et al. 2003), whereas the results obtained by ultrasound are quite low, with a sensitivity of 38 %. When analyzing the plaque composition, two parameters should be identified: the fibrous cap and plaque characteristics.
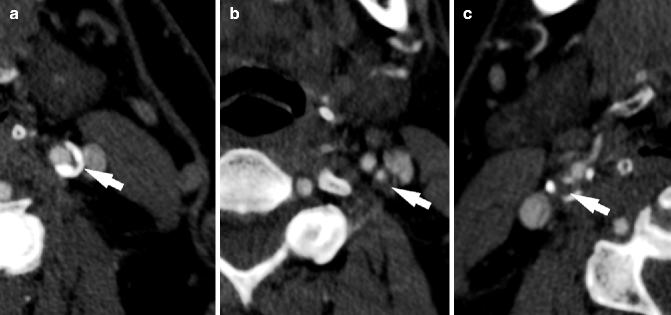
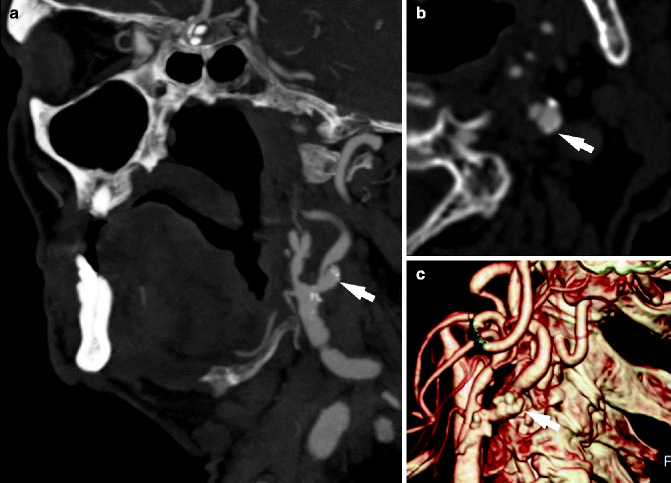

Fig. 13.9
Different types of plaques according to HU values. CTA examples of calcified (a), mixed (b), and fatty (c) plaques, arrows indicate the plaque

Fig. 13.10
Ulcerated carotid artery plaque in a 65-year-old patient with left-sided stroke. Maximum-intensity projection (c, d), axial (b), and volume rendering (a) images show an ulcerated plaque in the left internal carotid artery, arrows indicate the ulcer
The fibrous cap is a layer of fibrous connective tissue. It has been well demonstrated that a thin fibrous cap and its rupture are associated with the presence of strokes or transient ischemic attack. Saba and Mallarini (2009b), using CTA, showed that the presence of a fissured fibrous cap was associated with cerebrovascular events (p = 0.0032). MRI is nowadays the best imaging technique to study the fibrous cap, its thickness, and its fissuration (Parker et al. 1991; Mitsumori et al. 2003; Kramer et al. 2004; Wasserman et al. 2002). In the literature it is quite well demonstrated that high-resolution MRI using blood- and fat-suppressed sequences (black-blood MRI) can well distinguish intact, thick fibrous caps from thin or ruptured fibrous caps. On MRI a thick fibrous cap appears as a juxtaluminal band of low signal in ToF images. In plaques with thin fibrous caps, this dark juxtaluminal band is absent. In plaques with a ruptured fibrous cap, the dark band is absent and there is a region of hyperintense signal adjacent to the lumen. Ultrasound showed suboptimal results in the study of the fibrous cap; Waki et al. (2003) demonstrated that ultrasound can distinguish between thin and thick fibrous caps in correlation with histology, but Sztajzelet et al. (2005), studying 31 plaques derived from 28 patients undergoing carotid endarterectomy, obtained a sensitivity and specificity of 73 and 67 %, respectively, in quantification of the thickness of the fibrous cap. The use of CT in assessing fibrous caps has not been studied extensively, and its sensitivity is still debatable. Saba and Mallarini (2009b) proposed CTA for the study of fissured fibrous caps, and Wintermark et al. (2008b, c; Arora et al. 2010) demonstrated that it is possible to measure fibrous cap thickness by using an automatic computer algorithm that quantitatively assesses the thickness of the fibrous cap, with significant results compared to histopathology (R 2 = 0.77).
In the analysis of the plaque characteristics, the identification and quantification of calcium represents an important step because the presence of calcium in the carotid artery plaque seems to relate to a lower risk of cerebrovascular events (Nandalur et al. 2005, 2007; Saba et al. 2009; Hunt et al. 2002); in fact it is hypothesized that calcium may confer stability, resulting in protection against biomechanical stress. The presence of calcium in the carotid artery plaque can be evaluated by using CTA, MRA, or color Doppler echocardiography, but the most sensitive technique in detection, characterization, and quantification remains CTA because of the high coefficient of linear attenuation produced by CT calcium imaging (Fig. 13.11).
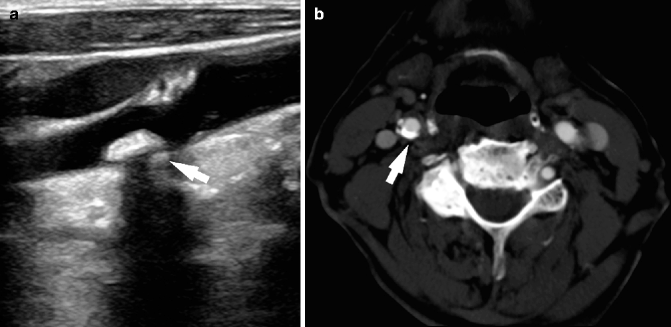

Fig. 13.11
Calcified plaque (arrows). Examples of calcified plaque in ultrasound (a) and CT (b). In panel a the acoustic shadowing determined by the calcific components of the plaque is clearly visible, arrows indicate in both panels the calcified plaques
Another important plaque characteristic is intra-plaque hemorrhage. It is hypothesized that the extravasation of red blood cells or iron accumulation in plaque may represent plaque instability and promote plaque progression (Kolodgie et al. 2003). The mechanisms that lead to intra-plaque hemorrhage are still debated. In an old study by Patterson (1938), it was hypothesized that intra-plaque hemorrhage is secondary to the rupture of the vasa vasorum, but other authors suggested that the condition is due to cracks or fissures that may originate at the luminal surface (Davies and Thomas 1985; Constantinides 1966). It is interesting to observe that intra-plaque hemorrhages are more common in those carotid arteries that have a stenosis >70 %. MRI is considered the best imaging technique to identify intra-plaque hemorrhage. In 2003 Moody and colleagues (2003) showed that T1-weighted sequences are very sensitive in this kind of identification. Ultrasound is not very sensitive in the identification of hemorrhage; sometimes intra-plaque hemorrhage can be identified by the presence of a hypo-echogenic area within the plaque (Tahmasebpour et al. 2005). Whether it is possible to visualize intra-plaque hemorrhage with CTA is still debated. Recently, a paper by U-King-Im et al. (2010) showed that mean CT plaque density was higher for plaques with MRI-defined intraparenchymal hemorrhage (47 HU) compared with without intraparenchymal hemorrhage (43 HU; P = 0.02). Other authors showed that automated software classification may correctly detect intra-plaque hemorrhage (Wintermark et al. 2008d).
Another significant feature of carotid artery plaque is the presence or absence of thrombus. It is accepted that the presence of a plaque thrombus is a risk factor for the development of cerebrovascular events because the thrombus may determine the development of distal embolization. An association between plaque thrombus and ulcerated carotid plaque has been described (Rothwell et al. 2000). Even in this case the best imaging modality to study this condition is probably MRI which has the potential to distinguish fresh thrombi from 1-week-old thrombi and occluding old thrombi (Funaki et al. 2011; Altaf et al. 2011).
13.4 Central Vessels
13.4.1 Aorta
In the past 15 years, great advancements have been made in the development of imaging procedures and techniques to explore thoracic and abdominal aortic pathology. In particular the development of MDCTA has led to shorter scanning times and higher spatial resolutions, this allowing a fast diagnosis of conditions like aneurysm rupture and arterial dissections. Nowadays, it is possible to quickly and accurately diagnose a wide range of traumatic and nontraumatic aortic conditions. For these reasons, nowadays, CTA is the preferred method for imaging in emergency abdominal vascular conditions because it enables the acquisition of high-spatial-resolution volumetric image data during a single-breath hold. The most frequent and severe conditions, in particular in elderly people, are abdominal aortic aneurysms and its rupture and aortic dissections.
13.4.1.1 Abdominal Aortic Aneurysm
An arterial aneurysm is defined as a focal dilation of a blood vessel with respect to the original artery. Each year in the United States, abdominal aortic aneurysm (AAA) ruptures cause 4,500 deaths, with an additional 1,400 deaths resulting from the 45,000 repair procedures performed to prevent a rupture. Aneurysmal dilation of the aorta is present when there is a diameter of more than 32 mm in the case of thoracic aorta and 29 mm in the case of infrarenal abdominal aorta (Mewhort et al. 2011; Budde et al. 2011; Frauenfelder et al. 2004). Based on this criterion, the study authors reported that 9 % of all people older than 65 have an AAA (Alcorn et al. 1996; Baumgartner et al. 2008). It was reported that the 1-year incidence of AAA rupture according to initial diameter was 9.4 % for diameters of 5.5–5.9 cm, 10.2 % for diameters of 6.0–6.9 cm (19.1 % for the subgroup of 6.5–6.9 cm), and 32.5 % for diameters of 7.0 cm or more (Lederle et al. 2002; Conway et al. 2001; Reed et al. 1997). Approximately 80 % of aortic aneurysms occur between the aortic bifurcation and the renal arteries. Aortic aneurysms constitute the 14th leading cause of death in the United States. The decision to screen for AAA is difficult to make because it would expose many previously undiagnosed small aneurysms that are unlikely to rupture, resulting in needless disease labeling because only aneurysms of a certain size are considered for surgery, with smaller aneurysms subject to watchful waiting. In the past authors analyzed the effectiveness of population-based screening for AAA with abdominal ultrasound in people older than 65 years of age (Fleming et al. 2005) and concluded that a mortality reduction of approximately 50 % can be obtained by using ultrasound screening (Norman et al. 2004).
It is possible to detect and characterize AAA by using ultrasound, MR, and CT, but nowadays the best imaging modality to identify and characterize the presence of AAA is CTA. By using CTA it is possible to gather all necessary information to select the correct therapeutic approach. The introduction of MDCT technology allowed noninvasive imaging of the abdominal aorta (Fig. 13.12) and iliac arteries with improved spatial resolution and temporal resolution, thanks to the use of a thinner collimation. Moreover, CTA is commonly considered the standard of reference in the detection of endoleaks because of its noninvasive nature, widespread availability, and high sensitivity and specificity (Harris et al. 1999; Hittmair and Fleischmann 2001; Gorich et al. 2001). High-quality MDCTA can be obtained with the use of thin collimations (1–2 mm), which allow increased spatial resolution of both axial and 3D images.
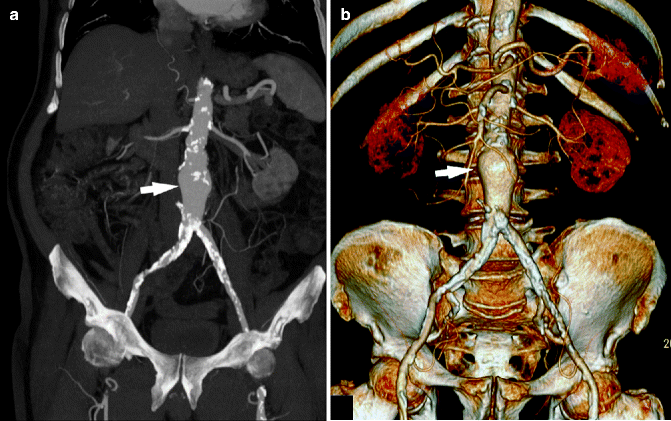

Fig. 13.12
Abdominal aortic aneurysm. Maximum-intensity projection (a) and volume-rendered (b) post-processed CTA images show an abdominal aortic aneurysm (white arrow) in a 61-year-old patient
MRI also showed good results in the detection and characterization of AAA (Kaufman et al. 1994; Weishaupt et al. 2000; Atar et al. 2006; Schwope et al. 2007), but this technique also has great potential to study the wall of the AAA by analyzing the uptake of the macrophage-specific contrast agent using ultra-small paramagnetic iron oxide (Truijers et al. 2009). The authors demonstrated that iron oxide uptake is limited or absent in the wall of normal-sized aortas and most aneurysms but individual abdominal aortic aneurysms exhibit high levels of uptake, indicative of extensive macrophage infiltration in the aneurysm wall.
It was found that aneurysm size is one of the strongest predictors of the risk of rupture (Aggarwal et al. 2011), with risk increasing markedly with aneurysm diameters greater than 5.5 cm; in fact the 5-year overall cumulative rupture rate of incidentally diagnosed AAA is 25–40 % for aneurysms larger than 5.0 cm, compared with 1–7 % for aneurysms 4.0–5.0 cm in diameter (Johansson et al. 1990


Stay updated, free articles. Join our Telegram channel

Full access? Get Clinical Tree


