3 Cerebrovascular Diseases
Brain Infarction
Frequency: a leading indication for computed tomography (CT) examination and a very common CT diagnosis.
Suggestive morphologic findings: hyperdense middle cerebral artery (MCA); loss of definition of the basal ganglia and insular region (early sign); hypodensity with moderate mass effect in the distribution of a cerebral artery (territorial infarction with embolic occlusion); lacunar or cortical lesion; contrast enhancement at the appropriate stage of clinical evolution (third day to third week after stroke).
Procedure: early diagnosis is desirable. Exclude hemorrhage, determine whether angiography is required. Consider atypical causes (vasculitis, dissection, dural sinus thrombosis).
Other studies: CT is the modality of choice, even in special cases. Modern magnetic resonance imaging (MRI) techniques (diffusion-weighted images) allow very early diagnosis. MRI can also demonstrate the brain stem without artifacts. With the higher contrast sensitivity of MRI, even subtle foci of enhancement can be detected.
Checklist for scan interpretation:
 Location of suspected infarcted areas?
 Intracerebral hemorrhage?
 Age of the infarct(s)?
 Infarction due to microangiopathy, macroangiopathy, or other cause?
 Follow-up?
 Need for MRI or angiography?
 Pathogenesis
A distinction is made between microangiopathic and macroangiopathic disease in the pathogenesis of brain infarction. Microangiopathic disease includes changes that develop in the distribution of the long medullary arteries:
• Supratentorial lacunar infarcts
• Subcortical atherosclerotic encephalopathy
Macroangiopathic disease consists of:
• Embolic territorial infarctions
• Hemodynamic (watershed and end-zone) infarctions
Territorial infarctions. Territorial infarctions result from embolism or thrombosis. The embolism may have a cardiac origin in patients with a corresponding history (atrial thrombi due to absolute arrhythmia, mitral stenosis), or emboli may be shed from the walls of large arteries supplying the brain. A classic pattern results from embolic occlusion of the main trunk of the MCA. In other cases, portions of the MCA territory may become infarcted due to the occlusion of specific branches.
Hemodynamic infarction. Hemodynamically induced infarcts may be of the watershed (border-zone) or end-zone type. They are based on a reduction in cerebral perfusion caused by occlusion or stenosis of large cervical arteries or basal cerebral arteries, leading to insufficiency in the more distal branches of the arterial tree. Each type may occur in isolation, or the two types may coexist. The anterior and posterior communicating arteries can compensate for occlusion or stenosis of individual vessels, but the circle of Willis may be unable to provide adequate collateral flow, depending on the location and extent of the flow-reducing lesions.
Subcortical atherosclerotic encephalopathy. This refers to marked atherosclerotic changes found in the basal arteries of the brain. Atherosclerotic changes are also found in the long penetrating medullary arteries (medial thickening with stenoses and occlusions). By contrast, the vessels supplying the cerebral cortex show minimal histologic changes. Given the nature of the vascular changes, only isolated cortical foci are affected by ischemic necrosis. White-matter changes are pronounced, however, and consist of demyelination, axonal degeneration, and microglial proliferation.
Other causes. Besides the changes described above, which are based on atherosclerotic lesions and are the most frequent cause of brain infarction, the following additional causes should be considered:
• Dissection
• Vasospasm
• Dural sinus thrombosis
 Frequency
Embolic infarction is considerably more common than hemodynamic infarction. Since the advent of antihypertensive therapies, hypertensive causes of cerebral blood flow disturbances (subcortical atherosclerotic encephalopathy, lacunar infarcts) have become less frequent. Supratentorial infarcts are over ten times more common than infratentorial infarcts.
 Clinical Manifestations
The term stroke denotes a clinical syndrome characterized by the sudden onset of focal neurologic deficits (Fig. 3.1). Conditions other than ischemic brain lesions should be considered in the differential diagnosis.
Among the clinical manifestations of hemodynamic infarction, sensorimotor hemiparesis has been reported for end-zone infarcts. Anterior watershed infarction is characterized by hemiparesis predominantly affecting one leg, and posterior watershed infarction by homonymous lower-quadrant hemianopia.
Lacunar infarcts typically produce combinations of symptoms, and sensory deficits are common. A clinical diagnosis of homonymous hemianopia, aphasia, coma, or seizures does not support the diagnosis of a lacunar infarct—or at least, an infarction of this type cannot account for these symptoms by itself.
Lacunar infarcts most commonly occur in hypertensive individuals, and have a favorable prognosis.
In subcortical atherosclerotic encephalopathy (Binswanger disease), lacunar infarcts lead to sensory and motor deficits. The dementia in this condition is attributed to extensive demyelination. Binswanger disease is secondary to protracted hypertension.
 CT Morphology
Territorial Infarctions
The most important early signs of cerebral infarction on plain CT scans are the hyperdense MCA sign (Fig. 3.2a) and loss of definition of the basal ganglia (Fig. 3.2 b).
Both signs can be observed at a time after stroke when systemic thrombolytic therapy can still be beneficial. The hyperdense MCA sign (and increased density of other vascular segments that are less often and less easily visualized) is based on an acute embolic occlusion that usually affects the MCA segment proximal to its bifurcation (M1 segment). With further evolution of the stroke, the infarcted area often becomes more clearly demarcated, due to the low density of the surrounding brain. Loss of definition of the basal ganglia affects the anterior areas. Normally, the basal ganglia are clearly delineated from the hypodense internal and external capsule by their somewhat higher attenuation. In the initial hours after a stroke, the basal ganglia become slightly less attenuating and more isodense in relation to the capsule. The entire region then shows a slight, homogeneous low density. It should be noted that loss of definition of the basal ganglia signifies an infarction of the MCA, which supplies the anterior basal ganglia. With further evolution of the territorial infarction, brain swelling in the infarcted area leads to effacement of the sulci, variable hypodensity of the brain parenchyma, and other signs of mass effect such as slight ventricular compression (Fig. 3.3).
If the occlusion is located near the circle of Willis and there is deficient collateral flow, the entire territory of the posterior, middle, or (less commonly) the anterior cerebral artery will be affected (Fig. 3.4).
If the occlusion is limited to peripheral branches, only part of the arterial territory will be affected (Fig. 3.5a). Many of these infarcts are wedge-shaped. Cortical infarcts display a gyral pattern of involvement (Fig. 3.5 b, c).

Fig. 3.1 Brain-stem infarction. Involvement of the left accessory nerve is evidenced by the lateral head tilt and the effacement of the left supraclavicular fossa. There is accompanying palsy of the trapezius and sternocleidomastoid muscles.
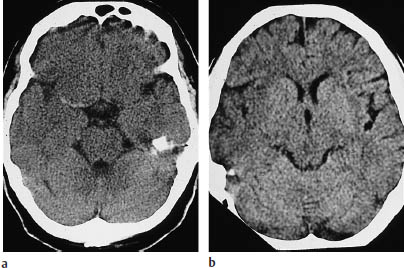
Fig. 3.2a, b Early signs of ischemic infarction:
a Hyperdense middle cerebral artery (MCA) sign. The MCA on one side (here the right) appears hyperdense due to fresh thrombosis. The dependent portion of the MCA territory still appears unchanged.
b Loss of definition of the right basal ganglia and insular region is noted when the sides are compared.
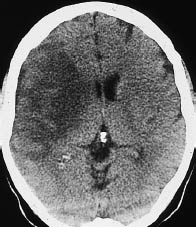
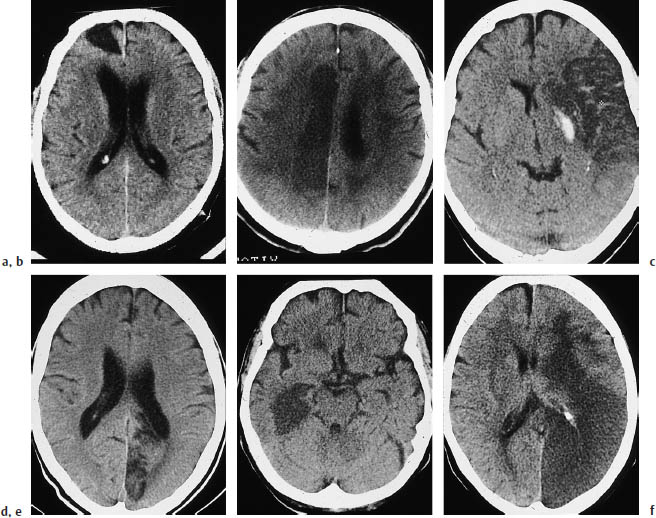
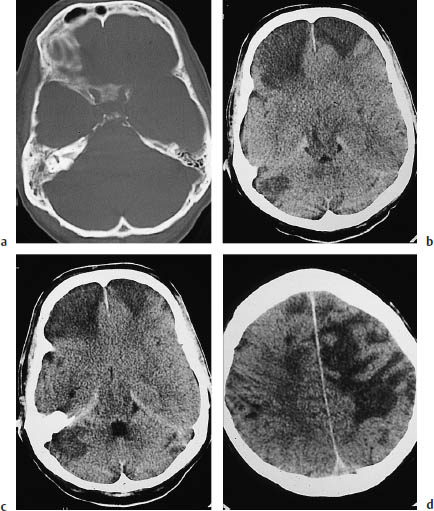
Fig.3.4a–f Typical CT features of territorial infarctions in one of the three major arterial territories.
a Infarction in the territory of the anterior cerebral artery may involve a wedge-shaped area next to the anterior part of the falx in the frontal lobe.
b Another pattern consists of tissue destruction near the midline in the superior portions of the brain.
c This scan shows hemorrhage within a subacute, incomplete infarction of the left middle cerebral artery (MCA). The infarct involves the lentiform nucleus. The left ventricular system is markedly compressed and shifted across the midline.
d Infarction in the posterior cerebral artery territory in the left hemisphere.
e This scan show another posterior territory infarct that extends into medial portions of the temporal lobe.
f Multiple-territory infarction involving both the right middle and posterior cerebral arteries.
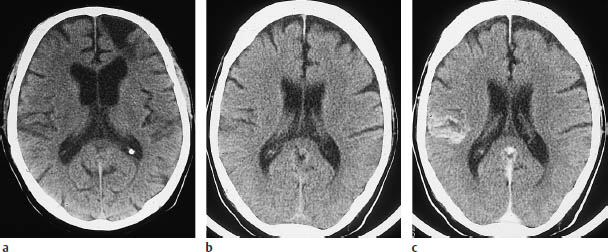
a Involvement of both the cortex and white matter leads to a peripheral wedge-shaped infarct.
b, c Cortical infarcts display a typical gyral pattern (b plain, c postcontrast).
An infarct confined to the brain stem (Fig. 3.6) signifies that leptomeningeal collaterals are delivering adequate blood to the portions of the cortex and white matter supplied by the MCA.
These infarcts are also territorial infarcts, and should be managed accordingly.
Hemodynamic Infarctions
Hemodynamic infarctions result from a reduction in perfusion pressure caused by highgrade stenotic arterial lesions in the neck. These lesions are often bilateral and may coexist with stenoses in the circle of Willis. The resulting distal-field insufficiency can lead to an end-zone infarction (Fig. 3.7) or watershed infarction (Fig. 3.8).
Watershed infarctions can develop in any of the following areas:
• The anterior watershed area, between the territories of the anterior and middle cerebral arteries.
• The posterior watershed area, between the territories of the middle and posterior cerebral arteries.
• The subcortical watershed area, between the deep and superficial branches of the middle cerebral artery.
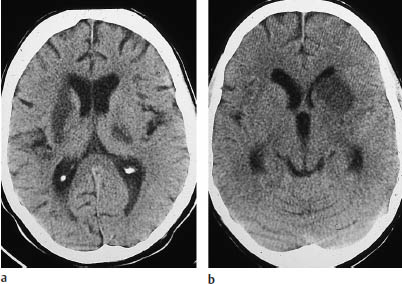
Fig. 3.6a, b Basal ganglia infarcts. These brain-stem infarcts in the distribution of the middle cerebral artery are not accompanied by infarction of the dependent white matter or associated cortex.
a The left lentiform nucleus is infarcted along with the posterior crus of the right internal capsule.
b Isolated infarction of the head of the left caudate nucleus. Because the penetrating medullary arteries are unaffected, lacunar infarcts are absent.
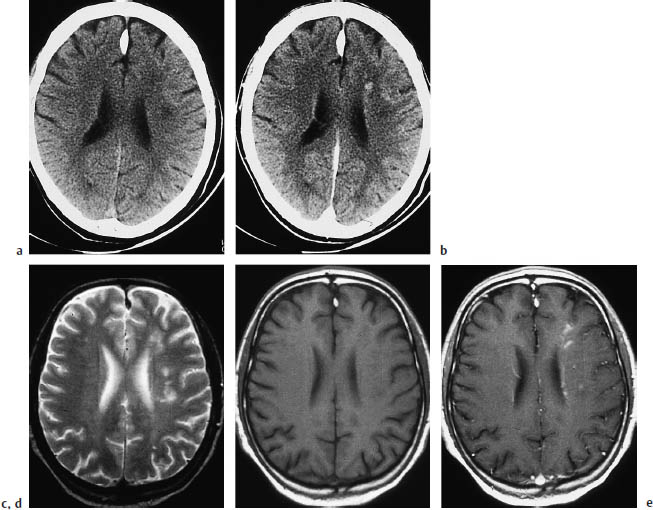
Fig. 3.7a–e End-zone infarction.
a, b CT (a plain, b postcontrast) shows characteristic end-zone infarcts in the territory of the deep medullary arteries. These infarcts occur in the centrum semiovale or above the ventricles and show a string-of-beads pattern in pronounced cases.
c–e The CT findings are surprisingly subtle when compared with magnetic resonance images in the same patient.
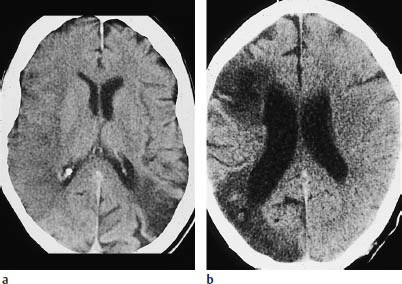
Fig. 3.8a, b Watershed infarction. Watershed infarcts are sometimes difficult to distinguish from infarcts of the far anterior or far posterior middle cerebral artery (MCA) branches.
a Left posterior watershed infarction accompanied by a complete right MCA infarction undergoing demarcation.
b Posterior watershed infarction and partial MCA infarction on the right side.
End-zone infarcts are located in the periventricular white matter or centrum semiovale, and produce remarkably subtle changes in CT density compared with MRI.
Microangiopathy
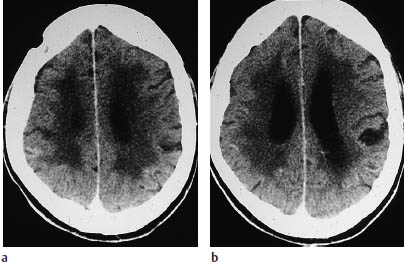
Subcortical atherosclerotic encephalopathy (Fig. 3.9, Binswanger disease) is characterized by internal and external cerebral atrophy.
Ventricular enlargement in this disease is somewhat more pronounced than expansion of the subarachnoid spaces. In addition, lacunar infarcts are detected in the basal ganglia and white matter. White-matter hypodensity is usually bilateral and shows an approximately symmetrical distribution.
Evolution of CT Density Changes
Besides the morphologic CT patterns that characterize particular types of stroke, it is important to consider the density changes that are observed in the different stages.
Acute stage. Any of the following early signs may be noted on CT scans acquired during the initial hours after onset (acute stage):
• Hyperdense MCA sign (Fig. 3.2a) refers to unilateral increased density of the MCA due to its occlusion by a thrombus. This sign precedes infarction-induced density changes in the brain tissue supplied by the vessel.
• Loss of definition of the basal ganglia (Fig. 3.2 b) is another early CT sign of infarction.
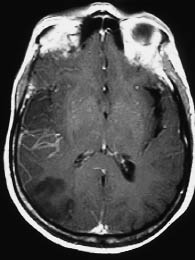
Fig. 3.10 Intravascular and meningeal enhancement as early signs of cerebral infarction on magnetic resonance imaging (MRI). With an extensive infarction, MRI shows linear intravascular enhancement (horizontal) in the right middle cerebral artery territory, along with meningeal enhancement in the right parietal area.
It should be noted that the early MRI signs of brain infarction (Fig. 3.10, meningeal and intravascular enhancement in the infarcted area preceding T2-weighted signal enhancement) do not have a correlate on the CT scan.
The next change to occur is mild brain swelling in the infarcted area, which is manifested on CT by effacement of the overlying sulci.
These early signs are followed by the characteristic hypodensity, which is generally seen 12 hours after the stroke.
Subacute stage. In the subacute stage, the infarcted area becomes clearly demarcated as a hypodense lesion. The great majority of infarcts at this stage (approximately 80% on CT) enhance after intravenous contrast administration (Fig. 3.11).
As a general rule of thumb, contrast enhancement of the infarcted area is observed from approximately the third day to the third week after stroke. The CT detection of contrast enhancement is important because a small percentage of infarcts (5–10%) are isodense to the surrounding brain. Today, however, CT detection of enhancement is of limited usefulness in the differential diagnosis of hypodense lesions, and MRI is preferred for the differentiation of brain tumors. MRI is also better than CT for demonstrating gyral enhancement (Fig. 3.12).
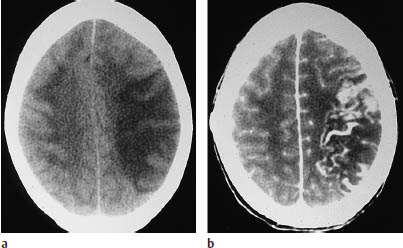
Fig. 3.11a, b Marked contrast enhancement in the luxury perfusion stage of an infarction.
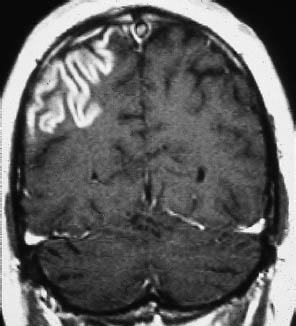
Fig. 3.12 Gyral enhancement on magnetic resonance imaging. Signal enhancement traces a conspicuous gyral pattern on the post-gadolinium magnetic resonance image.
The enhancement on CT scans tends to be patchy, hazy, and indistinct.
Chronic stage. Evolution to the chronic stage is marked by a hypodense parenchymal defect with attenuation values equivalent to CSF. The margins of the defect are generally well-defined (Fig. 3.13).
Associated Findings
Besides CT findings in the infarcted areas, one should be alert for changes that may be found in association with stroke. These include traumatic brain injuries that may be sustained when the stroke occurs (Fig.3.14).
Skull fractures and various types of intracranial hemorrhage may be observed. CT may also demonstrate iatrogenic changes, such as an emergency craniotomy performed to relieve intracranial pressure due to brain swelling (Fig. 3.15).
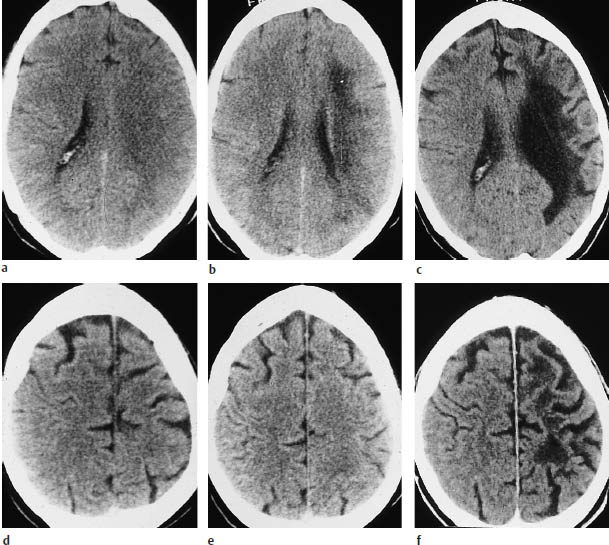
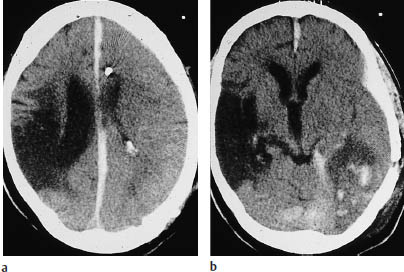
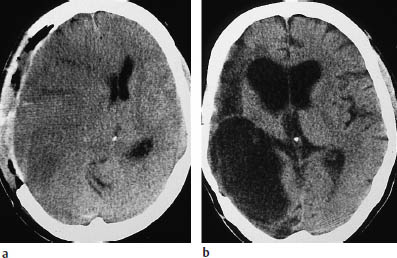
Fig. 3.15a, b Evolution of a middle cerebral artery (MCA) infarction.
a A craniotomy was performed to relieve intracranial mass effect (gross ventricular displacement toward the contralateral side) following a right MCA infarction.
b Follow-up scan documents a large, CSF-isodense parenchymal defect with associated ventricular enlargement.
Cerebellar Infarction
Generally, the incidence of cerebellar infarction is about 10 times lower than that of cerebral infarction. Just as with supratentorial infarctions, a distinction is made between territorial infarcts (superior cerebellar artery, anterior inferior cerebellar artery, posterior inferior cerebellar artery) and watershed infarcts. CT detection of cerebellar infarction is unsatisfactory compared with MRI, due mainly to bone-related artifacts and the lack of multiplanar (especially sagittal) imaging capability.
The examination technique should be modified as follows to achieve the optimum CT visualization of cerebellar infarcts:
• Slice thickness of 2 mm
• Adequate contrast administration (Fig. 3.16)
• Proper gantry angulation, using the temporal lobe projection as required
• Artifact-reducing algorithms (available with modern scanners)
Brain-stem Infarction
Brain-stem infarcts (Fig. 3.17) can lead to typical lateral medulla oblongata “crossed” syndromes, which are known by a variety of terms (such as Weber syndrome and Wallenberg syndrome).
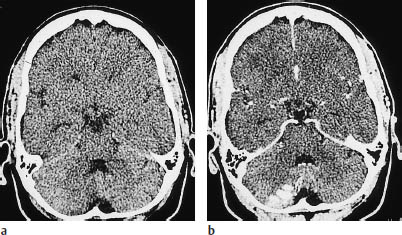
Fig. 3.16a, b Partial infarction in the territory of the posterior inferior cerebellar artery.
a Plain CT demonstrates the infarct as a faint hypodensity.
b Postcontrast CT shows conspicuous enhancement of the infarcted cortical areas.
CT scans are often negative for brain-stem infarcts, due in some cases to inadequate examination technique. Except in the case of large infarcts, for which imaging documentation is often a less pressing concern, scans should be acquired in the temporal lobe projection to eliminate temporal bone artifacts, and a slice thickness of 2 mm should be used. This technique can significantly reduce the need for supplementary MRI. Brain-stem infarcts typically appear as somewhat rounded hypodensities with ill-defined margins. Intravenous contrast administration does not contribute anything to the study.
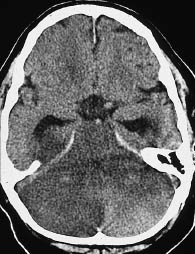
Fig. 3.17 Cerebellar and brain-stem infarction. CT shows marked hypodensity in addition to severe swelling.
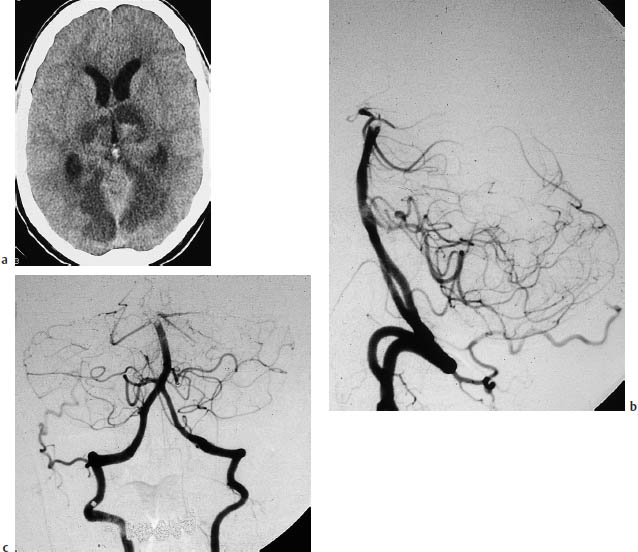
Fig. 3.18a–c Basilar artery thrombosis.
a Typical infarcts due to basilar artery thrombosis.
b, c Angiographic cut-off sign, with opacification of the contralateral vertebral artery.
Brain-stem gliomas and cavernomas have similar morphologic features but are not difficult to distinguish from infarction in routine diagnostic situations.
Infarction at the level of the pons may be a manifestation of basilar artery thrombosis (Fig. 3.18).
Infarction Based on Nonatherosclerotic Vascular Disease (Figs. 3.19–3.22)
A dissection or dissecting aneurysm, occurring when blood enters the vessel wall and separates its layers (Fig. 3.19), should be considered as a cause of brain infarction in younger patients.
A history of neck trauma accompanied by pain in the face or nuchal region suggests dissection in a carotid vessel. Suspicion is raised by Doppler localization of stenoses or occlusions past the bifurcation, although these lesions are difficult to visualize. Angiography raises suspicion by showing tapered vessel narrowing (“peaked-hat sign”), a doublelumen sign, or consecutive sites of luminal narrowing (“string sign”). The diagnosis should not be missed, as the prognosis is favorable with anticoagulant therapy. Either an increase in vessel diameter or a reduction of the perfused lumen may be seen, depending on the entry site of the dissection in the vessel wall. Pseudoaneurysms are also seen. The differential diagnosis should include vessel wall pathology such as fibromuscular dysplasia. Air emboli (Fig. 3.22) lead to disseminated hypodensities at the cortical level.
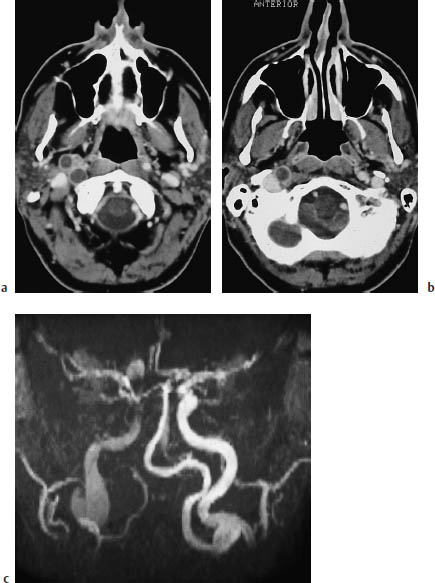
Fig.3.19a–c Infarction (not shown) due to a dissecting aneurysm.
a, b The postcontrast CT of the cerebral supply arteries shows a dissecting aneurysm of the right internal carotid artery, which appears as a second lumen. This finding should not be mistaken for thrombosis.
c The coronal MRI shows aneurysmal dilatation of the vessel.
Embolism secondary to valvular endocarditis has similar features but is often associated with marked enhancement after contrast administration (Fig. 3.23).
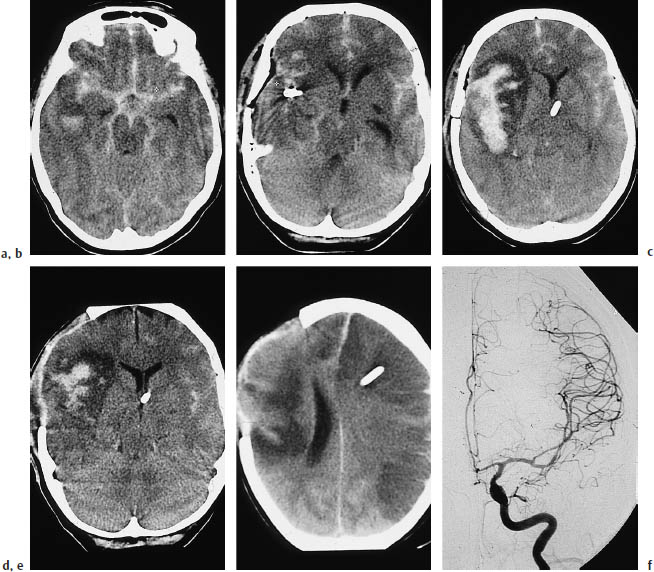
Fig. 3.21a–f Infarction due to vasospasm.
a Subarachnoid hemorrhage in a 60-year-old woman.
b The causative aneurysm was clipped on the second day.
c A scan at a higher level on the same day shows extensive hemorrhage in the sylvian fissure and adjacent parenchyma.
d Craniotomy was performed on day 6for decompression. Note the marked perifocal edema.
e The scan on day 7shows contralateral infarcts in the distribution of the anterior and middle cerebral arteries.
f Angiography demonstrates vasospasms at the origin of the middle cerebral artery.
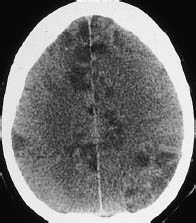
Fig. 3.22 Air emboli. Besides a marked decrease in gray-white matter contrast (brain swelling), plain CT shows multiple disseminated hypodensities in the cerebral cortex. These lesions represent embolic cortical infarcts.
 Differential Diagnosis
Cerebral metastases can be almost indistinguishable from infarcts in certain cases (Fig. 3.24).
Noting the shape of the lesion and correlating it with the known patterns of brain infarction is the best aid to differential diagnosis. It is important to recognize hemodynamic infarcts, as these require further investigation by cerebral angiography (Fig. 3.25a).
Territorial infarcts should be differentiated from low-grade brain tumors, and enhancing lesions require differentiation from highergrade malignancies. An important criterion is whether the detected lesions conform to vascular territories. If contrast enhancement occurs, it should be determined whether the clinical onset is consistent with the period of enhancement in brain infarctions. For example, enhancement occurring three months after the onset of clinical symptoms would not support the diagnosis of a neoplasm. The pattern of contrast enhancement is also helpful in some cases: purely cortical enhancement does not occur with tumors.
When lacunae are found, a long list of differential diagnoses should be considered.
The lesions of multiple sclerosis (Fig. 3.25 b; see also acute disseminated encephalomyelitis) are usually bilateral, and sagittal T2-weighted MRI usually shows involvement of the corpus callosum.
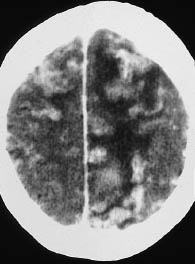
Fig. 3.23 Septic emboli secondary to valvular endocarditis. Postcontrast CT shows enhancing areas in the cerebral cortex that represent cortical infarcts caused by septic emboli. Hypodense perifocal edema is also apparent.
Related posts:
Stay updated, free articles. Join our Telegram channel

Full access? Get Clinical Tree


