Chest CT: Putting It All Together


A chest x-ray is a two-dimensional summation image. We spend time synthesizing the superimposed anatomy on the posteroanterior and lateral into a three-dimensional understanding. Computed tomography (CT) is the opposite task. The anatomy is not superimposed. We have to integrate the axial images mentally to get the overall picture. Your knowledge of the radiographic anatomy will help you understand CT scans. Conversely, CT anatomy will help you better understand radiographic anatomy. First, we need to master the CT anatomy and then develop ways to integrate the information.


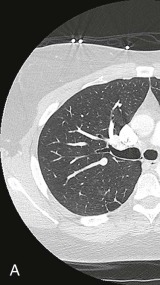
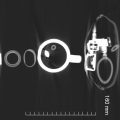
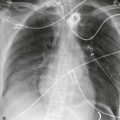
Every CT scan starts with a scout view, a projection image that looks like a second-rate x-ray. As you scroll through the axial images on a monitor, a line on the scout view tells you the level you are looking at. The line in Figure 4-1A shows that the axial images ( Figures 4-1D and 4-1E ) were done at the level of the aortic arch.


  • 1

    (a) The lungs are best seen on Figure 4-1 ____________.


    • (b)

      The mediastinum is best seen on Figures 4-1 ___________ and 4-1 ___________.


    • (c)

      The bones are best seen on Figure 4-1 _____________.


    • B


    • C


    • D


    • E


  • 1

    (a) C


    • (b)

      B and E


    • (c)

      D


  • How did you know? __________________.


    • The vessels are whiter. (Contrast absorbs more radiation.)


  • 3

    Let’s start by analyzing the mediastinum. It is easier to understand the anatomy __________________.


    • A.

      with intravenous contrast medium


    • B.

      without intravenous contrast medium


    • C.

      at bone windows


  • 3

    A. with intravenous contrast medium


  • 4

    We will learn the anatomy with intravenous contrast. Figure 4-2A is called a(n) _________________.


    Figure 4-2A


  • 4

    scout view (also called topogram or scanogram )

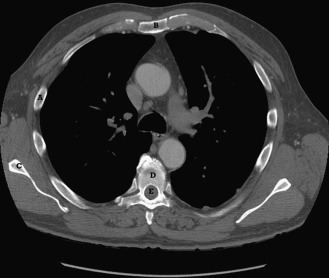
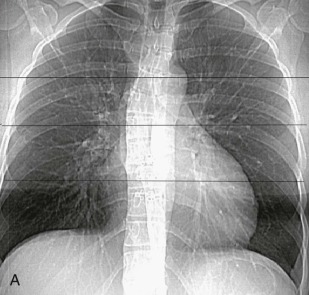
The three lines indicate the scan locations of Figures 4-2B, 4-2C, and 4-2D . Test yourself by identifying the following:


    • A.

      superior vena cava


    • B.

      aortic arch


    • C.

      thymus


    • D.

      trachea


    • E.

      ascending aorta


    • F.

      descending aorta


    • G.

      main pulmonary artery


    • H.

      right pulmonary artery


    • I.

      left ventricle


    • J.

      right ventricle


    • *

      esophagus


    • A.

      _____________________


    • B.

      _____________________


    • C.

      _____________________


    • D.

      _____________________


    • E.

      _____________________


    • F.

      _____________________


    • G.

      _____________________


    • H.

      _____________________


    • I.

      _____________________


    • J.

      _____________________


    • *

      _____________________


    • trachea


    • right ventricle


    • left ventricle


    • right pulmonary artery


    • main pulmonary artery


    • thymus


    • superior vena cava


    • aortic arch


    • descending aorta


    • esophagus


    • ascending aorta


  • 5

    The thymus is a soft tissue triangle in front of the ascending aorta. Like everything else after 40, it turns to _____________.


  • 5

    fat

The pleura and pericardium also are seen on the mediastinal windows in Figure 4-2D . The pleura is seen as a very thin white line lining the thoracic cavity ( posterior arrow ). The pericardium sits between two layers of fat as it encircles the heart ( anterior arrow ). Normally, there is no visible fluid in the pleural space, but there may be some fluid in the pericardial space.


  • 6


    • A.

      pulmonary arteries and veins


    • B.

      trachea, bronchi


    • A.

      The linear and tubular white branching structures are the _________.


    • B.

      The black tubular structures with white borders are the ___________.


    • major fissures


    • trachea, bronchi


    • pulmonary arteries and veins


    • bronchial arteries and veins


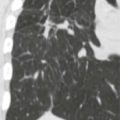
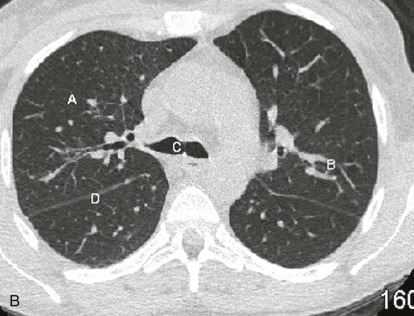
The symmetrical thin white lines from the hilum ( Figure 4-3A ) are the major fissures. They are formed by the visual pleura covering each lobe.


  • 7

    When a CT image is perpendicular to a cylinder (vessel or bronchus), it appears as a ___________.


    • A.

      circle


    • B.

      line


    • C.

      sphere


    • D.

      tube


  • 7

    A. circle


  • 8

    The area between the vessels is the lung parenchyma. The lung is mostly ___________.


    • A.

      soft tissue


    • B.

      water


    • C.

      air


  • 8

    C. air


  • It is ___________.


    • A.

      radiodense


    • B.

      radiolucent


    • B.

      radiolucent


  • Therefore a normal lung appears ___________.


    • A.

      black


    • B.

      white


    • A.

      black


  • 9

    Test yourself on Figure 4-3B . At the carina, identify at lung windows:


    Figure 4-3B


  • 9


    • A.

      normal parenchyma


    • B.

      pulmonary artery or vein


    • C.

      right main stem bronchus


    • D.

      major fissure


    • A.

      _____________________


    • B.

      _____________________


    • C.

      _____________________


    • D.

      _____________________


    • major fissures


    • pulmonary artery or vein


    • right main stem bronchus


    • normal parenchyma


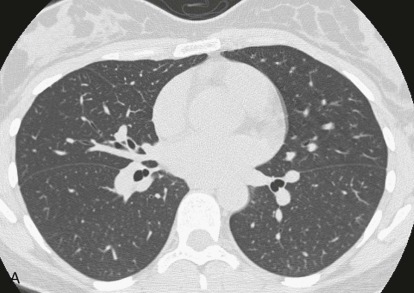
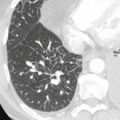
High-resolution CT: To maximize lung detail for evaluating fine interstitial lung disease, we use two strategies: We take thinner sections (1-1.25 mm instead of 2.5 or 5 mm), so there is less overlap with adjacent tissue (i.e., less volumes averaging), and we use CT image reconstruction algorithms that sharpen edges.


  • To achieve the high resolution, the image is approximately ___________ thick.


    • A.

      1.25 mm


    • B.

      2.5 mm


    • C.

      5 mm


    • A.

      1.25 mm


The image is reconstructed with an algorithm that sharpens edges. Figure 4-4B is 2.5 mm thick and a standard reconstruction algorithm. Note the difference in detail.


  • 11

    Pop Quiz: Tissue Density on CT


  • 11


    • A.

      (–)800


    • B.

      0


    • C.

      40


    • D.

      350


    • E.

      40


    • A.

      lung = ___________ HU


    • B.

      fluid = ___________ HU


    • C.

      liver = ___________ HU


    • D.

      bone = ___________ HU


    • E.

      muscle = ___________ HU


    • (–)800


    • (–)40


    • 0


    • 40


    • 350


    • 800


  • 12

    The ribs are difficult to follow because they run obliquely through the axial images. Other bones are easier to follow. Test yourself on Figure 4-5 ; identify at bone windows:


    Get Clinical Tree app for offline access